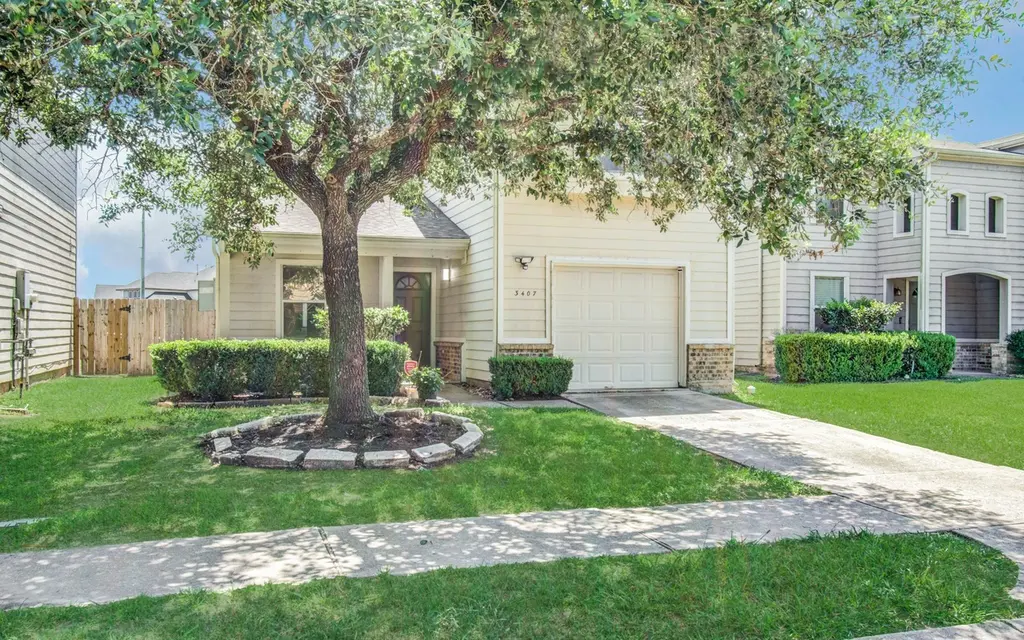
3407 Becker Glen St · Fresno, TX
Flood risk 1/10 · Minimal
- FEMA flood zone
- X (unshaded)
- Chance of flooding over 30 yrs
- 0.0%
- Est. flood insurance / yr
- $507 – $1,088
Fire risk 4/10 · Minor
- Est. fire insurance / yr
- $1,222 – $2,270
Heat risk 9/10 · Severe
- Hot days now (above 110°F)
- 7 days/yr
- Hot days in 30 yrs
- 23 days/yr
Wind risk 9/10 · Severe
- Chance of severe wind over 30 yrs
- 99.0%
Air-quality risk 2/10 · Minimal
- Unhealthy air days now
- 2 days/yr
- Unhealthy air days in 30 yrs
- 2 days/yr
Risk factors via First Street. Map © Google.
Why this score? — see what drove the C grade
The composite is a weighted blend of 9 inputs, each scored 0–100. Each bar is that input's sub-score; the figure is the points it added to the 100-point composite (weight × sub-score).
- Cash flow +18.4/30.0
- ARV discount +11.9/15.0
- 1% rule +5.8/10.0
- DSCR +5.8/10.0
- Schools +4.5/10.0
- Appreciation +4.0/10.0
- Livability +3.1/5.0
- Condition / age +2.5/5.0
- Rent growth +2.3/5.0
$229,999
🖨 Deal sheet 📄 Offer letter ✓ Due diligence
Listing remarks MLS
Cute home in Winfield Lakes. 2 story, 3 bedroom, 2.5 bath, 1 car garage. Very light and bright, open floor plan. Large living room off kitchen and breakfast room. Formal dining and 1/2 bath down. All bedrooms are up, with 2 full baths, plus a gameroom. Good size back yard. Must see!
Key facts
- Huge gameroom
- Swimming pool
- Walking trails
Tags
Property features AI
Finance
- Other: Association-maintained pool; Municipal Utility District disclosure and seller disclosure available
- HOA & community: Homeowners association managed by Triquest Management; Annual association fee of $575 covering common areas and recreation facilities; Community amenities: pool, playground, picnic area, trails
Exterior
- Parking: Attached garage (1 car); Attached garage parking
- Utilities: Public water; Public sewer
- Home design: Residential property; Built in 2004; Slab foundation
- Construction: Vinyl and wood siding; Composition roof
- Exterior features: Subdivision lot with a pond on the lot; Asphalt and concrete road surfaces; Association pool
Interior
- Kitchen: Kitchen on first floor (approx. 12 x 12)
- Bedrooms: Primary bedroom on second floor (approx. 15 x 14); Two additional bedrooms on second floor (approx. 11 x 12 and 12 x 11)
- Bathrooms: Two full bathrooms; One half bathroom
- Heating & cooling: Central heating (gas); Central electric air conditioning
- Interior features: Breakfast bar; Pantry; Total of 8 rooms
Neighborhood map
What this means for you Summary
Snapshot
- This is a 3-bed/3.0-bath single-family listed at $230k.
Deal economics
- At list price, monthly cash flow is $214 ($3k/yr) — positive.
- The deal already cash-flows at list — no discount required.
- Meets the 1% rule at list price ($2k rent vs $230k).
- Cap rate 7.4% vs local median 5.4% in Fresno — top-decile yield for the area; either an underpriced asset or a hidden risk that comps aren't pricing in. Stress-test before assuming the spread holds.
Location & tenants
- Location reads 62/100 on livability (#943 in TX) — a middle-class / working-renter tenant base. Strengths: employment A+, housing A+, cost of living A; Watch: crime C-, amenities F, commute F.
- Fort Bend ISD (suburban): math 44% / reading 53% proficiency, ranked #140 of 826 in TX (top 17%) — families likely to look elsewhere, expect single-tenant / working-renter base with shorter leases.
- Zoned schools: Lake Olympia Middle (math 18% / reading 31%, grade F, #1,279 of 1,662 statewide, top 78%, 1,170 students, 71% FRL); Hightower H S (math 23% / reading 45%, grade F, #1,002 of 1,632 statewide, top 62%, 2,535 students, 67% FRL) — zoned schools average 69% FRL vs 35% district-wide (34 pts higher); higher-poverty schools than district average — tighter screening recommended.
- Zoned-school proficiency averages 29% at this address vs 48% district-wide (-19 pts) — the specific schools serving this property underperform the Fort Bend ISD average; the district grade overstates school quality for this exact location.
- Market conditions: Rents soft (-0.9%/yr); 175 active listings in the ZIP; 10 comparable units currently listed for rent nearby; rentals at typical pace (median 20d on market — plan ~3-4 weeks tenant-placement turnaround); 40% of comp listings sitting > 30 days — soft ceiling on asking rent; solid renter incomes; 12,093 units permitted in Fort Bend County in 2024 (815 in 5+ unit buildings).
- This rent runs 31% of the median local income ($94k/yr) — at the standard rent-burdened threshold; future hikes will face affordability resistance.
Forward outlook
- Local home prices are declining (-2.0%/yr); year-one equity from $2k of loan paydown is wiped out by about $5k of value loss. Plan a longer hold.
- Fort Bend County population projected at +75% by 2050 — long-run rental-demand tailwind backs the buy-and-hold thesis.
Negotiation context
- Only 8 days on market — expect competitive offers; lowballing is unlikely to land.
- 8 sale attempts since 16y ago with the ask held roughly flat each time — persistent listings suggest the price (not the market) is what's stuck; bring a comps-based counter.
Risks & watch-outs
- Climate carrying-cost: severe wind risk, 99% chance of damaging wind over 30y; extreme-heat days projected 7→23/yr by 2055 (HVAC capex compounding) — expect insurance premiums to compound above CPI over the hold.
Questions for the listing agent
- What does the HOA fee cover, when was the last increase, and are there any pending special assessments or reserve-fund shortfalls?
- Is there a deadline driving the sale (1031 exchange, divorce, estate, relocation)? That informs how much negotiation room exists.
- Schools are D-rated, which usually means shorter tenancies and higher turnover. Who's the typical renter profile here, and what's been the actual vacancy rate?
- What's the average days-on-market for RENTAL listings here right now (not sales)? A rising rental-DOM trend means longer vacancies and softer asking-rent achievability than the comps imply.
- What's the recent tenant-quality profile in this submarket — average credit score on applications, eviction rate, late-payment / NSF rate, and stable-employment percentage? A property-management company in the area should have these aggregated.
- How much new for-sale + rental construction is in the pipeline within 1–3 miles? Heavy new supply typically softens prices + rents 12–24 months out; constrained supply supports both.
Investment metrics
- 1% rule
- 1.08% ✓
- Cap rate
- 7.41%
- Cash-on-cash
- 3.99%
- DSCR
- 1.18
- GRM
- 7.7
CMA / ARV
- ARV (on-the-fly)
- $255,188
- Comps found
- 12
Show comp detail 12 sales within ~0.75 mi
| Address | Dist | Beds/Ba | Sqft | Sold | Price | $/sf | Match |
|---|---|---|---|---|---|---|---|
| 3407 Becker Glen St | 0.00mi | 3/2.5 | 1,948 (0%) | 0mo | $229,999 | $118 | 98 |
| 2215 Beacon Light Ln | 0.21mi | 4/2.0 (+1) | 1,820 (-7%) | 0mo | $249,000 | $137 | 70 |
| 3119 Becker Glen St | 0.19mi | 3/2.5 | 1,702 (-13%) | 2mo | $177,000 | $104 | 67 |
| 3114 Becker Glen St | 0.18mi | 3/2.5 | 1,680 (-14%) | 2mo | $219,900 | $131 | 66 |
| 4026 Ashview Ln | 0.50mi | 3/2.0 | 1,859 (-5%) | 0mo | $239,900 | $129 | 65 |
| 2923 Vales Point Dr | 0.38mi | 4/2.0 (+1) | 2,079 (+7%) | 1mo | $306,900 | $148 | 61 |
| 3019 Edgewick Elm St | 0.31mi | 2/2.5 (-1) | 1,767 (-9%) | 4mo | $215,000 | $122 | 60 |
| 2022 Wellfleet Xing | 0.44mi | 4/2.0 (+1) | 2,098 (+8%) | 0mo | $290,000 | $138 | 57 |
| 2811 Darby Brook Dr | 0.49mi | 4/2.0 (+1) | 2,140 (+10%) | 4mo | $275,000 | $129 | 49 |
| 2719 Bergen Bay Ln | 0.50mi | 3/2.0 | 1,704 (-12%) | 4mo | $255,999 | $150 | 49 |
| 2406 Grove View Trl | 0.61mi | 4/2.0 (+1) | 2,165 (+11%) | 2mo | $297,500 | $137 | 42 |
| 1927 Vermillion View St | 0.71mi | 4/2.5 (+1) | 2,215 (+14%) | 1mo | $277,500 | $125 | 36 |
Match score weights: distance 35% · size 25% · config 20% · recency 20%. Top-matched comps best support the ARV.
Projected returns pro-forma
-1.98% appreciation · 0.0% rent growth · sell at horizon
- IRR
- -8.3%
- Equity multiple
- 0.68×
- Total profit
- $-20,797
- Equity at exit
- $44,874
- IRR
- -4.3%
- Equity multiple
- 0.70×
- Total profit
- $-19,160
- Equity at exit
- $38,545
Cash invested: $64,400 (down + closing). Projections, not guarantees.
Landlord ↔ Tenant lean methodology
- Overall (STATE)
- 87 Strongly Landlord-Friendly
- State Texas
- 87 Strongly Landlord-Friendly · R+5
- County
- — inherits STATE
- City
- — inherits STATE
ZIP-level market 77545
- Home prices YoY
- -0.8%
- Rents YoY
- -0.9%
- Active inventory
- 175
- Price-to-rent
- 7.7×
Monthly cashflow live
- Estimated rent
- $2,476 high interval (Pro) →
- Mortgage (P&I)
- −$1,206
- Tax from tax record
- −$391 /mo · $4,697/yr
- Insurance
- −$96
- HOA
- −$48
- Vacancy / Maint / Mgmt
- −$520
- Net cashflow
- $214
Break-even live
UW: 25.0% down · 7.5% · 30yr · 1.5% tax · 5.0% vac · 8.0% maint · 8.0% mgmt
Financing live
Cash to close
- Down payment
- $57,500
- Closing costs
- $6,900
- Reserves months
- —
- Total cash needed
- —
Loan-product check · same deal, 3 products live
Conventional
25% down · 7.5% · 30yr
- Down + closing
- —
- Monthly P&I
- —
- Monthly cashflow
- —
- DSCR
- —
- Eligible?
- —
Personal DTI + credit; lowest rate.
DSCR
20% down · 8.5% · 30yr
- Down + closing
- —
- Monthly P&I
- —
- Monthly cashflow
- —
- DSCR
- —
- Eligible?
- —
No personal income docs; deal must DSCR.
Hard money
10% down · 12.0% · 12mo
- Down + closing
- —
- Monthly P&I
- —
- Monthly cashflow
- —
- DSCR
- —
- Eligible?
- —
Short-term bridge; refi at stabilization.
Rent comps 10 comps
| Address | Beds | Baths | Sqft | Rent | $/sqft | DOM | Units | Dist |
|---|---|---|---|---|---|---|---|---|
| 3623 Elmwood Dale Dr Fresno, TX | 3.0 | 2.0 | 1545 | $1,765 | $1.14 | 43d | 1 | 0.25mi |
| 2403 Orchard Run Fresno, TX | 3.0 | 2.0 | 1459 | $2,800 | $1.92 | 3d | 1 | 0.46mi |
| 3932 Teal Run Place Ct Fresno, TX | 4.0 | 2.0 | 1914 | $2,150 | $1.12 | 43d | 1 | 0.72mi |
| 3806 Teal Maple Ct Fresno, TX | 4.0 | 3.5 | 2318 | $2,146 | $0.93 | 2d | 1 | 0.83mi |
| 11727 Highway 6 Fresno, TX | 1.0–3.0 | 1.0–2.0 | 962 | $2,929 | $3.04 | 5d | 15 | 1.07mi |
| 2703 Facet Creek Dr Fresno, TX | 4.0 | 2.0 | 2099 | $2,306 | $1.10 | 5d | 1 | 1.09mi |
| 3314 Dry Creek Dr Missouri City, TX | 4.0 | 3.0 | 2600 | $4,200 | $1.62 | 43d | 1 | 1.13mi |
| 2644 Blue Abbot Dr Fresno, TX | 4.0 | 2.5 | 2435 | $2,450 | $1.01 | 43d | 1 | 1.28mi |
| 3106 Presley Jane Ct Missouri City, TX | 3.0 | 2.0 | 2109 | $2,271 | $1.08 | 5d | 1 | 1.31mi |
| 3218 Clayton Terrace Dr Missouri City, TX | 4.0 | 3.0 | 2278 | $2,395 | $1.05 | 19d | 1 | 1.40mi |
HOA detail
- Monthly dues
- $48 · $576/yr
Listing history 27 events
-
2026-05-24status Pending
-
2026-05-24historical Active Under Contract
-
2026-05-23status Active
-
2026-05-20status Pending
-
2026-05-16$229,999 Active
-
2023-04-05soldstatus Sold 283-char remark
Show marketing remark (283 chars)
Cute home in Winfield Lakes. 2 story, 3 bedroom, 2.5 bath, 1 car garage. Very light and bright, open floor plan. Large living room off kitchen and breakfast room. Formal dining and 1/2 bath down. All bedrooms are up, with 2 full baths, plus a gameroom. Good size back yard. Must see!
-
2023-04-05soldstatus
Show marketing remark (283 chars)
Cute home in Winfield Lakes. 2 story, 3 bedroom, 2.5 bath, 1 car garage. Very light and bright, open floor plan. Large living room off kitchen and breakfast room. Formal dining and 1/2 bath down. All bedrooms are up, with 2 full baths, plus a gameroom. Good size back yard. Must see!
-
2023-03-11status Pending 283-char remark
Show marketing remark (283 chars)
Cute home in Winfield Lakes. 2 story, 3 bedroom, 2.5 bath, 1 car garage. Very light and bright, open floor plan. Large living room off kitchen and breakfast room. Formal dining and 1/2 bath down. All bedrooms are up, with 2 full baths, plus a gameroom. Good size back yard. Must see!
-
2023-03-04status Option Pending 283-char remark
Show marketing remark (283 chars)
Cute home in Winfield Lakes. 2 story, 3 bedroom, 2.5 bath, 1 car garage. Very light and bright, open floor plan. Large living room off kitchen and breakfast room. Formal dining and 1/2 bath down. All bedrooms are up, with 2 full baths, plus a gameroom. Good size back yard. Must see!
-
2023-02-09price $229,900 283-char remark
Show marketing remark (283 chars)
Cute home in Winfield Lakes. 2 story, 3 bedroom, 2.5 bath, 1 car garage. Very light and bright, open floor plan. Large living room off kitchen and breakfast room. Formal dining and 1/2 bath down. All bedrooms are up, with 2 full baths, plus a gameroom. Good size back yard. Must see!
-
2023-01-17$240,000 Active 283-char remark
Show marketing remark (283 chars)
Cute home in Winfield Lakes. 2 story, 3 bedroom, 2.5 bath, 1 car garage. Very light and bright, open floor plan. Large living room off kitchen and breakfast room. Formal dining and 1/2 bath down. All bedrooms are up, with 2 full baths, plus a gameroom. Good size back yard. Must see!
-
2016-02-07historical
-
2016-02-06$135,000
-
2014-02-21historical
-
2014-02-21soldstatus Sold
-
2014-02-21soldstatus
-
2014-01-15status Pending, Continue to Show
-
2014-01-10status Option Pending
-
2013-12-12price $110,000
-
2013-11-04$115,000 Active
-
2011-10-15soldstatus
-
2011-08-17historical
-
2011-08-08$69,900
-
2011-08-07historical
-
2011-02-10$69,900
-
2010-12-28historical
-
2010-09-24$99,500
ⓘ Source: listings_history table (triggers on properties + properties_extension) + one-shot
backfill from property_details.listing_events for pre-trigger history.
Tax reassessment forecast TX · Resets to sale price
- Current annual tax
- $4,697 · $391/mo
- Projected year-2 tax
- $4,697 · $391/mo
- Expected delta
- $0/yr ($0/mo · 0.0%)
ⓘ Screening estimate from a state-policy table — verify with the county assessor before closing.
Climate risk First Street
- Flood 1/10 Low FEMA zone X (unshaded) · 0% chance over 30 yrs
- Wildfire 4/10 Moderate
- Heat 9/10 Extreme 7 d/yr ≥110°F today · 23 d/yr by 30 yrs out
- Wind 9/10 Extreme 99% chance of damaging wind over 30 yrs
- Air quality 2/10 Low 2 unhealthy d/yr today · 2 by 30 yrs out
Nearby sold comps map
Loading sold comps map…
Walkable amenities ~0.75 mi
Loading nearby amenities…
Taxation est. · year 1
- Rental income
- $29,707
- − Mortgage interest
- −$12,884
- − Property taxes
- −$4,697
- − Insurance
- −$1,150
- − Repairs & maintenance
- −$2,377
- − Management
- −$2,377
- − HOA
- −$576
- − Depreciation
- −$6,691
- Taxable loss
- −$1,043
- Est. tax savings @ 24.0%
- +$250
- After-tax cash flow
- $2,822/yr
For passive investors: Depreciation is non-cash, so a rental often shows a tax loss while cash-flowing — sheltering income. Rental losses are passive: they offset passive income freely, and up to $25,000/yr can offset ordinary (W-2) income if you actively participate and your MAGI is under $100k (phasing out to $0 by $150k); unused losses carry forward. On sale, claimed depreciation is recaptured at up to 25%, and gains may owe capital-gains tax (a 1031 exchange can defer both). Figures are a year-1 estimate at your 24.0% rate — not tax advice; consult a CPA.
Schools (NCES district)
- District
- Fort Bend ISD
- NCES district ID
- 4819650
- Math proficiency
- 44% ▼ -15.00%
- Reading proficiency
- 53% ▼ -4.00%
- Median HH income
- $82,360
- Composite
- 44.61/100
- National rank
- #2779
- State rank
- #140 of 826 in TX
Livability — Fresno
- Score
- 62/100
- State rank
- #943
- US rank
- #16815
Category grades
Schools grade is shown separately in the Schools card above.
Census & demographics
- Census place
- Fresno, TX
- County
- Fort Bend County · 836,777 people
- City population
- 26,236
- Metro
- Houston-The Woodlands-Sugar Land, TX
- Population (ZIP)
- 26,236
- Household income
- $94,474
- Rent vs Own
- Severe rent burden
- 360.0
Population outlook (Fort Bend County) Hauer SSP2
- Today (2025)
- 1,004,526 people
- By 2030
- 1,153,104 · +14.8%
- By 2040
- 1,453,718 · +44.7%
- By 2050
- 1,753,781 · +74.6%
- By 2075
- 2,455,772 · +144.5%
- By 2100
- 2,930,528 · +191.7%
Race, ethnicity, and origin ACS 2023
- Neighborhood character
- Diverse neighborhood (Simpson 0.61)
- Race & ethnicity
- Black 51% Hispanic / Latino 34% Two or more races 12% White 8% Asian 2%
- Hispanic origin (detail)
- Mexican 29%
- Common ancestry
- Portuguese 1%
- Foreign-born
- 18% · Canada
- Languages at home
- 67% English-only · Spanish 29% Other Asian/Pacific 1% Other Indo-European 1%
Political lean MEDSL · Fort Bend
- 2024 margin
- Toss-up / Even · D 49.5% · R 47.9% · Other 2.6%
- 2008→2024 swing
- +4.0pp toward D · 2008: -2.4pp · 2024: 1.6pp
- All cycles
- 2024: D+1.6 2020: D+10.6 2016: D+6.6 2012: R+6.8 2008: R+2.4
Not yet ingested
- Civics
- —
Market trends
- HPI YoY
- ▼ -1.98%
- Current HPI
- 231.3921
- Rent YoY
- ▼ -0.95%
- Metro
- Houston-The Woodlands-Sugar Land, TX
- State GDP YoY
- ▲ 3.95%
- F500 in state
- 110
Industry mix (Fortune 500 HQ in TX)
| Industry | F500 HQs | Revenue |
|---|---|---|
| Energy | 16 | $1,198B |
|
||
| Technology | 5 | $198B |
|
||
| Engineering / Construction | 4 | $72B |
|
||
| Energy Services | 3 | $60B |
|
||
| Utilities | 3 | $41B |
|
||
| Healthcare | 2 | $330B |
|
||
Price history
+131.2% since first listed27 events — show timeline
- 2026-05-24 Pending — HARMLS
- 2026-05-24 Contingent — HARMLS
- 2026-05-23 Relisted — HARMLS
- 2026-05-20 Pending — HARMLS
- 2026-05-16 Listed $229,999 HARMLS
- 2023-04-05 Sold (Public Records) — Public Records
- 2023-04-05 Sold (MLS) — HARMLS
- 2023-03-11 Pending — HARMLS
- 2023-03-04 Pending — HARMLS
- 2023-02-09 Price Changed $229,900 HARMLS
- 2023-01-17 Listed $240,000 HARMLS
- 2016-02-07 Listing Removed — HARMLS
- 2016-02-06 Listed $135,000 HARMLS
- 2014-02-21 Listing Removed — HARMLS
- 2014-02-21 Sold (Public Records) — Public Records
- 2014-02-21 Sold (MLS) — HARMLS
- 2014-01-15 Pending — HARMLS
- 2014-01-10 Pending — HARMLS
- 2013-12-12 Price Changed $110,000 HARMLS
- 2013-11-04 Listed $115,000 HARMLS
- 2011-10-15 Sold (MLS) — HARMLS
- 2011-08-17 Listing Removed — HARMLS
- 2011-08-08 Listed $69,900 HARMLS
- 2011-08-07 Listing Removed — HARMLS
- 2011-02-10 Listed $69,900 HARMLS
- 2010-12-28 Listing Removed — HARMLS
- 2010-09-24 Listed $99,500 HARMLS
Property tax history
+2.4%/yrLatest (2025): $4,697 · +13.6% YoY. Source: county tax records.
Cash-flow waterfall
monthlySold comps — $/sqft
last 12 mo · ≤1 miLoading sold comps…