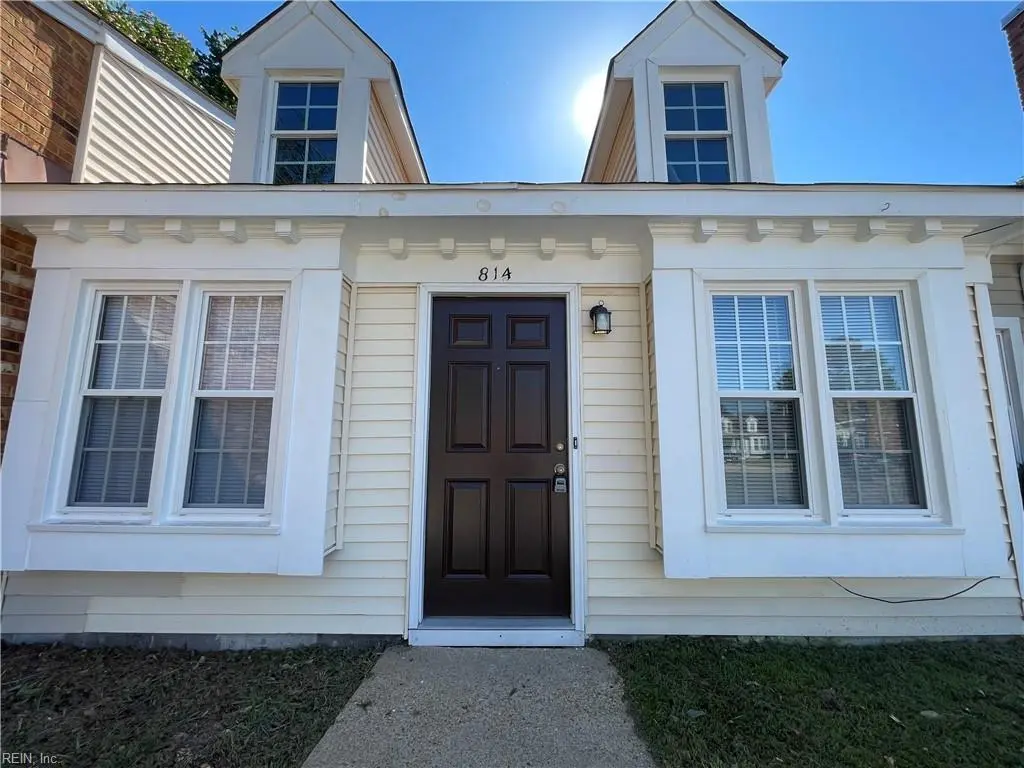
814 Chalk Ct · Virginia Beach, VA
Flood risk 1/10 · Minimal
- FEMA flood zone
- X (unshaded)
- Chance of flooding over 30 yrs
- 0.0%
- Est. flood insurance / yr
- $507 – $1,088
Fire risk 1/10 · Minimal
- Est. fire insurance / yr
- $666 – $1,236
Heat risk 9/10 · Severe
- Hot days now (above 104°F)
- 7 days/yr
- Hot days in 30 yrs
- 16 days/yr
Wind risk 8/10 · Major
- Chance of severe wind over 30 yrs
- 80.0%
Air-quality risk 3/10 · Minor
- Unhealthy air days now
- 2 days/yr
- Unhealthy air days in 30 yrs
- 3 days/yr
Risk factors via First Street. Map © Google.
Why this score? — see what drove the D grade
The composite is a weighted blend of 9 inputs, each scored 0–100. Each bar is that input's sub-score; the figure is the points it added to the 100-point composite (weight × sub-score).
- Cash flow +11.3/30.0
- ARV discount +7.4/15.0
- Schools +6.4/10.0
- Livability +4.2/5.0
- Rent growth +3.9/5.0
- DSCR +3.3/10.0
- 1% rule +2.7/10.0
- Condition / age +2.5/5.0
- Appreciation +0.0/10.0
$224,900
🖨 Deal sheet (PDF) 📄 Offer letter ✓ Due diligence
Listing remarks
Beautiful 2 bedroom, 2 bath home on a cul-de-sac in Campus East convenient to shopping, restaurants, and interstate. Enjoy the amenities of Campus East Community Association including pool and playground. Open living area with wood-burning fireplace. Relaxing low maintenance back patio area. Windows new in 2021, HVAC new in 2023 and new hot water heater just installed in 2026. Bathroom vanities and kitchen countertops installed in 2023. All new carpets. This property is move-in-ready - come by today!!
Key facts
- Pool
- Cul-de-sac
- Playground
Tags
Property features AI
Finance
- HOA & community: Has HOA (Campus East Community Association); HOA/P.O.A. amenities: clubhouse, playgrounds, pool, tennis courts; Association fee: $34 monthly
Exterior
- Parking: Driveway space; Street parking; 2 total parking spaces
- Utilities: City/County water; City/County sewer; Electric water heater; Electric service
- Home design: Attached townhouse; Single-story (1 living level)
- Construction: Brick and vinyl siding; Asphalt shingle roof; Slab foundation
- Exterior features: Located on a cul-de-sac; Wood fence
Interior
- Kitchen: Electric range; Dishwasher; Garbage disposal; Refrigerator
- Bedrooms: Master bedroom with ensuite; Bedroom and full bathroom on first floor; Total rooms: 5 (includes utility closet)
- Flooring: Carpet; Vinyl
- Bathrooms: 2 full bathrooms
- Heating & cooling: Heat pump heating; Central air conditioning
- Interior features: Wood-burning fireplace; Jetted tub; Scuttle access
- Laundry & utility: Washer hookup; Dryer hookup; Utility closet
Neighborhood map
What this means for you Summary
Snapshot
- This is a 2-bed/1.0-bath townhouse listed at $225k.
Deal economics
- At list price, monthly cash flow is $-83 ($-996/yr) — negative.
- To cash-flow at today's rent, offer at most $210k (6.5% below list).
- To meet the 1% rule (rent ≥ 1% of price), the offer needs to be $174k (22.7% below list).
- Recommended offer: $174k (22.7% below list) — sets the bar for 1% rule.
- Cap rate 5.8% vs local median 3.5% in Virginia Beach — top-decile yield for the area; either an underpriced asset or a hidden risk that comps aren't pricing in. Stress-test before assuming the spread holds.
Location & tenants
- Location reads 83/100 on livability (#38 in VA, #880 nationally) — a professional / high-income tenant draw. Strengths: amenities A+, employment A+, housing A+; Watch: cost of living C-, commute F.
- Va Beach City Public School District (urban): math 69% / reading 78% proficiency, ranked #10 of 131 in VA (top 8%) — strong family-tenant draw, lease renewals of 3-5y typical.
- Zoned schools: Diamond Springs Elementary (484 students, 100% FRL); Bayside Middle (math 53% / reading 54%, grade C+, #209 of 342 statewide, top 62%, 700 students, 92% FRL); Bayside High (math 63% / reading 75%, grade B, #170 of 319 statewide, top 55%, 1,983 students, 65% FRL) — zoned schools average 86% FRL vs 28% district-wide (58 pts higher); higher-poverty schools than district average — tighter screening recommended.
- Zoned-school proficiency averages 61% at this address vs 74% district-wide (-12 pts) — the specific schools serving this property underperform the Va Beach City Public School District average; the district grade overstates school quality for this exact location.
- Market conditions: Rents rising fast (+5.6%/yr); 229 active listings in the ZIP; 18 comparable units currently listed for rent nearby; rentals at typical pace (median 19d on market — plan ~3-4 weeks tenant-placement turnaround); 666 units permitted in Virginia Beach city in 2024 (347 in 5+ unit buildings).
- This rent runs 30% of the median local income ($69k/yr) — at the standard rent-burdened threshold; future hikes will face affordability resistance.
Forward outlook
- Local home prices are declining (-3.0%/yr); year-one equity from $2k of loan paydown is wiped out by about $7k of value loss. Plan a longer hold.
- Virginia Beach County population projected at +6% by 2050 — modest demand growth; plan on rents tracking national, not racing it.
Negotiation context
- Only 12 days on market — expect competitive offers; lowballing is unlikely to land.
- Current owner paid $50k; list at $225k implies a 348% gain — meaningful room to come down on a strong offer.
Risks & watch-outs
- Climate carrying-cost: severe wind risk, 80% chance of damaging wind over 30y; extreme-heat days projected 7→16/yr by 2055 (HVAC capex compounding) — expect insurance premiums to compound above CPI over the hold.
Questions for the listing agent
- What do current leases actually rent for vs. the listed asking? Can we see a recent rent roll and the last 12 months of T-12 income?
- What does the HOA fee cover, when was the last increase, and are there any pending special assessments or reserve-fund shortfalls?
- Is there a deadline driving the sale (1031 exchange, divorce, estate, relocation)? That informs how much negotiation room exists.
- Schools are A-rated — typically a magnet for longer-tenancy family renters. What's the average tenant stay here, and is there a school-zone premium baked into asking?
- The area grade is low — what's the realistic commute time and amenity access for the typical tenant pool here? Any planned neighborhood developments (good or bad) we should know about?
- What's the average days-on-market for RENTAL listings here right now (not sales)? A rising rental-DOM trend means longer vacancies and softer asking-rent achievability than the comps imply.
- What's the recent tenant-quality profile in this submarket — average credit score on applications, eviction rate, late-payment / NSF rate, and stable-employment percentage? A property-management company in the area should have these aggregated.
- How much new for-sale + rental construction is in the pipeline within 1–3 miles? Heavy new supply typically softens prices + rents 12–24 months out; constrained supply supports both.
Investment metrics
- 1% rule
- 0.77% ✗
- Cap rate
- 5.85%
- Cash-on-cash
- -1.58%
- DSCR
- 0.93
- GRM
- 10.8
CMA / ARV
- ARV (on-the-fly)
- $224,640
- Comps found
- 11
Show comp detail 11 sales within ~0.75 mi
| Address | Dist | Beds/Ba | Sqft | Sold | Price | $/sf | Match |
|---|---|---|---|---|---|---|---|
| 805 Chalk Ct | 0.04mi | 2/1.0 | 960 (0%) | 4mo | $220,000 | $229 | 95 |
| 807 Tenure Ln | 0.08mi | 2/1.0 | 960 (0%) | 2mo | $213,000 | $222 | 94 |
| 5418 Campus Dr | 0.05mi | 2/2.0 | 960 (0%) | 4mo | $225,000 | $234 | 91 |
| 5589 Baccalaureate Dr | 0.06mi | 2/2.0 | 960 (0%) | 7mo | $215,000 | $224 | 87 |
| 816 Stephanie Ct | 0.15mi | 2/2.0 | 1,034 (+8%) | 3mo | $265,000 | $256 | 74 |
| 808 Dora Ct | 0.11mi | 2/2.0 | 836 (-13%) | 12mo | $209,288 | $250 | 60 |
| 701 Glenshire Dr | 0.69mi | 2/1.0 | 940 (-2%) | 11mo | $230,000 | $245 | 56 |
| 727 Glenshire Dr | 0.67mi | 2/1.5 | 940 (-2%) | 14mo | $240,000 | $255 | 52 |
| 5549 Lynbrook Lndg | 0.58mi | 2/1.0 | 820 (-15%) | 7mo | $215,000 | $262 | 43 |
| 5608 Summit Arch | 0.73mi | 2/1.0 | 816 (-15%) | 10mo | $144,000 | $176 | 33 |
| 5612 Summit Arch | 0.73mi | 2/1.0 | 816 (-15%) | 12mo | $151,000 | $185 | 30 |
Match score weights: distance 35% · size 25% · config 20% · recency 20%. Top-matched comps best support the ARV.
Projected returns pro-forma
-3.0% appreciation · 5.61% rent growth · sell at horizon
- IRR
- -16.2%
- Equity multiple
- 0.41×
- Total profit
- $-37,080
- Equity at exit
- $33,533
- IRR
- -4.1%
- Equity multiple
- 0.70×
- Total profit
- $-18,949
- Equity at exit
- $19,445
Cash invested: $62,972 (down + closing). Projections, not guarantees.
Landlord ↔ Tenant lean methodology
- Overall (STATE)
- 55 Moderately Landlord-Leaning
- State Virginia
- 55 Moderately Landlord-Leaning · D+2
- County
- — inherits STATE
- City
- — inherits STATE
ZIP-level market 23462
- Rents YoY
- 5.6%
- Active inventory
- 229
- Price-to-rent
- 10.8×
Monthly cashflow live
- Estimated rent
- $1,739 high interval (Pro) →
- Mortgage (P&I)
- −$1,179
- Tax from tax record
- −$150 /mo · $1,797/yr
- Insurance
- −$94
- HOA
- −$34
- Vacancy / Maint / Mgmt
- −$365
- Net cashflow
- $-83
Break-even live
Sensitivity live
| Price | -10% $44 | -5% $-19 | +0% $-83 | +5% $-147 | +10% $-210 |
|---|---|---|---|---|---|
| Rent | -10% $-220 | -5% $-152 | +0% $-83 | +5% $-14 | +10% $54 |
| Rate | -1.0pp $30 | -0.5pp $-26 | base $-83 | +0.5pp $-141 | +1.0pp $-201 |
UW: 25.0% down · 7.5% · 30yr · 1.5% tax · 5.0% vac · 8.0% maint · 8.0% mgmt
Financing live
Cash to close
- Down payment
- $56,225
- Closing costs
- $6,747
- Reserves months
- —
- Total cash needed
- —
Loan-product check · same deal, 3 products live
Conventional
25% down · 7.5% · 30yr
- Down + closing
- —
- Monthly P&I
- —
- Monthly cashflow
- —
- DSCR
- —
- Eligible?
- —
Personal DTI + credit; lowest rate.
DSCR
20% down · 8.5% · 30yr
- Down + closing
- —
- Monthly P&I
- —
- Monthly cashflow
- —
- DSCR
- —
- Eligible?
- —
No personal income docs; deal must DSCR.
Hard money
10% down · 12.0% · 12mo
- Down + closing
- —
- Monthly P&I
- —
- Monthly cashflow
- —
- DSCR
- —
- Eligible?
- —
Short-term bridge; refi at stabilization.
Rent comps 18 comps
| Address | Beds | Baths | Sqft | Rent | $/sqft | DOM | Units | Dist |
|---|---|---|---|---|---|---|---|---|
| 5433 Campus Dr Virginia Beach, VA | 2.0 | 2.0 | 1000 | $1,700 | $1.70 | 4d | 1 | 0.03mi |
| 5781 Lake Edward Dr Virginia Beach, VA | 2.0 | 1.0–1.5 | 1075 | $1,478 | $1.37 | 4d | 15 | 0.49mi |
| 5547 Lynbrook Lndg Virginia Beach, VA | 3.0 | 1.0 | 820 | $1,350 | $1.65 | 19d | 1 | 0.58mi |
| 5312 Justin Ct Unit 800-21-102E Virginia Beach, VA | 2.0 | 1.0 | 800 | $1,599 | $2.00 | 25d | 1 | 0.58mi |
| 5312 Justin Ct Unit 808-11-202E Virginia Beach, VA | 1.0 | 1.0 | 550 | $1,399 | $2.54 | 25d | 1 | 0.58mi |
| 5301 Justin Ct Virginia Beach, VA | 1.0–2.0 | 1.0 | 695 | $1,599 | $2.30 | 25d | 12 | 0.62mi |
| 5414 Catina Arch Virginia Beach, VA | 1.0–4.0 | 1.0–1.5 | 866 | $1,717 | $1.98 | 4d | 10 | 0.66mi |
| 5619 Summit Arch Virginia Beach, VA | 2.0 | 2.0 | 957 | $1,650 | $1.72 | 5d | 1 | 0.81mi |
| 607 Crows Nest Ct Virginia Beach, VA | 2.0 | 1.0 | 700 | $1,700 | $2.43 | 25d | 1 | 0.86mi |
| 608 Spirit Ct Virginia Beach, VA | 2.0 | 1.0 | 866 | $1,875 | $2.17 | 9d | 1 | 0.92mi |
| 502 Wharf Ct Virginia Beach, VA | 2.0 | 1.0 | 866 | $1,495 | $1.73 | 12d | 1 | 0.93mi |
| 5516 Seawall Ct Virginia Beach, VA | 2.0–3.0 | 1.0–3.0 | 1125 | $1,536 | $1.36 | 3d | 18 | 0.98mi |
| 1060 Kempsville Rd Norfolk, VA | 2.0 | 2.0 | 1070 | $2,400 | $2.24 | 46d | 1 | 1.31mi |
| 1060 Kempsville Rd Norfolk, VA | 1.0 | 1.0 | 914 | $2,250 | $2.46 | 18d | 1 | 1.31mi |
| 1060 Kempsville Rd Norfolk, VA | 1.0 | 1.0 | 723 | $1,775 | $2.46 | 22d | 1 | 1.31mi |
| 1060 Kempsville Rd Unit 00 09212 Norfolk, VA | 2.0 | 2.0 | 1002 | $2,370 | $2.37 | 45d | 1 | 1.36mi |
| 1060 Kempsville Rd Apt 10305 Norfolk, VA | 2.0 | 2.0 | 975 | $2,142 | $2.20 | 9d | 1 | 1.36mi |
| 453 Peregrine St Virginia Beach, VA | 2.0 | 1.0 | 994 | $1,500 | $1.51 | 25d | 1 | 1.45mi |
HOA detail
- Monthly dues
- $34 · $408/yr
- Likely covers
- waterpool
Listing history 10 events
-
2026-06-17status $224,900 Under Contract 12 DOM
-
2026-06-17days on market $224,900 Active Under Contract 12 DOM
-
2026-06-16days on market $224,900 Active Under Contract 11 DOM
-
2026-06-15days on market $224,900 Active Under Contract 10 DOM
-
2026-06-13days on market $224,900 Active Under Contract 8 DOM
-
2026-06-10status $224,900 Active Under Contract 4 DOM
-
2026-06-09days on market $224,900 Active 4 DOM
-
2026-06-08days on market $224,900 Active 3 DOM
-
2026-06-07remarks 506-char remark
-
2026-06-07$224,900 Active 2 DOM
ⓘ Source: listings_history table (triggers on properties + properties_extension) + one-shot
backfill from property_details.listing_events for pre-trigger history.
Tax reassessment forecast VA · Resets to sale price
- Current annual tax
- $1,797 · $150/mo
- Projected year-2 tax
- $1,844 · $154/mo
- Expected delta
- +$47/yr (+$4/mo · 2.6%)
ⓘ Screening estimate from a state-policy table — verify with the county assessor before closing.
Climate risk First Street
- Flood 1/10 Low FEMA zone X (unshaded) · 0% chance over 30 yrs
- Wildfire 1/10 Low
- Heat 9/10 Extreme 7 d/yr ≥104°F today · 16 d/yr by 30 yrs out
- Wind 8/10 Severe 80% chance of damaging wind over 30 yrs
- Air quality 3/10 Moderate 2 unhealthy d/yr today · 3 by 30 yrs out
Nearby sold comps map
Loading sold comps map…
Walkable amenities ~0.75 mi
Loading nearby amenities…
Taxation est. · year 1
- Rental income
- $20,869
- − Mortgage interest
- −$12,598
- − Property taxes
- −$1,797
- − Insurance
- −$1,124
- − Repairs & maintenance
- −$1,669
- − Management
- −$1,669
- − HOA
- −$408
- − Depreciation
- −$6,543
- Taxable loss
- −$4,941
- Est. tax savings @ 24.0%
- +$1,186
- After-tax cash flow
- $189/yr
For passive investors: Depreciation is non-cash, so a rental often shows a tax loss while cash-flowing — sheltering income. Rental losses are passive: they offset passive income freely, and up to $25,000/yr can offset ordinary (W-2) income if you actively participate and your MAGI is under $100k (phasing out to $0 by $150k); unused losses carry forward. On sale, claimed depreciation is recaptured at up to 25%, and gains may owe capital-gains tax (a 1031 exchange can defer both). Figures are a year-1 estimate at your 24.0% rate — not tax advice; consult a CPA.
Schools (NCES district)
- District
- Va Beach City Public School District
- NCES district ID
- 5103840
- Math proficiency
- 69% ▼ -19.00%
- Reading proficiency
- 78% ▼ -7.00%
- Median HH income
- $66,452
- Composite
- 63.81/100
- National rank
- #594
- State rank
- #10 of 131 in VA
Livability — Virginia Beach
- Score
- 83/100
- State rank
- #38
- US rank
- #880
Category grades
Schools grade is shown separately in the Schools card above.
Census & demographics
- Census place
- Virginia Beach, VA
- County
- Virginia Beach City · 448,227 people
- City population
- 448,227
- Metro
- Virginia Beach-Norfolk-Newport News, VA-NC
- Population (ZIP)
- 66,151
- Household income
- $69,040
- Rent vs Own
- Severe rent burden
- 3906.0
Population outlook (Virginia Beach County) Hauer SSP2
- Today (2025)
- 480,401 people
- By 2030
- 491,221 · +2.3%
- By 2040
- 504,882 · +5.1%
- By 2050
- 508,847 · +5.9%
- By 2075
- 504,831 · +5.1%
- By 2100
- 465,867 · -3.0%
Race, ethnicity, and origin ACS 2023
- Neighborhood character
- Diverse neighborhood (Simpson 0.68)
- Race & ethnicity
- White 45% Black 32% Hispanic / Latino 12% Two or more races 10% Asian 5%
- Hispanic origin (detail)
- Mexican 4% Puerto Rican 3%
- Common ancestry
- Romanian 2% Italian 1% Slovak 1%
- Foreign-born
- 9% · Canada, China, Vietnam
- Languages at home
- 87% English-only · Spanish 6% Tagalog/Filipino 2% Other Asian/Pacific 1%
Political lean MEDSL · Virginia Beach
- 2024 margin
- Toss-up / Even · D 50.7% · R 48.0% · Other 1.3%
- 2008→2024 swing
- +3.4pp toward D · 2008: -0.7pp · 2024: 2.6pp
- All cycles
- 2024: D+2.6 2020: D+5.4 2016: R+4.5 2012: R+2.5 2008: R+0.7
Not yet ingested
- Civics
- —
Market trends
- HPI YoY
- ▼ -269.19%
- Current HPI
- 333.1908
- Rent YoY
- ▲ 5.61%
- Metro
- Virginia Beach-Norfolk-Newport News, VA-NC
- State GDP YoY
- ▲ 2.40%
- F500 in state
- 50
Industry mix (Fortune 500 HQ in VA)
| Industry | F500 HQs | Revenue |
|---|---|---|
| Aerospace / Defense | 4 | $236B |
|
||
| Technology / Defense | 3 | $32B |
|
||
| Financial Services | 2 | $176B |
|
||
| Utilities | 2 | $27B |
|
||
| Insurance | 2 | $25B |
|
||
| Technology | 2 | $15B |
|
||
Price history
+348.5% since first listed2 events — show timeline
- 2026-06-05 Listed $224,900 REINMLS
- 1984-08-09 Sold (Public Records) $50,150 Public Records
Property tax history
+5.4%/yrLatest (2025): $1,797 · +8.0% YoY. Source: county tax records.
Cash-flow waterfall
monthlySold comps — $/sqft
last 12 mo · ≤1 miLoading sold comps…