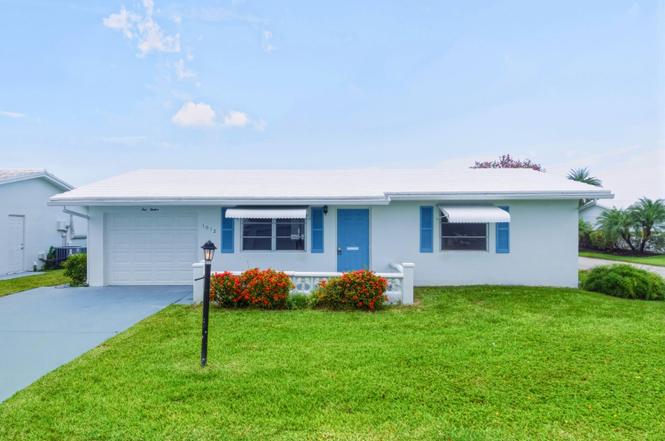
1012 SW 17th St · Boynton Beach, FL
Flood risk 6/10 · Moderate
- FEMA flood zone
- X (unshaded)
- Chance of flooding over 30 yrs
- 0.7%
- Est. flood insurance / yr
- $507 – $1,088
Fire risk 1/10 · Minimal
- Est. fire insurance / yr
- $947 – $1,759
Heat risk 9/10 · Severe
- Hot days now (above 105°F)
- 7 days/yr
- Hot days in 30 yrs
- 23 days/yr
Wind risk 10/10 · Severe
- Chance of severe wind over 30 yrs
- 99.0%
Air-quality risk 2/10 · Minimal
- Unhealthy air days now
- 1 days/yr
- Unhealthy air days in 30 yrs
- 2 days/yr
Risk factors via First Street. Map © Google.
Why this score? — see what drove the D- grade
The composite is a weighted blend of 9 inputs, each scored 0–100. Each bar is that input's sub-score; the figure is the points it added to the 100-point composite (weight × sub-score).
- Cash flow +10.5/30.0
- ARV discount +7.5/15.0
- 1% rule +4.8/10.0
- Schools +4.3/10.0
- Livability +3.6/5.0
- DSCR +3.0/10.0
- Rent growth +2.7/5.0
- Condition / age +2.5/5.0
- Appreciation +0.0/10.0
$234,900
🖨 Deal sheet (PDF) 📄 Offer letter ✓ Due diligence
Key facts
- 7,280 sq ft lot
- Garage
- Community pool
Property features AI
Finance
- Other: Pets allowed with no restrictions
- HOA & community: Community association with amenities including clubhouse, fitness center, pool (heated), billiard and game rooms, bocce and shuffleboard courts, putting green, library, workshop area, recreation and community rooms; Monthly HOA fee of $187 covering grounds and common area maintenance; Senior community
Exterior
- Parking: Attached garage with garage door opener; Driveway; Total parking for 2 vehicles (1 covered in garage)
- Security: Security patrol
- Utilities: Public water; Public sewer; Electricity connected; Sewer connected; Water available
- Home design: Single family residence; One story; Resale
- Construction: Built with concrete/CMU and stucco (CBS); Concrete/flat/tile roof; 1,044 sq ft living area
- Exterior features: Covered patio, Screened patio, Patio; Not waterfront; Faces west
Interior
- Kitchen: Electric range, Gas range, Microwave, Refrigerator
- Bedrooms: One bedroom on the main level
- Flooring: Tile, Vinyl, Wood, Other
- Bathrooms: One full bathroom on the main level
- Heating & cooling: Central heating; Central air conditioning
- Interior features: Electric range, Gas range, Microwave, Refrigerator; Satellite dish; Unfurnished; Shutters
- Laundry & utility: Laundry in garage
Neighborhood map
What this means for you Summary
Snapshot
- This is a 2-bed/1.0-bath single-family listed at $235k.
Deal economics
- At list price, monthly cash flow is $-119 ($-1k/yr) — negative.
- To cash-flow at today's rent, offer at most $214k (9.0% below list).
- To meet the 1% rule (rent ≥ 1% of price), the offer needs to be $230k (2.2% below list).
- Recommended offer: $214k (9.0% below list) — sets the bar for cash-flow.
- Cap rate 5.7% vs local median 4.3% in Boynton Beach — top-decile yield for the area; either an underpriced asset or a hidden risk that comps aren't pricing in. Stress-test before assuming the spread holds.
Location & tenants
- Location reads 72/100 on livability (#351 in FL) — a middle-class / working-renter tenant base. Strengths: housing A+, health & safety B+, cost of living B; Watch: amenities D+, crime D-, commute F.
- Palm Beach (suburban): math 46% / reading 53% proficiency, ranked #34 of 73 in FL (top 47%) — families likely to look elsewhere, expect single-tenant / working-renter base with shorter leases.
- Zoned schools: Galaxy Elementary School (math 36% / reading 39%, grade F, #1,596 of 2,144 statewide, top 75%, 617 students, 87% FRL); Congress Community Middle School (math 21% / reading 28%, grade F, #522 of 571 statewide, top 93%, 988 students, 72% FRL); Boynton Beach Community High (math 13% / reading 25%, grade F, #565 of 667 statewide, top 85%, 1,547 students, 65% FRL) — zoned schools average 75% FRL vs 52% district-wide (23 pts higher); higher-poverty schools than district average — tighter screening recommended.
- Zoned-school proficiency averages 27% at this address vs 50% district-wide (-22 pts) — the specific schools serving this property underperform the Palm Beach average; the district grade overstates school quality for this exact location.
- Market conditions: Rents flat; 232 active listings in the ZIP; 40 comparable units currently listed for rent nearby; rentals at typical pace (median 22d on market — plan ~3-4 weeks tenant-placement turnaround); 3,974 units permitted in Palm Beach County in 2024 (1,012 in 5+ unit buildings).
- This rent runs 37% of the median local income ($74k/yr) — at the standard rent-burdened threshold; future hikes will face affordability resistance.
Forward outlook
- Local home prices are declining (-3.0%/yr); year-one equity from $2k of loan paydown is wiped out by about $7k of value loss. Plan a longer hold.
- Palm Beach County population projected at +30% by 2050 — long-run rental-demand tailwind backs the buy-and-hold thesis.
Negotiation context
- Only 1 days on market — expect competitive offers; lowballing is unlikely to land.
- Current owner paid $86k; list at $235k implies a 172% gain — meaningful room to come down on a strong offer.
Risks & watch-outs
- Climate carrying-cost: major flood risk; severe wind risk, 99% chance of damaging wind over 30y; extreme-heat days projected 7→23/yr by 2055 (HVAC capex compounding) — expect insurance premiums to compound above CPI over the hold.
Questions for the listing agent
- What do current leases actually rent for vs. the listed asking? Can we see a recent rent roll and the last 12 months of T-12 income?
- Built in 1974 — when were the roof, HVAC, electrical panel, plumbing, and water heater last replaced?
- What does the HOA fee cover, when was the last increase, and are there any pending special assessments or reserve-fund shortfalls?
- Is there a deadline driving the sale (1031 exchange, divorce, estate, relocation)? That informs how much negotiation room exists.
- Crime grade is D in this area — have there been break-ins, vandalism, or insurance claims at this property in the last 3 years? What carrier currently insures it and at what premium?
- The area grade is low — what's the realistic commute time and amenity access for the typical tenant pool here? Any planned neighborhood developments (good or bad) we should know about?
- What's the average days-on-market for RENTAL listings here right now (not sales)? A rising rental-DOM trend means longer vacancies and softer asking-rent achievability than the comps imply.
- What's the recent tenant-quality profile in this submarket — average credit score on applications, eviction rate, late-payment / NSF rate, and stable-employment percentage? A property-management company in the area should have these aggregated.
- How much new for-sale + rental construction is in the pipeline within 1–3 miles? Heavy new supply typically softens prices + rents 12–24 months out; constrained supply supports both.
Investment metrics
- 1% rule
- 0.98% ✗
- Cap rate
- 5.68%
- Cash-on-cash
- -2.17%
- DSCR
- 0.90
- GRM
- 8.5
CMA / ARV
No comps found within radius.
Projected returns pro-forma
-3.0% appreciation · 0.93% rent growth · sell at horizon
- IRR
- -22.6%
- Equity multiple
- 0.24×
- Total profit
- $-50,108
- Equity at exit
- $35,024
- IRR
- -24.5%
- Equity multiple
- -0.08×
- Total profit
- $-70,931
- Equity at exit
- $20,310
Cash invested: $65,772 (down + closing). Projections, not guarantees.
Landlord ↔ Tenant lean methodology
- Overall (STATE)
- 87 Strongly Landlord-Friendly
- State Florida
- 87 Strongly Landlord-Friendly · R+3
- County
- — inherits STATE
- City
- — inherits STATE
ZIP-level market 33426
- Rents YoY
- 0.9%
- Active inventory
- 232
- Price-to-rent
- 8.5×
Monthly cashflow live
- Estimated rent
- $2,297 high interval (Pro) →
- Mortgage (P&I)
- −$1,232
- Tax from tax record
- −$417 /mo · $5,000/yr
- Insurance
- −$98
- HOA
- −$187
- Vacancy / Maint / Mgmt
- −$482
- Net cashflow
- $-119
Break-even live
Sensitivity live
| Price | -10% $14 | -5% $-53 | +0% $-119 | +5% $-186 | +10% $-252 |
|---|---|---|---|---|---|
| Rent | -10% $-300 | -5% $-210 | +0% $-119 | +5% $-28 | +10% $62 |
| Rate | -1.0pp $-1 | -0.5pp $-59 | base $-119 | +0.5pp $-180 | +1.0pp $-242 |
UW: 25.0% down · 7.5% · 30yr · 1.5% tax · 5.0% vac · 8.0% maint · 8.0% mgmt
Financing live
Cash to close
- Down payment
- $58,725
- Closing costs
- $7,047
- Reserves months
- —
- Total cash needed
- —
Loan-product check · same deal, 3 products live
Conventional
25% down · 7.5% · 30yr
- Down + closing
- —
- Monthly P&I
- —
- Monthly cashflow
- —
- DSCR
- —
- Eligible?
- —
Personal DTI + credit; lowest rate.
DSCR
20% down · 8.5% · 30yr
- Down + closing
- —
- Monthly P&I
- —
- Monthly cashflow
- —
- DSCR
- —
- Eligible?
- —
No personal income docs; deal must DSCR.
Hard money
10% down · 12.0% · 12mo
- Down + closing
- —
- Monthly P&I
- —
- Monthly cashflow
- —
- DSCR
- —
- Eligible?
- —
Short-term bridge; refi at stabilization.
Rent comps 40 comps
| Address | Beds | Baths | Sqft | Rent | $/sqft | DOM | Units | Dist |
|---|---|---|---|---|---|---|---|---|
| 1575 SW 8th St Boynton Beach, FL | 1.0–3.0 | 1.0–2.0 | 1104 | $2,288 | $2.07 | 0d | 23 | 0.16mi |
| 2001 W Woolbright Rd Unit F204 Boynton Beach, FL | 2.0 | 2.0 | 986 | $1,975 | $2.00 | 26d | 1 | 0.27mi |
| 100 Newlake Dr Boynton Beach, FL | 1.0–3.0 | 1.0–2.0 | 1261 | $2,514 | $1.99 | 1d | 22 | 0.31mi |
| 2086 SW 12th Ave Boynton Beach, FL | 2.0 | 2.0 | 1428 | $2,400 | $1.68 | 20d | 1 | 0.33mi |
| 1915 SW 17th Ave Boynton Beach, FL | 3.0 | 2.0 | 1317 | $2,990 | $2.27 | 19d | 1 | 0.34mi |
| 2141 W Woolbright Rd Unit L106 Boynton Beach, FL | 2.0 | 2.0 | 1000 | $1,900 | $1.90 | 16d | 1 | 0.38mi |
| 123 SW 13th St Boynton Beach, FL | 2.0 | 1.0 | 1044 | $2,275 | $2.18 | 26d | 1 | 0.40mi |
| 1009 SW 3rd Way Boynton Beach, FL | 2.0 | 1.0 | 1050 | $2,200 | $2.10 | 7d | 1 | 0.46mi |
| 108 SW 9th St Boynton Beach, FL | 2.0 | 1.5 | 1080 | $2,900 | $2.69 | 26d | 1 | 0.47mi |
| 907 SW 3rd Ave Boynton Beach, FL | 2.0 | 2.0 | 1480 | $2,500 | $1.69 | 26d | 1 | 0.50mi |
| 806 Ocean Dr Boynton Beach, FL | 2.0 | 1.0 | 1012 | $2,100 | $2.08 | 26d | 1 | 0.53mi |
| 2400 SW 19th Ave #104 Boynton Beach, FL | 2.0 | 2.0 | 1211 | $2,375 | $1.96 | 26d | 1 | 0.65mi |
| 255 South Blvd Unit D Boynton Beach, FL | 2.0 | 2.0 | 1104 | $2,100 | $1.90 | 26d | 1 | 0.73mi |
| 255 South Blvd Unit D Boynton Beach, FL | 2.0 | 2.0 | 1104 | $1,975 | $1.79 | 5d | 1 | 0.73mi |
| 1009 Leisure Ln Boynton Beach, FL | 2.0 | 2.0 | 1428 | $2,400 | $1.68 | 6d | 1 | 0.75mi |
| 1561 Stonehaven Dr Boynton Beach, FL | 1.0–2.0 | 1.0–2.0 | 975 | $2,084 | $2.14 | 5d | 4 | 0.77mi |
| 815 W Boynton Beach Blvd Boynton Beach, FL | 2.0 | 2.0 | 885 | $2,250 | $2.54 | 4d | 4 | 0.82mi |
| 815 Boynton Beach Blvd Unit 2-106 Boynton Beach, FL | 2.0 | 2.0 | 887 | $1,800 | $2.03 | 9d | 1 | 0.82mi |
| 815 Boynton Beach Blvd Unit 12-106 Boynton Beach, FL | 2.0 | 2.0 | 887 | $2,500 | $2.82 | 6d | 1 | 0.82mi |
| 815 Boynton Beach Blvd Unit 10-203 Boynton Beach, FL | 2.0 | 2.0 | 1104 | $1,850 | $1.68 | 26d | 1 | 0.86mi |
| 815 Boynton Beach Blvd Unit 14-102 Boynton Beach, FL | 1.0 | 1.0 | 768 | $1,800 | $2.34 | 7d | 1 | 0.86mi |
| 815 Boynton Beach Blvd Unit 6-104 Boynton Beach, FL | 1.0 | 1.0 | 791 | $1,850 | $2.34 | 13d | 1 | 0.86mi |
| 226 SW 13th Ave Unit 226 Boynton Beach, FL | 3.0 | 2.0 | 1284 | $3,999 | $3.11 | 26d | 1 | 0.86mi |
| 815 Boynton Beach Blvd Unit 11-202 Boynton Beach, FL | 2.0 | 2.0 | 994 | $2,000 | $2.01 | 26d | 1 | 0.86mi |
| 2301 S Congress Ave Boynton Beach, FL | 1.0–3.0 | 1.0–2.0 | 1033 | $2,182 | $2.11 | 0d | 16 | 0.87mi |
| 815 Boynton Beach Blvd Unit 14-106 Boynton Beach, FL | 2.0 | 2.0 | 887 | $2,050 | $2.31 | 14d | 1 | 0.88mi |
| 815 Boynton Beach Blvd Unit 14-106 Boynton Beach, FL | 2.0 | 2.0 | 887 | $2,250 | $2.54 | 26d | 1 | 0.88mi |
| 815 Boynton Beach Blvd Unit 15-203 Boynton Beach, FL | 2.0 | 2.0 | 884 | $2,200 | $2.49 | 26d | 1 | 0.89mi |
| 1036 Coral Dr Boynton Beach, FL | 3.0 | 2.0 | 1287 | $3,800 | $2.95 | 26d | 1 | 0.93mi |
| 815 Boynton Beach Blvd Unit 10-205 Boynton Beach, FL | 2.0 | 2.0 | 884 | $1,900 | $2.15 | 20d | 1 | 0.93mi |
| 815 Boynton Beach Blvd Unit 10-205 Boynton Beach, FL | 2.0 | 2.0 | 884 | $1,800 | $2.04 | 5d | 1 | 0.93mi |
| 815 Boynton Beach Blvd Unit 16-205 Boynton Beach, FL | 2.0 | 2.0 | 884 | $2,150 | $2.43 | 13d | 1 | 0.93mi |
| 815 Boynton Beach Blvd Unit 12-101 Boynton Beach, FL | 2.0 | 2.0 | 887 | $1,900 | $2.14 | 26d | 1 | 0.93mi |
| 127 SW 10th Ave Boynton Beach, FL | 2.0 | 1.5 | 754 | $3,500 | $4.64 | 17d | 1 | 0.99mi |
| 605 SW 1st Ct Boynton Beach, FL | 2.0 | 1.5 | 1248 | $2,050 | $1.64 | 26d | 1 | 1.04mi |
| 1201 Belmont Pl Boynton Beach, FL | 2.0 | 2.0 | 1143 | $2,400 | $2.10 | 26d | 1 | 1.04mi |
| 1101 Belmont Pl #1101 Boynton Beach, FL | 2.0 | 2.0 | 1143 | $2,300 | $2.01 | 22d | 1 | 1.04mi |
| 401 Belmont Pl Boynton Beach, FL | 2.0 | 2.0 | 1143 | $2,300 | $2.01 | 26d | 1 | 1.04mi |
| 204 Belmont Pl Boynton Beach, FL | 1.0 | 1.0 | 878 | $2,200 | $2.51 | 26d | 1 | 1.04mi |
| 1201 Belmont Pl Boynton Beach, FL | 2.0 | 2.0 | 1143 | $2,400 | $2.10 | 21d | 1 | 1.04mi |
HOA detail
- Monthly dues
- $187 · $2,244/yr
Listing history 1 events
-
2026-06-22$234,900 Active 1 DOM
ⓘ Source: listings_history table (triggers on properties + properties_extension) + one-shot
backfill from property_details.listing_events for pre-trigger history.
Tax reassessment forecast FL · Resets to sale price
- Current annual tax
- $5,000 · $417/mo
- Projected year-2 tax
- $5,000 · $417/mo
- Expected delta
- $0/yr ($0/mo · 0.0%)
ⓘ Screening estimate from a state-policy table — verify with the county assessor before closing.
Climate risk First Street
- Flood 6/10 Major FEMA zone X (unshaded) · 70% chance over 30 yrs
- Wildfire 1/10 Low
- Heat 9/10 Extreme 7 d/yr ≥105°F today · 23 d/yr by 30 yrs out
- Wind 10/10 Extreme 99% chance of damaging wind over 30 yrs
- Air quality 2/10 Low 1 unhealthy d/yr today · 2 by 30 yrs out
Nearby sold comps map
Loading sold comps map…
Walkable amenities ~0.75 mi
Loading nearby amenities…
Taxation est. · year 1
- Rental income
- $27,560
- − Mortgage interest
- −$13,158
- − Property taxes
- −$5,000
- − Insurance
- −$1,174
- − Repairs & maintenance
- −$2,205
- − Management
- −$2,205
- − HOA
- −$2,244
- − Depreciation
- −$6,833
- Taxable loss
- −$5,260
- Est. tax savings @ 24.0%
- +$1,262
- After-tax cash flow
- $-166/yr
For passive investors: Depreciation is non-cash, so a rental often shows a tax loss while cash-flowing — sheltering income. Rental losses are passive: they offset passive income freely, and up to $25,000/yr can offset ordinary (W-2) income if you actively participate and your MAGI is under $100k (phasing out to $0 by $150k); unused losses carry forward. On sale, claimed depreciation is recaptured at up to 25%, and gains may owe capital-gains tax (a 1031 exchange can defer both). Figures are a year-1 estimate at your 24.0% rate — not tax advice; consult a CPA.
Schools (NCES district)
- District
- Palm Beach
- NCES district ID
- 1201500
- Math proficiency
- 46% ▼ -16.00%
- Reading proficiency
- 53% ▼ -4.00%
- Median HH income
- $53,943
- Composite
- 42.72/100
- National rank
- #3160
- State rank
- #34 of 73 in FL
Livability — Boynton Beach
- Score
- 72/100
- State rank
- #351
- US rank
- #6098
Category grades
Schools grade is shown separately in the Schools card above.
Census & demographics
- Census place
- Boynton Beach, FL
- County
- Palm Beach County · 1,438,312 people
- City population
- 148,060
- Metro
- Miami-Fort Lauderdale-Pompano Beach, FL
- Population (ZIP)
- 24,255
- Household income
- $74,223
- Rent vs Own
- Severe rent burden
- 1417.0
Population outlook (Palm Beach County) Hauer SSP2
- Today (2025)
- 1,637,487 people
- By 2030
- 1,743,255 · +6.5%
- By 2040
- 1,948,712 · +19.0%
- By 2050
- 2,132,979 · +30.3%
- By 2075
- 2,530,027 · +54.5%
- By 2100
- 2,706,979 · +65.3%
Race, ethnicity, and origin ACS 2023
- Neighborhood character
- Diverse neighborhood (Simpson 0.66)
- Race & ethnicity
- White 51% Black 23% Hispanic / Latino 17% Two or more races 14% Asian 4%
- Hispanic origin (detail)
- Puerto Rican 3% Cuban 2%
- Common ancestry
- Hispanic 9% Romanian 2% Lithuanian 2%
- Foreign-born
- 29% · Canada, Jamaica, Vietnam
- Languages at home
- 66% English-only · Spanish 16% French/Haitian/Cajun 11% Other Indo-European 5%
Political lean MEDSL · Palm Beach
- 2024 margin
- Toss-up / Even · D 50.0% · R 49.2%
- 2008→2024 swing
- -22.1pp toward R · 2008: 22.9pp · 2024: 0.8pp
- All cycles
- 2024: D+0.8 2020: D+12.8 2016: D+15.3 2012: D+17.0 2008: D+22.9
Not yet ingested
- Civics
- —
Market trends
- HPI YoY
- ▼ -205.96%
- Current HPI
- 335.3805
- Rent YoY
- ▲ 0.93%
- Metro
- Miami-Fort Lauderdale-Pompano Beach, FL
- State GDP YoY
- ▲ 3.28%
- F500 in state
- 36
Industry mix (Fortune 500 HQ in FL)
| Industry | F500 HQs | Revenue |
|---|---|---|
| Industrial Technology | 2 | $29B |
|
||
| Insurance | 2 | $17B |
|
||
| Retail | 1 | $60B |
|
||
| Technology Distribution | 1 | $58B |
|
||
| Homebuilding | 1 | $35B |
|
||
| Technology Manufacturing | 1 | $35B |
|
||
Price history
+171.6% since first listed2 events — show timeline
- 2026-06-19 Listed $234,900 Beaches MLS
- 2002-06-04 Sold (Public Records) $86,500 Public Records
Property tax history
+11.7%/yrLatest (2025): $5,000 · +264.2% YoY. Source: county tax records.
Cash-flow waterfall
monthlySold comps — $/sqft
last 12 mo · ≤1 miLoading sold comps…