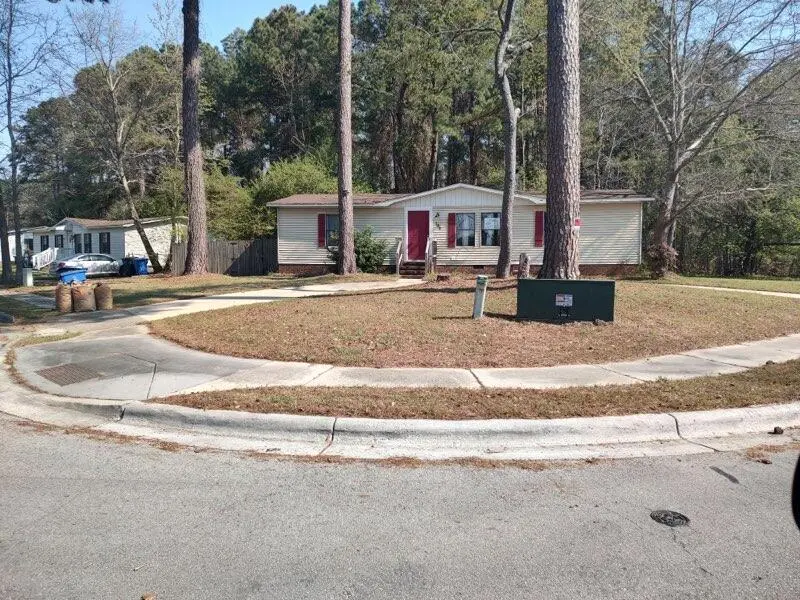
100 Rita Pl · Jacksonville, NC
Flood risk 1/10 · Minimal
- FEMA flood zone
- X (unshaded)
- Chance of flooding over 30 yrs
- 0.0%
- Est. flood insurance / yr
- $507 – $1,088
Fire risk 5/10 · Moderate
- Est. fire insurance / yr
- $906 – $1,684
Heat risk 8/10 · Major
- Hot days now (above 106°F)
- 7 days/yr
- Hot days in 30 yrs
- 18 days/yr
Wind risk 8/10 · Major
- Chance of severe wind over 30 yrs
- 98.0%
Air-quality risk 3/10 · Minor
- Unhealthy air days now
- 2 days/yr
- Unhealthy air days in 30 yrs
- 4 days/yr
Risk factors via First Street. Map © Google.
Why this score? — see what drove the B grade
The composite is a weighted blend of 9 inputs, each scored 0–100. Each bar is that input's sub-score; the figure is the points it added to the 100-point composite (weight × sub-score).
- Cash flow +28.1/30.0
- ARV discount +15.0/15.0
- DSCR +10.0/10.0
- 1% rule +6.5/10.0
- Schools +3.9/10.0
- Livability +3.6/5.0
- Condition / age +2.5/5.0
- Rent growth +1.7/5.0
- Appreciation +0.0/10.0
$129,900
🖨 Deal sheet 📄 Offer letter ✓ Due diligence
Listing remarks MLS
WOW!!!! Nothing left untouched on this home!! ALL NEW flooring, paint and fixtures, New stainless steel appliances AND all NEW cabinetry! Did I mention it has a new 2022 HVAC system!?! Talk about efficiency! The circle driveway in the front is freshly poured as well. This home sits on a beautiful corner lot and is completely, privately fenced in. Within walking distance to the elementary school and is situated in the middle of Jacksonville, conveniently located to Camp Lejuene's Holcomb gate as well as th Wilson and Camp Johnson gates. Call to schedule your tour, as this home won't last long!
Key facts
- Wood privacy fence
- Circular driveway
- 6,534 sq ft lot
Tags
Property features AI
Finance
- Financial info: Pets allowed with no restrictions
Exterior
- Parking: Driveway parking for up to 4 vehicles
- Utilities: Public water; Public sewer; Electricity available; Water available; Sewer available
- Home design: Manufactured double-wide home; Single-story; Faces east; Resale condition
- Construction: Pre-fab construction; Shingle roof; Brick skirt
- Exterior features: Wood fencing; Corner lot
Interior
- Kitchen: Dishwasher; Electric range; Microwave; Refrigerator; Electric water heater
- Bedrooms: Three main-level bedrooms
- Flooring: Vinyl
- Bathrooms: Two full bathrooms (main level)
- Heating & cooling: Central heating; Central air
- Interior features: Split bedroom layout; Blinds; Has electric fireplace
- Laundry & utility: Washer hookup
Neighborhood map
What this means for you Summary
Snapshot
- This is a 3-bed/2.0-bath manufactured listed at $130k.
Deal economics
- At list price, monthly cash flow is $408 ($5k/yr) — positive.
- The deal already cash-flows at list — no discount required.
- Meets the 1% rule at list price ($1k rent vs $130k).
- Cap rate 10.1% vs local median 4.4% in Jacksonville — top-decile yield for the area; either an underpriced asset or a hidden risk that comps aren't pricing in. Stress-test before assuming the spread holds.
Location & tenants
- Location reads 71/100 on livability (#111 in NC) — a middle-class / working-renter tenant base. Strengths: cost of living A+, housing A+, health & safety A+; Watch: schools C-, employment D, crime F.
- Onslow County Schools (other): math 42% / reading 49% proficiency, ranked #84 of 178 in NC (top 47%) — families likely to look elsewhere, expect single-tenant / working-renter base with shorter leases.
- Market conditions: Rents falling (-3.4%/yr); 1 active listings in the ZIP; 8 comparable units currently listed for rent nearby; rentals at typical pace (median 21d on market — plan ~3-4 weeks tenant-placement turnaround); solid renter incomes; 1,246 units permitted in Onslow County in 2024 (0 in 5+ unit buildings).
Forward outlook
- Local home prices are declining (-3.0%/yr); year-one equity from $898 of loan paydown is wiped out by about $4k of value loss. Plan a longer hold.
Negotiation context
- Only 7 days on market — expect competitive offers; lowballing is unlikely to land.
- 3 sale attempts since 12y ago with the ask held roughly flat each time — persistent listings suggest the price (not the market) is what's stuck; bring a comps-based counter.
Risks & watch-outs
- Climate carrying-cost: severe wind risk, 98% chance of damaging wind over 30y; moderate wildfire risk; extreme-heat days projected 7→18/yr by 2055 (HVAC capex compounding) — expect insurance premiums to compound above CPI over the hold.
Questions for the listing agent
- Is there a deadline driving the sale (1031 exchange, divorce, estate, relocation)? That informs how much negotiation room exists.
- Crime grade is F in this area — have there been break-ins, vandalism, or insurance claims at this property in the last 3 years? What carrier currently insures it and at what premium?
- What's the average days-on-market for RENTAL listings here right now (not sales)? A rising rental-DOM trend means longer vacancies and softer asking-rent achievability than the comps imply.
- What's the recent tenant-quality profile in this submarket — average credit score on applications, eviction rate, late-payment / NSF rate, and stable-employment percentage? A property-management company in the area should have these aggregated.
- How much new for-sale + rental construction is in the pipeline within 1–3 miles? Heavy new supply typically softens prices + rents 12–24 months out; constrained supply supports both.
Investment metrics
- 1% rule
- 1.15% ✓
- Cap rate
- 10.07%
- Cash-on-cash
- 13.48%
- DSCR
- 1.60
- GRM
- 7.2
CMA / ARV
- ARV (on-the-fly)
- $160,128
- Comps found
- 2
Show comp detail 2 sales within ~0.75 mi
| Address | Dist | Beds/Ba | Sqft | Sold | Price | $/sf | Match |
|---|---|---|---|---|---|---|---|
| 106 Paula Pl | 0.08mi | 3/2.0 | 1,151 (-0%) | 1mo | $160,000 | $139 | 95 |
| 103 Rachel Pl | 0.11mi | 3/2.0 | 1,152 (0%) | 20mo | $150,000 | $130 | 78 |
Match score weights: distance 35% · size 25% · config 20% · recency 20%. Top-matched comps best support the ARV.
Projected returns pro-forma
-3.0% appreciation · 0.0% rent growth · sell at horizon
- IRR
- 0.4%
- Equity multiple
- 1.01×
- Total profit
- $525
- Equity at exit
- $19,369
- IRR
- 7.0%
- Equity multiple
- 1.46×
- Total profit
- $16,784
- Equity at exit
- $11,231
Cash invested: $36,372 (down + closing). Projections, not guarantees.
Landlord ↔ Tenant lean methodology
- Overall (STATE)
- 85 Strongly Landlord-Friendly
- State North Carolina
- 85 Strongly Landlord-Friendly · R+3
- County
- — inherits STATE
- City
- — inherits STATE
ZIP-level market 32223
- Rents YoY
- -3.4%
- Active inventory
- 1
- Price-to-rent
- 7.2×
Monthly cashflow live
- Estimated rent
- $1,497 high interval (Pro) →
- Mortgage (P&I)
- −$681
- Tax from tax record
- −$39 /mo · $466/yr
- Insurance
- −$54
- HOA
- −$0
- Vacancy / Maint / Mgmt
- −$314
- Net cashflow
- $408
Break-even live
UW: 25.0% down · 7.5% · 30yr · 1.5% tax · 5.0% vac · 8.0% maint · 8.0% mgmt
Financing live
Cash to close
- Down payment
- $32,475
- Closing costs
- $3,897
- Reserves months
- —
- Total cash needed
- —
Loan-product check · same deal, 3 products live
Conventional
25% down · 7.5% · 30yr
- Down + closing
- —
- Monthly P&I
- —
- Monthly cashflow
- —
- DSCR
- —
- Eligible?
- —
Personal DTI + credit; lowest rate.
DSCR
20% down · 8.5% · 30yr
- Down + closing
- —
- Monthly P&I
- —
- Monthly cashflow
- —
- DSCR
- —
- Eligible?
- —
No personal income docs; deal must DSCR.
Hard money
10% down · 12.0% · 12mo
- Down + closing
- —
- Monthly P&I
- —
- Monthly cashflow
- —
- DSCR
- —
- Eligible?
- —
Short-term bridge; refi at stabilization.
Rent comps 8 comps
| Address | Beds | Baths | Sqft | Rent | $/sqft | DOM | Units | Dist |
|---|---|---|---|---|---|---|---|---|
| 215 Valencia Dr Jacksonville, NC | 1.0–2.0 | 1.0–2.0 | 842 | $1,285 | $1.53 | 21d | 1 | 1.10mi |
| 337 Starling St Jacksonville, NC | 2.0 | 1.0 | 820 | $1,100 | $1.34 | 21d | 1 | 1.17mi |
| 120 Palace Cir Jacksonville, NC | 3.0 | 2.5 | 1378 | $1,400 | $1.02 | 21d | 1 | 1.20mi |
| 190 Valencia Dr Unit 110A Jacksonville, NC | 2.0 | 2.0 | 1130 | $1,425 | $1.26 | 21d | 1 | 1.22mi |
| 148 Corey Cir Unit 148 Jacksonville, NC | 2.0 | 1.0 | 868 | $1,200 | $1.38 | 21d | 1 | 1.30mi |
| 507 Birchwood Ct Jacksonville, NC | 3.0 | 2.0 | 1314 | $1,525 | $1.16 | 13d | 1 | 1.37mi |
| 821 Shadowridge Rd Jacksonville, NC | 3.0 | 2.0 | 1488 | $750 | $0.50 | 21d | 1 | 1.42mi |
| 301 Village Dr Jacksonville, NC | 1.0–2.0 | 1.0 | 725 | $1,095 | $1.51 | 13d | 2 | 1.42mi |
Listing history 7 events
-
2026-06-15status $129,900 Pending 7 DOM
-
2026-06-10days on market $129,900 Active 7 DOM
-
2026-06-09days on market $129,900 Active 6 DOM
-
2026-06-08days on market $129,900 Active 5 DOM
-
2026-06-07days on market $129,900 Active 4 DOM
-
2026-06-03remarks 699-char remark
-
2026-06-03$129,900 Active 1 DOM
ⓘ Source: listings_history table (triggers on properties + properties_extension) + one-shot
backfill from property_details.listing_events for pre-trigger history.
Tax reassessment forecast NC · Resets to sale price
- Current annual tax
- $466 · $39/mo
- Projected year-2 tax
- $1,065 · $89/mo
- Expected delta
- +$599/yr (+$50/mo · 128.5%)
ⓘ Screening estimate from a state-policy table — verify with the county assessor before closing.
Climate risk First Street
- Flood 1/10 Low FEMA zone X (unshaded) · 0% chance over 30 yrs
- Wildfire 5/10 Major
- Heat 8/10 Severe 7 d/yr ≥106°F today · 18 d/yr by 30 yrs out
- Wind 8/10 Severe 98% chance of damaging wind over 30 yrs
- Air quality 3/10 Moderate 2 unhealthy d/yr today · 4 by 30 yrs out
Nearby sold comps map
Loading sold comps map…
Walkable amenities ~0.75 mi
Loading nearby amenities…
Taxation est. · year 1
- Rental income
- $17,964
- − Mortgage interest
- −$7,276
- − Property taxes
- −$466
- − Insurance
- −$650
- − Repairs & maintenance
- −$1,437
- − Management
- −$1,437
- − Depreciation
- −$3,779
- Taxable income
- $2,919
- Est. tax owed @ 24.0%
- −$701
- After-tax cash flow
- $4,201/yr
For passive investors: Depreciation is non-cash, so a rental often shows a tax loss while cash-flowing — sheltering income. Rental losses are passive: they offset passive income freely, and up to $25,000/yr can offset ordinary (W-2) income if you actively participate and your MAGI is under $100k (phasing out to $0 by $150k); unused losses carry forward. On sale, claimed depreciation is recaptured at up to 25%, and gains may owe capital-gains tax (a 1031 exchange can defer both). Figures are a year-1 estimate at your 24.0% rate — not tax advice; consult a CPA.
Schools (NCES district)
- District
- Onslow County Schools
- NCES district ID
- 3703450
- Math proficiency
- 42% ▲ 6.00%
- Reading proficiency
- 49% ▲ 5.00%
- Median HH income
- $46,076
- Composite
- 38.66/100
- National rank
- #4148
- State rank
- #84 of 178 in NC
Livability — Jacksonville
- Score
- 71/100
- State rank
- #111
- US rank
- #6991
Category grades
Schools grade is shown separately in the Schools card above.
Census & demographics
- Census place
- Jacksonville, NC
- County
- Duval County
- City population
- 96,397
- Metro
- Jacksonville, FL
- Population (ZIP)
- 26,160
- Household income
- $95,347
- Rent vs Own
- Severe rent burden
- 380.0
Population outlook (Onslow County) Hauer SSP2
- Today (2025)
- 189,789 people
- By 2030
- 194,463 · +2.5%
- By 2040
- 193,629 · +2.0%
- By 2050
- 193,248 · +1.8%
- By 2075
- 196,995 · +3.8%
- By 2100
- 201,513 · +6.2%
Race, ethnicity, and origin ACS 2023
- Neighborhood character
- Predominantly White (76%)
- Race & ethnicity
- White 76% Two or more races 11% Hispanic / Latino 9% Black 6% Asian 2%
- Hispanic origin (detail)
- Mexican 1% Puerto Rican 2% Cuban 1%
- Common ancestry
- Italian 6% Slovak 3% Romanian 3%
- Foreign-born
- 10% · Canada, Jamaica
- Languages at home
- 88% English-only · Spanish 5% Other Indo-European 2% Arabic 2%
Political lean MEDSL · Onslow
- 2024 margin
- Solid R (+35.9) · D 31.5% · R 67.5% · Other 1.0%
- 2008→2024 swing
- -14.5pp toward R · 2008: -21.5pp · 2024: -35.9pp
- All cycles
- 2024: R+35.9 2020: R+30.2 2016: R+34.6 2012: R+27.0 2008: R+21.5
Not yet ingested
- Civics
- —
Market trends
- HPI YoY
- ▼ -254.71%
- Current HPI
- 296.3365
- Rent YoY
- ▼ -3.38%
- Metro
- Jacksonville, FL
- State GDP YoY
- ▲ 3.28%
- F500 in state
- 26
Industry mix (Fortune 500 HQ in NC)
| Industry | F500 HQs | Revenue |
|---|---|---|
| Financial Services | 2 | $213B |
|
||
| Retail | 2 | $95B |
|
||
| Industrial Conglomerate | 1 | $38B |
|
||
| Metals / Steel | 1 | $35B |
|
||
| Utilities | 1 | $30B |
|
||
| Industrial Machinery | 1 | $19B |
|
||
Price history
+92.4% since first listed8 events — show timeline
- 2026-06-03 Listed $129,900 Beaches MLS
- 2022-10-10 Sold (MLS) $120,000 Hive MLS
- 2022-10-07 Sold (Public Records) $120,000 Public Records
- 2022-09-29 Pending — Hive MLS
- 2022-09-21 Listed $135,000 Hive MLS
- 2014-11-21 Sold (MLS) $14,750 Hive MLS
- 2014-09-24 Listed $16,750 Hive MLS
- 2008-03-24 Sold (Public Records) $67,500 Public Records
Property tax history
-4.1%/yrLatest (2025): $466 · +0.0% YoY. Source: county tax records.
Cash-flow waterfall
monthlySold comps — $/sqft
last 12 mo · ≤1 miLoading sold comps…