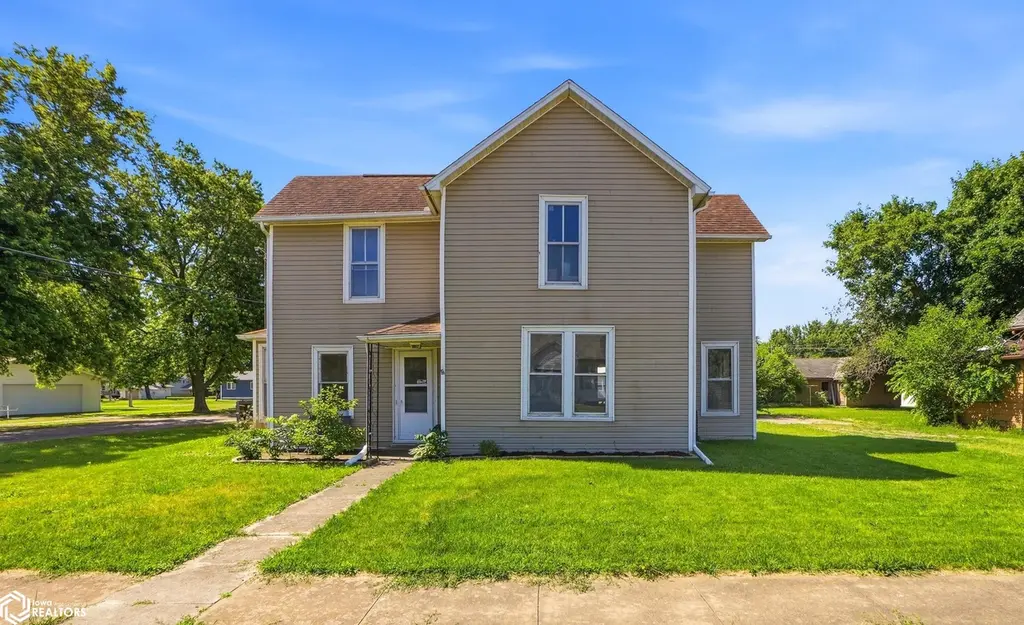
210 E Center St · Winfield, IA
Flood risk 1/10 · Minimal
- FEMA flood zone
- X (unshaded)
- Chance of flooding over 30 yrs
- 0.0%
- Est. flood insurance / yr
- $473 – $860
Fire risk 2/10 · Minimal
- Est. fire insurance / yr
- $902 – $1,676
Heat risk 3/10 · Minor
- Hot days now (above 105°F)
- 7 days/yr
- Hot days in 30 yrs
- 16 days/yr
Wind risk 2/10 · Minimal
- Chance of severe wind over 30 yrs
- —
Air-quality risk 2/10 · Minimal
- Unhealthy air days now
- 1 days/yr
- Unhealthy air days in 30 yrs
- 2 days/yr
Risk factors via First Street. Map © Google.
Why this score? — see what drove the C grade
The composite is a weighted blend of 9 inputs, each scored 0–100. Each bar is that input's sub-score; the figure is the points it added to the 100-point composite (weight × sub-score).
- Cash flow +18.7/30.0
- ARV discount +12.4/15.0
- DSCR +5.9/10.0
- Schools +5.1/10.0
- Appreciation +5.0/10.0
- 1% rule +4.2/10.0
- Livability +3.4/5.0
- Rent growth +2.5/5.0
- Condition / age +2.5/5.0
$134,900
🖨 Deal sheet 📄 Offer letter ✓ Due diligence
Listing remarks MLS
Affordable home on a corner lot in friendly Winfield is ready for it's new owner!! Many updates have been done including new central air and ductwork in 2025, new kitchen with new SS appliances, new full bath, new flooring, new light fixtures, and fresh paint throughout. Plenty of living space on the main floor with 3 large bedrooms on the upper floor. Don't let this opportunity pass by as these opportunities don't happen often!
Key facts
- New kitchen
- New ss appliances
- New flooring
Tags
Property features AI
Finance
- HOA & community: Association fee paid annually; Community features: Other
Exterior
- Parking: No parking listed
- Utilities: Public water; Public sewer
- Home design: Single-family residence; 2-story
- Construction: Vinyl siding and frame construction; Stone foundation
- Exterior features: Garden; Corner lot; Lot dimensions approximately 64 x 165 (0.24 acres)
Interior
- Kitchen: Refrigerator included
- Flooring: Carpet; Vinyl
- Bathrooms: 1 full bathroom
- Heating & cooling: Central air conditioning; Electric, forced air and natural gas heating
- Interior features: Storm windows; Other interior features
- Laundry & utility: Main-level laundry room; Partial unfinished basement
Neighborhood map
What this means for you Summary
Snapshot
- This is a 4-bed/1.0-bath single-family listed at $135k.
Deal economics
- At list price, monthly cash flow is $134 ($2k/yr) — positive.
- The deal already cash-flows at list — no discount required.
- To meet the 1% rule (rent ≥ 1% of price), the offer needs to be $125k (7.5% below list).
- Recommended offer: $125k (7.5% below list) — sets the bar for 1% rule.
Location & tenants
- Location reads 67/100 on livability (#471 in IA) — a middle-class / working-renter tenant base. Strengths: crime A+, cost of living A+, housing A+; Watch: health & safety D+, amenities F, commute F.
- Winfield-Mt Union Community School District (rural): math 56% / reading 64% proficiency, ranked #243 of 289 in IA (top 84%) — acceptable for families but not a draw, mixed tenant base, ~2y average lease.
- Market conditions: 5 active listings in the ZIP; 30 units permitted in Henry County in 2024 (8 in 5+ unit buildings).
Forward outlook
- In year one you build about $5k of equity ($933 loan paydown + $4k appreciation (3.0% local appreciation)).
- Henry County population projected to shrink 9% by 2050 — rents likely to lag national; underwrite the cash flow, not the appreciation.
- At projected returns (3.0% appreciation + 3.0% rent growth), your $38k cash investment doubles in ~5 years — after that, you're playing with house money.
- By year 7, paydown + projected appreciation supports a ~$32k cash-out refi (75% LTV) — recoverable capital for the next deal without selling this one.
Negotiation context
- Only 14 days on market — expect competitive offers; lowballing is unlikely to land.
- 7 sale attempts since 5y ago with the ask held roughly flat each time — persistent listings suggest the price (not the market) is what's stuck; bring a comps-based counter.
- Current owner paid $57k; list at $135k implies a 137% gain — meaningful room to come down on a strong offer.
Risks & watch-outs
- Watch-outs: built in 1900 — expect roof / HVAC / electrical / plumbing capex.
Questions for the listing agent
- Built in 1900 — when were the roof, HVAC, electrical panel, plumbing, and water heater last replaced?
- Is there a deadline driving the sale (1031 exchange, divorce, estate, relocation)? That informs how much negotiation room exists.
- Schools are B-rated — typically a magnet for longer-tenancy family renters. What's the average tenant stay here, and is there a school-zone premium baked into asking?
- What's the average days-on-market for RENTAL listings here right now (not sales)? A rising rental-DOM trend means longer vacancies and softer asking-rent achievability than the comps imply.
- What's the recent tenant-quality profile in this submarket — average credit score on applications, eviction rate, late-payment / NSF rate, and stable-employment percentage? A property-management company in the area should have these aggregated.
- How much new for-sale + rental construction is in the pipeline within 1–3 miles? Heavy new supply typically softens prices + rents 12–24 months out; constrained supply supports both.
Investment metrics
- 1% rule
- 0.92% ✗
- Cap rate
- 7.48%
- Cash-on-cash
- 4.25%
- DSCR
- 1.19
- GRM
- 9.0
CMA / ARV
- ARV (on-the-fly)
- $151,200
- Comps found
- 4
Show comp detail 4 sales within ~0.75 mi
| Address | Dist | Beds/Ba | Sqft | Sold | Price | $/sf | Match |
|---|---|---|---|---|---|---|---|
| 210 E Center St | 0.00mi | 4/1.0 | 1,575 (0%) | 11mo | $57,000 | $36 | 91 |
| 202 N Clark St | 0.36mi | 4/1.0 | 1,613 (+2%) | 9mo | $132,000 | $82 | 72 |
| 309 S Locust St | 0.13mi | 4/1.5 | 1,437 (-9%) | 22mo | $138,000 | $96 | 59 |
| 103 N Bashford St | 0.41mi | 3/2.0 (-1) | 1,475 (-6%) | 14mo | $195,500 | $133 | 50 |
Match score weights: distance 35% · size 25% · config 20% · recency 20%. Top-matched comps best support the ARV.
Projected returns pro-forma
3.0% appreciation · 3.0% rent growth · sell at horizon
- IRR
- 11.4%
- Equity multiple
- 1.65×
- Total profit
- $24,731
- Equity at exit
- $60,657
- IRR
- 13.6%
- Equity multiple
- 3.01×
- Total profit
- $76,091
- Equity at exit
- $93,479
Cash invested: $37,772 (down + closing). Projections, not guarantees.
Landlord ↔ Tenant lean methodology
- Overall (STATE)
- 83 Strongly Landlord-Friendly
- State Iowa
- 83 Strongly Landlord-Friendly · R+6
- County
- — inherits STATE
- City
- — inherits STATE
ZIP-level market 52659
- Active inventory
- 5
- Price-to-rent
- 9.0×
Monthly cashflow live
- Estimated rent
- $1,247 medium interval (Pro) →
- Mortgage (P&I)
- −$707
- Tax from tax record
- −$88 /mo · $1,058/yr
- Insurance
- −$56
- HOA
- −$0
- Vacancy / Maint / Mgmt
- −$262
- Net cashflow
- $134
Break-even live
UW: 25.0% down · 7.5% · 30yr · 1.5% tax · 5.0% vac · 8.0% maint · 8.0% mgmt
Financing live
Cash to close
- Down payment
- $33,725
- Closing costs
- $4,047
- Reserves months
- —
- Total cash needed
- —
Loan-product check · same deal, 3 products live
Conventional
25% down · 7.5% · 30yr
- Down + closing
- —
- Monthly P&I
- —
- Monthly cashflow
- —
- DSCR
- —
- Eligible?
- —
Personal DTI + credit; lowest rate.
DSCR
20% down · 8.5% · 30yr
- Down + closing
- —
- Monthly P&I
- —
- Monthly cashflow
- —
- DSCR
- —
- Eligible?
- —
No personal income docs; deal must DSCR.
Hard money
10% down · 12.0% · 12mo
- Down + closing
- —
- Monthly P&I
- —
- Monthly cashflow
- —
- DSCR
- —
- Eligible?
- —
Short-term bridge; refi at stabilization.
Listing history 11 events
-
2026-06-18days on market $134,900 Active 14 DOM
-
2026-06-17days on market $134,900 Active 13 DOM
-
2026-06-16days on market $134,900 Active 12 DOM
-
2026-06-15days on market $134,900 Active 11 DOM
-
2026-06-13days on market $134,900 Active 9 DOM
-
2026-06-12days on market $134,900 Active 8 DOM
-
2026-06-09days on market $134,900 Active 5 DOM
-
2026-06-08days on market $134,900 Active 4 DOM
-
2026-06-07days on market $134,900 Active 3 DOM
-
2026-06-07remarks 432-char remark
-
2026-06-07$134,900 Active 2 DOM
ⓘ Source: listings_history table (triggers on properties + properties_extension) + one-shot
backfill from property_details.listing_events for pre-trigger history.
Tax reassessment forecast IA · Partial reset (capped growth)
- Current annual tax
- $1,058 · $88/mo
- Projected year-2 tax
- $1,588 · $132/mo
- Expected delta
- +$530/yr (+$44/mo · 50.1%)
ⓘ Screening estimate from a state-policy table — verify with the county assessor before closing.
Climate risk First Street
- Flood 1/10 Low FEMA zone X (unshaded) · 0% chance over 30 yrs
- Wildfire 2/10 Low
- Heat 3/10 Moderate 7 d/yr ≥105°F today · 16 d/yr by 30 yrs out
- Wind 2/10 Low
- Air quality 2/10 Low 1 unhealthy d/yr today · 2 by 30 yrs out
Nearby sold comps map
Loading sold comps map…
Walkable amenities ~0.75 mi
Loading nearby amenities…
Taxation est. · year 1
- Rental income
- $14,969
- − Mortgage interest
- −$7,556
- − Property taxes
- −$1,058
- − Insurance
- −$674
- − Repairs & maintenance
- −$1,197
- − Management
- −$1,197
- − Depreciation
- −$3,924
- Taxable loss
- −$640
- Est. tax savings @ 24.0%
- +$154
- After-tax cash flow
- $1,757/yr
For passive investors: Depreciation is non-cash, so a rental often shows a tax loss while cash-flowing — sheltering income. Rental losses are passive: they offset passive income freely, and up to $25,000/yr can offset ordinary (W-2) income if you actively participate and your MAGI is under $100k (phasing out to $0 by $150k); unused losses carry forward. On sale, claimed depreciation is recaptured at up to 25%, and gains may owe capital-gains tax (a 1031 exchange can defer both). Figures are a year-1 estimate at your 24.0% rate — not tax advice; consult a CPA.
Schools (NCES district)
- District
- Winfield-Mt Union Community School District
- NCES district ID
- 1931830
- Math proficiency
- 56% ▼ -8.00%
- Reading proficiency
- 64% ▬ 0.00%
- Median HH income
- $51,223
- Composite
- 51.16/100
- National rank
- #1761
- State rank
- #243 of 289 in IA
Livability — Winfield
- Score
- 67/100
- State rank
- #471
- US rank
- #10360
Category grades
Schools grade is shown separately in the Schools card above.
Census & demographics
- Census place
- Winfield, IA
- City population
- 1,393
- Population (ZIP)
- 1,393
Population outlook (Henry County) Hauer SSP2
- Today (2025)
- 19,583 people
- By 2030
- 19,271 · -1.6%
- By 2040
- 18,505 · -5.5%
- By 2050
- 17,796 · -9.1%
- By 2075
- 16,821 · -14.1%
- By 2100
- 15,549 · -20.6%
Race, ethnicity, and origin ACS 2023
- Neighborhood character
- Predominantly White (94%)
- Race & ethnicity
- White 94% Hispanic / Latino 4% Two or more races 1%
- Common ancestry
- Slovak 5% Lithuanian 2% Romanian 2%
- Foreign-born
- 1% · Canada
- Languages at home
- 98% English-only · Spanish 2%
Political lean MEDSL · Henry
- 2024 margin
- Solid R (+36.0) · D 31.3% · R 67.3% · Other 1.5%
- 2008→2024 swing
- -30.9pp toward R · 2008: -5.0pp · 2024: -36.0pp
- All cycles
- 2024: R+36.0 2020: R+32.4 2016: R+30.9 2012: R+6.0 2008: R+5.0
Not yet ingested
- Civics
- —
Market trends
- HPI YoY
- —
- Current HPI
- —
- Rent YoY
- —
- Metro
- —
- State GDP YoY
- ▲ 2.48%
- F500 in state
- 4
Industry mix (Fortune 500 HQ in IA)
| Industry | F500 HQs | Revenue |
|---|---|---|
| Financial Services | 1 | $16B |
|
||
| Retail / Convenience | 1 | $15B |
|
||
Price history
+145.3% since first listed18 events — show timeline
- 2026-06-06 Contingent — IAR
- 2026-06-04 Listed $134,900 ICAARMLS
- 2026-06-04 Listed $134,900 IAR
- 2025-07-30 Sold (Public Records) $57,000 Public Records
- 2025-07-24 Sold (MLS) $57,000 IAR
- 2025-06-19 Pending — IAR
- 2025-05-16 Listed $67,900 IAR
- 2024-04-05 Price Changed $53,000 ICAARMLS
- 2021-10-21 Sold (Public Records) $53,000 Public Records
- 2021-10-15 Sold (MLS) $53,000 Muscatine BOR
- 2021-10-15 Sold (MLS) $53,000 IAR
- 2021-10-15 Sold (MLS) $53,000 ICAARMLS
- 2021-10-01 Sold (MLS) $53,000 CRAAR, CDRMLS
- 2021-08-29 Price Changed $55,000 ICAARMLS
- 2021-07-30 Listed $55,000 CRAAR, CDRMLS
- 2021-07-30 Listed $55,000 Muscatine BOR
- 2021-07-30 Listed $55,000 IAR
- 2021-07-30 Listed $55,000 ICAARMLS
Property tax history
+5.3%/yrLatest (2025): $1,058 · +8.8% YoY. Source: county tax records.
Cash-flow waterfall
monthlySold comps — $/sqft
last 12 mo · ≤1 miLoading sold comps…