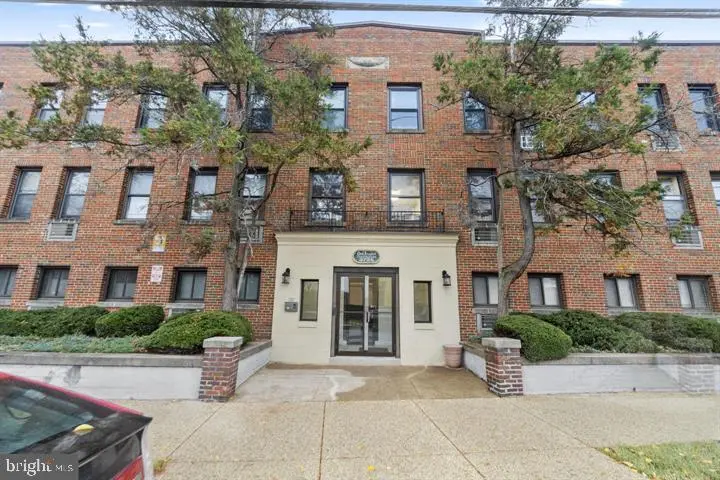
3725 12th St NE #102 · Washington, DC
Flood risk 1/10 · Minimal
- FEMA flood zone
- X (unshaded)
- Chance of flooding over 30 yrs
- 0.0%
- Est. flood insurance / yr
- $507 – $1,088
Fire risk 1/10 · Minimal
- Est. fire insurance / yr
- $631 – $1,173
Heat risk 7/10 · Major
- Hot days now (above 106°F)
- 7 days/yr
- Hot days in 30 yrs
- 15 days/yr
Wind risk 4/10 · Minor
- Chance of severe wind over 30 yrs
- 16.0%
Air-quality risk 4/10 · Minor
- Unhealthy air days now
- 4 days/yr
- Unhealthy air days in 30 yrs
- 5 days/yr
Risk factors via First Street. Map © Google.
Why this score? — see what drove the D grade
The composite is a weighted blend of 9 inputs, each scored 0–100. Each bar is that input's sub-score; the figure is the points it added to the 100-point composite (weight × sub-score).
- Cash flow +11.8/30.0
- ARV discount +7.5/15.0
- 1% rule +5.6/10.0
- Livability +3.7/5.0
- Schools +3.6/10.0
- DSCR +3.5/10.0
- Rent growth +3.4/5.0
- Condition / age +2.5/5.0
- Appreciation +0.0/10.0
$224,900
🖨 Deal sheet 📄 Offer letter ✓ Due diligence
Listing remarks
This 2-bedroom, 1-bath residence offers a well-proportioned layout and a prime opportunity to create a personalized urban retreat. Brand new renovated kitchen. Ideally situated in a convenient Northeast location with access to major commuter routes, local parks, dining, and neighborhood amenities, the property presents a blank canvas ready to be transformed to suit modern living. With generous room sizes and classic DC character, this home provides the chance to design and finish every detail to your taste while investing in a vibrant and evolving community.
Key facts
- $461 HOA
- Built 1936
- Listed 96 days
Property features AI
Finance
- Other: Property manager present; Pets allowed on a case-by-case basis
- HOA & community: Monthly condo fee of $461; HOA managed professionally off-site; HOA fee includes gas and water
Exterior
- Parking: On-street parking
- Utilities: Public water; Public sewer; Electric service
- Home design: Condominium unit (Unit/Flat); Garden-style building (1–4 floors); Entry floor: 2
- Construction: Brick construction; Above-grade unit; Year built estimated
- Exterior features: Common grounds; Tidal water not present; Entry on level 2
Interior
- Bedrooms: 2 bedrooms on main level
- Bathrooms: 1 full bathroom on main level
- Heating & cooling: Wall unit heating (electric); Wall unit cooling (electric); Electric hot water
- Interior features: Estimated living area; No basement
- Laundry & utility: No washer/dryer in unit
Neighborhood map
What this means for you Summary
Snapshot
- This is a 2-bed/1.0-bath condo listed at $225k.
Deal economics
- At list price, monthly cash flow is $-60 ($-720/yr) — negative.
- To cash-flow at today's rent, offer at most $214k (4.7% below list).
- Meets the 1% rule at list price ($2k rent vs $225k).
- Recommended offer: $205k (9.0% below list) — sets the bar for market timing.
- Cap rate 6.0% vs local median 2.5% in Washington — top-decile yield for the area; either an underpriced asset or a hidden risk that comps aren't pricing in. Stress-test before assuming the spread holds.
Location & tenants
- Location reads 73/100 on livability (#1 in DC) — a middle-class / working-renter tenant base. Strengths: amenities A+, commute A+, employment A+; Watch: crime F, cost of living F.
- District Of Columbia Public Schools (urban): math 33% / reading 40% proficiency, ranked #8 of 32 in DC (top 25%) — families likely to look elsewhere, expect single-tenant / working-renter base with shorter leases; 65% free/reduced lunch — lower-income household profile, screen leases tightly.
- Market conditions: Rents rising (+3.5%/yr); 86 active listings in the ZIP; 40 comparable units currently listed for rent nearby; rentals at typical pace (median 22d on market — plan ~3-4 weeks tenant-placement turnaround); solid renter incomes; 1,737 units permitted in District of Columbia in 2024 (1,506 in 5+ unit buildings).
Forward outlook
- Local home prices are declining (-3.0%/yr); year-one equity from $2k of loan paydown is wiped out by about $7k of value loss. Plan a longer hold.
- District of Columbia County population projected at +50% by 2050 — long-run rental-demand tailwind backs the buy-and-hold thesis.
Negotiation context
- It's been on market 96 days — a 9% lower offer ($205k) is reasonable based on typical stale-listing flexibility.
- 3 sale attempts since 2y ago; this cycle's ask has dropped $35k (14%) from the opening price — seller is motivated, your offer sets the floor, not the list.
- Current owner paid $66k; list at $225k implies a 238% gain — meaningful room to come down on a strong offer.
Risks & watch-outs
- Watch-outs: built in 1936 — expect roof / HVAC / electrical / plumbing capex.
- Climate carrying-cost: extreme-heat days projected 7→15/yr by 2055 (HVAC capex compounding) — expect insurance premiums to compound above CPI over the hold.
Questions for the listing agent
- What do current leases actually rent for vs. the listed asking? Can we see a recent rent roll and the last 12 months of T-12 income?
- It's been on market 96 days. Have you received any prior offers? Is the seller open to a 9% concession, seller financing, or rate buy-down credit?
- Built in 1936 — when were the roof, HVAC, electrical panel, plumbing, and water heater last replaced?
- What does the HOA fee cover, when was the last increase, and are there any pending special assessments or reserve-fund shortfalls?
- Any open or pending special assessments — roof, HVAC, plumbing, elevator, façade? What's the per-unit balance and payoff schedule, and is the seller paying it off at close or rolling it to the buyer?
- Why hasn't it sold? Are there any deal-killer items the seller is aware of (foundation, flood, title, zoning, code violations)?
- Is there a deadline driving the sale (1031 exchange, divorce, estate, relocation)? That informs how much negotiation room exists.
- Crime grade is F in this area — have there been break-ins, vandalism, or insurance claims at this property in the last 3 years? What carrier currently insures it and at what premium?
- The area grade is low — what's the realistic commute time and amenity access for the typical tenant pool here? Any planned neighborhood developments (good or bad) we should know about?
- What's the average days-on-market for RENTAL listings here right now (not sales)? A rising rental-DOM trend means longer vacancies and softer asking-rent achievability than the comps imply.
- What's the recent tenant-quality profile in this submarket — average credit score on applications, eviction rate, late-payment / NSF rate, and stable-employment percentage? A property-management company in the area should have these aggregated.
- How much new apartment / multifamily construction is in the pipeline within 1–3 miles? Heavy new supply (>2% of stock underway) typically softens rents 12–24 months out; light construction supports rent growth.
Investment metrics
- 1% rule
- 1.06% ✓
- Cap rate
- 5.97%
- Cash-on-cash
- -1.14%
- DSCR
- 0.95
- GRM
- 7.9
CMA / ARV
No comps found within radius.
Projected returns pro-forma
-3.0% appreciation · 3.48% rent growth · sell at horizon
- IRR
- -17.4%
- Equity multiple
- 0.38×
- Total profit
- $-38,832
- Equity at exit
- $33,533
- IRR
- -8.0%
- Equity multiple
- 0.48×
- Total profit
- $-32,815
- Equity at exit
- $19,445
Cash invested: $62,972 (down + closing). Projections, not guarantees.
Landlord ↔ Tenant lean methodology
- Overall (CITY)
- 0 Strongly Tenant-Friendly
- State District of Columbia
- 12 Strongly Tenant-Friendly · D+43
- County
- — inherits STATE
- City Washington
- 0 Strongly Tenant-Friendly · D+43
ZIP-level market 20017
- Rents YoY
- 3.5%
- Active inventory
- 86
- Price-to-rent
- 7.9×
Monthly cashflow live
- Estimated rent
- $2,387 high interval (Pro) →
- Mortgage (P&I)
- −$1,179
- Tax from tax record
- −$212 /mo · $2,541/yr
- Insurance
- −$94
- HOA
- −$461
- Vacancy / Maint / Mgmt
- −$501
- Net cashflow
- $-60
Break-even live
UW: 25.0% down · 7.5% · 30yr · 1.5% tax · 5.0% vac · 8.0% maint · 8.0% mgmt
Financing live
Cash to close
- Down payment
- $56,225
- Closing costs
- $6,747
- Reserves months
- —
- Total cash needed
- —
Loan-product check · same deal, 3 products live
Conventional
25% down · 7.5% · 30yr
- Down + closing
- —
- Monthly P&I
- —
- Monthly cashflow
- —
- DSCR
- —
- Eligible?
- —
Personal DTI + credit; lowest rate.
DSCR
20% down · 8.5% · 30yr
- Down + closing
- —
- Monthly P&I
- —
- Monthly cashflow
- —
- DSCR
- —
- Eligible?
- —
No personal income docs; deal must DSCR.
Hard money
10% down · 12.0% · 12mo
- Down + closing
- —
- Monthly P&I
- —
- Monthly cashflow
- —
- DSCR
- —
- Eligible?
- —
Short-term bridge; refi at stabilization.
Rent comps 40 comps
| Address | Beds | Baths | Sqft | Rent | $/sqft | DOM | Units | Dist |
|---|---|---|---|---|---|---|---|---|
| 3742 12th St NE Unit 4 Washington, DC | 1.0 | 1.0 | 650 | $1,750 | $2.69 | 24d | 1 | 0.06mi |
| 3742 12th St NE Unit 5 Washington, DC | 2.0 | 1.0 | 825 | $2,100 | $2.55 | 24d | 1 | 0.06mi |
| 3743 12th St NE Washington, DC | 1.0 | 1.0 | 453 | $2,500 | $5.52 | 24d | 5 | 0.06mi |
| 3614 12th St NE Washington, DC | 1.0–2.0 | 1.0–2.0 | 695 | $3,400 | $4.89 | 14d | 2 | 0.07mi |
| 3614 12th St NE #7 Washington, DC | 2.0 | 2.0 | 898 | $3,400 | $3.79 | 7d | 1 | 0.07mi |
| 913 Quincy St NE #3 Washington, DC | 2.0 | 2.0 | 774 | $2,775 | $3.59 | 7d | 1 | 0.25mi |
| 3915 9th St NE #3 Washington, DC | 2.0 | 1.0 | 850 | $2,100 | $2.47 | 24d | 1 | 0.29mi |
| 1324 Randolph St NE Washington, DC | 2.0 | 1.0 | 765 | $2,200 | $2.88 | 22d | 1 | 0.32mi |
| 3207 12th St NE Washington, DC | 2.0 | 2.5 | 874 | $2,775 | $3.18 | 18d | 1 | 0.36mi |
| 625 Monroe St NE Washington, DC | 2.0 | 1.0–2.0 | 829 | $3,648 | $4.40 | 2d | 26 | 0.40mi |
| 4026 7th St NE Unit 1 Washington, DC | 1.0 | 1.0 | 580 | $1,250 | $2.16 | 24d | 1 | 0.43mi |
| 4044 7th St NE Unit 4 Washington, DC | 2.0 | 1.0 | 900 | $1,998 | $2.22 | 22d | 1 | 0.46mi |
| 3018 12th St NE #1 Washington, DC | 2.0 | 2.0 | 740 | $2,500 | $3.38 | 24d | 1 | 0.47mi |
| 3018 12th St NE #2 Washington, DC | 2.0 | 2.0 | 880 | $3,000 | $3.41 | 24d | 1 | 0.47mi |
| 708 Irving St NE #202 Washington, DC | 2.0 | 2.0 | 920 | $2,975 | $3.23 | 24d | 1 | 0.51mi |
| 2900 12th St NE #102 Washington, DC | 2.0 | 2.0 | 815 | $3,200 | $3.93 | 15d | 1 | 0.58mi |
| 613 Hamlin St NE Washington, DC | 1.0 | 1.0 | 600 | $1,450 | $2.42 | 24d | 1 | 0.66mi |
| 622 Girard St NE Unit 301 Washington, DC | 2.0 | 1.0 | 900 | $1,995 | $2.22 | 24d | 1 | 0.67mi |
| 400 Taylor St NE Washington, DC | 2.0 | 1.0–1.5 | 955 | $2,008 | $2.10 | 1d | 10 | 0.72mi |
| 1039 Evarts St NE Washington, DC | 1.0 | 1.0 | 634 | $1,625 | $2.56 | 12d | 1 | 0.74mi |
| 1530 Rhode Island Ave NE Washington, DC | 1.0 | 1.0 | 633 | $1,595 | $2.52 | 1d | 6 | 0.75mi |
| 515 Franklin St NE Unit 3 Washington, DC | 2.0 | 1.0 | 800 | $2,100 | $2.62 | 24d | 1 | 0.78mi |
| 515 Franklin St NE Unit 4 Washington, DC | 1.0 | 1.0 | 800 | $1,800 | $2.25 | 24d | 1 | 0.78mi |
| 2607 Reed St NE Washington, DC | 2.0 | 1.0–2.0 | 704 | $2,936 | $4.17 | 2d | 19 | 0.78mi |
| 1617 Rhode Island Ave NE Unit 501 Washington, DC | 2.0 | 2.0 | 724 | $2,400 | $3.31 | 24d | 1 | 0.80mi |
| 1511 Franklin St NE Washington, DC | 1.0 | 1.0 | 561 | $1,450 | $2.58 | 7d | 7 | 0.80mi |
| 1820 Irving St NE Washington, DC | 2.0 | 1.0 | 800 | $1,795 | $2.24 | 3d | 1 | 0.80mi |
| 1400 Montana Ave NE Washington, DC | 1.0 | 1.0 | 593 | $2,120 | $3.57 | 3d | 15 | 0.81mi |
| 1311 Rhode Island Ave NE Unit 6 Washington, DC | 1.0 | 1.0 | 600 | $2,395 | $3.99 | 12d | 1 | 0.81mi |
| 1016 Rhode Island Ave NE Washington, DC | 1.0 | 1.0 | 532 | $2,199 | $4.13 | 24d | 1 | 0.82mi |
| 1615 Franklin St NE Washington, DC | 1.0 | 1.0 | 491 | $1,450 | $2.95 | 3d | 10 | 0.82mi |
| 1904 Irving St NE Unit 201 Washington, DC | 1.0 | 1.0 | 550 | $1,395 | $2.54 | 24d | 1 | 0.83mi |
| 1904 Irving St NE Unit 102 Washington, DC | 1.0 | 1.0 | 585 | $1,395 | $2.38 | 2d | 1 | 0.83mi |
| 806 Channing Pl NE Washington, DC | 2.0 | 1.0–2.0 | 726 | $2,763 | $3.81 | 1d | 28 | 0.83mi |
| 1228 Brentwood Rd NE #1 Washington, DC | 2.0 | 2.0 | 854 | $2,095 | $2.45 | 24d | 1 | 0.85mi |
| 315 Franklin St NE Washington, DC | 1.0 | 1.0 | 900 | $1,485 | $1.65 | 2d | 4 | 0.87mi |
| 2641 4th St NE Washington, DC | 3.0 | 2.0 | 1000 | $1,848 | $1.85 | 24d | 1 | 0.89mi |
| 4407 2nd St NE Washington, DC | 1.0 | 1.0 | 703 | $1,425 | $2.03 | 22d | 1 | 0.90mi |
| 4407 2nd St NE Washington, DC | 1.0 | 1.0 | 703 | $1,425 | $2.03 | 24d | 1 | 0.90mi |
| 2615 4th St NE Unit B1 Washington, DC | 1.0 | 1.0 | 661 | $1,800 | $2.72 | 20d | 1 | 0.91mi |
HOA detail condo
- Monthly dues
- $461 · $5,532/yr
- Assessments
- None detected in remarks — confirm with the listing agent.
Listing history 11 events
-
2026-05-15price $224,900
-
2026-03-26price $237,500
-
2026-03-05price $250,000
-
2026-02-20$260,000 Active
-
2025-01-31historical
-
2024-10-23price $352,000
-
2024-10-23status Active
-
2024-08-06status Pending
-
2024-07-18price $239,000
-
2024-05-01$274,000 Active
-
1986-07-29soldstatus $66,500
ⓘ Source: listings_history table (triggers on properties + properties_extension) + one-shot
backfill from property_details.listing_events for pre-trigger history.
Tax reassessment forecast DC · Partial reset (capped growth)
- Current annual tax
- $2,541 · $212/mo
- Projected year-2 tax
- $2,541 · $212/mo
- Expected delta
- $0/yr ($0/mo · 0.0%)
ⓘ Screening estimate from a state-policy table — verify with the county assessor before closing.
Climate risk First Street
- Flood 1/10 Low FEMA zone X (unshaded) · 0% chance over 30 yrs
- Wildfire 1/10 Low
- Heat 7/10 Severe 7 d/yr ≥106°F today · 15 d/yr by 30 yrs out
- Wind 4/10 Moderate 16% chance of damaging wind over 30 yrs
- Air quality 4/10 Moderate 4 unhealthy d/yr today · 5 by 30 yrs out
Nearby sold comps map
Loading sold comps map…
Walkable amenities ~0.75 mi
Loading nearby amenities…
Taxation est. · year 1
- Rental income
- $28,645
- − Mortgage interest
- −$12,598
- − Property taxes
- −$2,541
- − Insurance
- −$1,124
- − Repairs & maintenance
- −$2,292
- − Management
- −$2,292
- − HOA
- −$5,532
- − Depreciation
- −$6,543
- Taxable loss
- −$4,276
- Est. tax savings @ 24.0%
- +$1,026
- After-tax cash flow
- $306/yr
For passive investors: Depreciation is non-cash, so a rental often shows a tax loss while cash-flowing — sheltering income. Rental losses are passive: they offset passive income freely, and up to $25,000/yr can offset ordinary (W-2) income if you actively participate and your MAGI is under $100k (phasing out to $0 by $150k); unused losses carry forward. On sale, claimed depreciation is recaptured at up to 25%, and gains may owe capital-gains tax (a 1031 exchange can defer both). Figures are a year-1 estimate at your 24.0% rate — not tax advice; consult a CPA.
Schools (NCES district)
- District
- District Of Columbia Public Schools
- NCES district ID
- 1100030
- Math proficiency
- 33% ▲ 3.00%
- Reading proficiency
- 40% ▲ 5.00%
- Median HH income
- $67,671
- Composite
- 35.84/100
- National rank
- #9606
- State rank
- #8 of 32 in DC
Livability — Washington
- Score
- 73/100
- State rank
- #1
- US rank
- #5327
Category grades
Schools grade is shown separately in the Schools card above.
Census & demographics
- Census place
- Washington, DC
- County
- District of Columbia · 671,873 people
- City population
- 671,873
- Metro
- Washington-Arlington-Alexandria, DC-VA-MD-WV
- Population (ZIP)
- 21,208
- Household income
- $106,300
- Rent vs Own
- Severe rent burden
- 963.0
Population outlook (District of Columbia County) Hauer SSP2
- Today (2025)
- 821,926 people
- By 2030
- 899,517 · +9.4%
- By 2040
- 1,061,162 · +29.1%
- By 2050
- 1,231,493 · +49.8%
- By 2075
- 1,603,312 · +95.1%
- By 2100
- 1,847,141 · +124.7%
Race, ethnicity, and origin ACS 2023
- Neighborhood character
- Diverse neighborhood (Simpson 0.62)
- Race & ethnicity
- Black 54% White 28% Hispanic / Latino 11% Two or more races 7% Asian 5%
- Hispanic origin (detail)
- Mexican 2%
- Common ancestry
- Romanian 2% Lithuanian 1% Slovak 1%
- Foreign-born
- 16% · Canada, South Korea, Jamaica
- Languages at home
- 79% English-only · Spanish 9% Other Indo-European 2% French/Haitian/Cajun 1%
Political lean MEDSL · District of Columbia
- 2024 margin
- Solid D (+86.1) · D 91.2% · R 5.1% · Other 3.8%
- 2008→2024 swing
- +0.1pp no change · 2008: 85.9pp · 2024: 86.1pp
- All cycles
- 2024: D+86.1 2020: D+86.8 2016: D+88.7 2012: D+84.2 2008: D+85.9
Not yet ingested
- Civics
- —
Market trends
- HPI YoY
- ▼ -528.98%
- Current HPI
- 359.974
- Rent YoY
- ▲ 3.48%
- Metro
- Washington-Arlington-Alexandria, DC-VA-MD-WV
- State GDP YoY
- ▲ 1.33%
- F500 in state
- 6
Industry mix (Fortune 500 HQ in DC)
| Industry | F500 HQs | Revenue |
|---|---|---|
| Financial Services | 1 | $153B |
|
||
| Life Sciences / Industrials | 1 | $25B |
|
||
| Industrial Machinery | 1 | $8B |
|
||
Price history
+238.2% since first listed11 events — show timeline
- 2026-05-15 Price Changed $224,900 BRIGHT MLS
- 2026-03-26 Price Changed $237,500 BRIGHT MLS
- 2026-03-05 Price Changed $250,000 BRIGHT MLS
- 2026-02-20 Listed $260,000 BRIGHT MLS
- 2025-01-31 Listing Removed — BRIGHT MLS
- 2024-10-23 Price Changed $352,000 BRIGHT MLS
- 2024-10-23 Relisted — BRIGHT MLS
- 2024-08-06 Pending — BRIGHT MLS
- 2024-07-18 Price Changed $239,000 BRIGHT MLS
- 2024-05-01 Listed $274,000 BRIGHT MLS
- 1986-07-29 Sold (Public Records) $66,500 Public Records
Property tax history
+23.8%/yrLatest (2025): $2,541 · -6.1% YoY. Source: county tax records.
Cash-flow waterfall
monthlySold comps — $/sqft
last 12 mo · ≤1 miLoading sold comps…