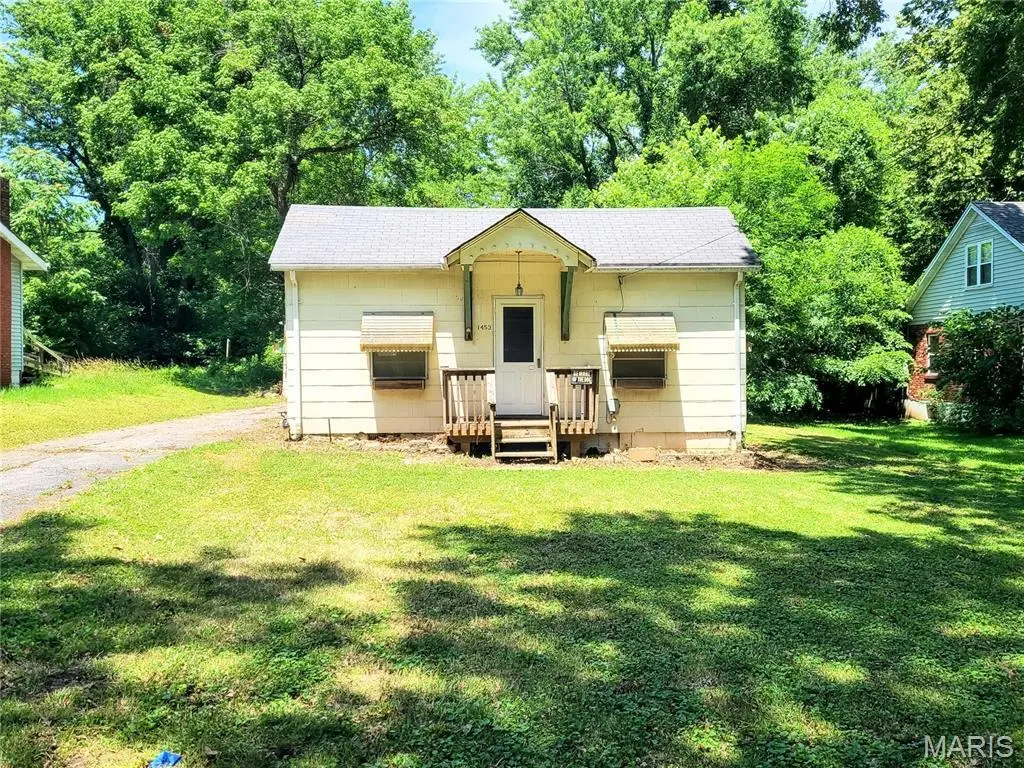
1453 Twillman Ave · Spanish Lake, MO
Flood risk 1/10 · Minimal
- FEMA flood zone
- X (unshaded)
- Chance of flooding over 30 yrs
- 0.0%
- Est. flood insurance / yr
- $507 – $1,088
Fire risk 1/10 · Minimal
- Est. fire insurance / yr
- $1,054 – $1,958
Heat risk 5/10 · Moderate
- Hot days now (above 107°F)
- 7 days/yr
- Hot days in 30 yrs
- 21 days/yr
Wind risk 2/10 · Minimal
- Chance of severe wind over 30 yrs
- 1.0%
Air-quality risk 4/10 · Minor
- Unhealthy air days now
- 4 days/yr
- Unhealthy air days in 30 yrs
- 5 days/yr
Risk factors via First Street. Map © Google.
Why this score? — see what drove the B- grade
The composite is a weighted blend of 9 inputs, each scored 0–100. Each bar is that input's sub-score; the figure is the points it added to the 100-point composite (weight × sub-score).
- Cash flow +30.0/30.0
- 1% rule +10.0/10.0
- DSCR +10.0/10.0
- ARV discount +7.5/15.0
- Livability +2.6/5.0
- Condition / age +2.5/5.0
- Rent growth +2.1/5.0
- Schools +1.7/10.0
- Appreciation +0.0/10.0
$55,000
🖨 Deal sheet 📄 Offer letter ✓ Due diligence
Listing remarks
BUNGALOW home, 1 bedroom, 1 bath, living room, kitchen and dining room sitting on a half acre lot. Semi private street. Deep lot with a 1 car garage. .5 acres to housed your business items. Great for a small/midsize business owner to possibly operate in lawn care, car repair, roofing, Airbnb etc. . Deep driveway will hold up to 4 cars. Property sold as-is. Seller will not make any repairs nor pay for any inspections. No inspection contingency. Preview property prior to making an offer. Mainly for investors to rehab. Unincorporated area!!
Key facts
- Semi private street
- Deep lot
- 1 car garage
Tags
Property features AI
Finance
- Other: Property listed as residential single family; Above-grade living area reported from public records
Exterior
- Parking: Detached or attached garage with space for 1 car (approx. 280 sq ft)
- Utilities: Public water; Public sewer (sewer connected); Electric service by Ameren
- Home design: Single family residence; One level
- Construction: Asbestos construction material; Asbestos shingle roof; Built data from public records
- Exterior features: Awning(s); Back yard; Level lot; Asphalt road access
Interior
- Kitchen: Kitchen located on the main level
- Bedrooms: One bedroom on the main level
- Bathrooms: One full bathroom on the main level
- Heating & cooling: Natural gas heating; Other heating type; No cooling
- Interior features: Living room; Dining room; Kitchen; Fixer condition
- Laundry & utility: Laundry area in the kitchen
Neighborhood map
What this means for you Summary
Snapshot
- This is a 1-bed/1.0-bath single-family listed at $55k.
Deal economics
- At list price, monthly cash flow is $381 ($5k/yr) — positive.
- The deal already cash-flows at list — no discount required.
- Meets the 1% rule at list price ($978 rent vs $55k).
- Cap rate 14.6% vs local median 7.9% in Spanish Lake — top-decile yield for the area; either an underpriced asset or a hidden risk that comps aren't pricing in. Stress-test before assuming the spread holds.
Location & tenants
- Location reads 51/100 on livability (#870 in MO) — a working-class tenant base; expect higher turnover. Strengths: cost of living A+, housing A+; Watch: crime F, amenities F, commute F.
- Hazelwood (suburban): math 11% / reading 26% proficiency, ranked #306 of 324 in MO (top 94%) — low school quality limits family demand, transient renter base, plan for 1-2y turnover.
- Zoned schools: Twillman Elem. (math 2% / reading 8%, grade F, #1,072 of 1,115 statewide, top 98%, 326 students, 99% FRL); Hazelwood East High (math 5% / reading 21%, grade F, #495 of 521 statewide, top 95%, 1,264 students, 66% FRL) — zoned schools average 82% FRL vs 53% district-wide (29 pts higher); higher-poverty schools than district average — tighter screening recommended.
- Market conditions: Rents soft (-1.5%/yr); 101 active listings in the ZIP; 4 comparable units currently listed for rent nearby; rentals lingering (median 44d on market — plan ~5-8 weeks vacancy on turnover, expect pricing pressure); 75% of comp listings sitting > 30 days — soft ceiling on asking rent; 920 units permitted in St. Louis County in 2024 (250 in 5+ unit buildings).
Forward outlook
- Local home prices are declining (-3.0%/yr); year-one equity from $380 of loan paydown is wiped out by about $2k of value loss. Plan a longer hold.
- At projected returns (-3.0% appreciation + 0.0% rent growth), your $15k cash investment doubles in ~5 years — after that, you're playing with house money.
Negotiation context
- Only 8 days on market — expect competitive offers; lowballing is unlikely to land.
Risks & watch-outs
- Watch-outs: built in 1928 — expect roof / HVAC / electrical / plumbing capex.
- Climate carrying-cost: extreme-heat days projected 7→21/yr by 2055 (HVAC capex compounding) — expect insurance premiums to compound above CPI over the hold.
Questions for the listing agent
- Built in 1928 — when were the roof, HVAC, electrical panel, plumbing, and water heater last replaced?
- Is there a deadline driving the sale (1031 exchange, divorce, estate, relocation)? That informs how much negotiation room exists.
- Schools are F-rated, which usually means shorter tenancies and higher turnover. Who's the typical renter profile here, and what's been the actual vacancy rate?
- Crime grade is F in this area — have there been break-ins, vandalism, or insurance claims at this property in the last 3 years? What carrier currently insures it and at what premium?
- What's the average days-on-market for RENTAL listings here right now (not sales)? A rising rental-DOM trend means longer vacancies and softer asking-rent achievability than the comps imply.
- What's the recent tenant-quality profile in this submarket — average credit score on applications, eviction rate, late-payment / NSF rate, and stable-employment percentage? A property-management company in the area should have these aggregated.
- How much new for-sale + rental construction is in the pipeline within 1–3 miles? Heavy new supply typically softens prices + rents 12–24 months out; constrained supply supports both.
Investment metrics
- 1% rule
- 1.78% ✓
- Cap rate
- 14.60%
- Cash-on-cash
- 29.68%
- DSCR
- 2.32
- GRM
- 4.7
CMA / ARV
No comps found within radius.
Projected returns pro-forma
-3.0% appreciation · 0.0% rent growth · sell at horizon
- IRR
- 20.7%
- Equity multiple
- 1.81×
- Total profit
- $12,507
- Equity at exit
- $8,201
- IRR
- 26.8%
- Equity multiple
- 3.02×
- Total profit
- $31,146
- Equity at exit
- $4,755
Cash invested: $15,400 (down + closing). Projections, not guarantees.
Landlord ↔ Tenant lean methodology
- Overall (STATE)
- 81 Strongly Landlord-Friendly
- State Missouri
- 81 Strongly Landlord-Friendly · R+10
- County
- — inherits STATE
- City
- — inherits STATE
ZIP-level market 63138
- Home prices YoY
- -31.0%
- Rents YoY
- -1.5%
- Active inventory
- 101
- Price-to-rent
- 4.7×
Monthly cashflow live
- Estimated rent
- $978 medium interval (Pro) →
- Mortgage (P&I)
- −$288
- Tax from tax record
- −$80 /mo · $963/yr
- Insurance
- −$23
- HOA
- −$0
- Vacancy / Maint / Mgmt
- −$205
- Net cashflow
- $381
Break-even live
UW: 25.0% down · 7.5% · 30yr · 1.5% tax · 5.0% vac · 8.0% maint · 8.0% mgmt
Financing live
Cash to close
- Down payment
- $13,750
- Closing costs
- $1,650
- Reserves months
- —
- Total cash needed
- —
Loan-product check · same deal, 3 products live
Conventional
25% down · 7.5% · 30yr
- Down + closing
- —
- Monthly P&I
- —
- Monthly cashflow
- —
- DSCR
- —
- Eligible?
- —
Personal DTI + credit; lowest rate.
DSCR
20% down · 8.5% · 30yr
- Down + closing
- —
- Monthly P&I
- —
- Monthly cashflow
- —
- DSCR
- —
- Eligible?
- —
No personal income docs; deal must DSCR.
Hard money
10% down · 12.0% · 12mo
- Down + closing
- —
- Monthly P&I
- —
- Monthly cashflow
- —
- DSCR
- —
- Eligible?
- —
Short-term bridge; refi at stabilization.
Rent comps 4 comps
| Address | Beds | Baths | Sqft | Rent | $/sqft | DOM | Units | Dist |
|---|---|---|---|---|---|---|---|---|
| 1333 N Garden Dr St. Louis, MO | 2.0 | 1.0 | 626 | $1,100 | $1.76 | 44d | 1 | 0.77mi |
| 1342 N Garden Dr Saint Louis, MO | 2.0 | 1.0 | 626 | $1,100 | $1.76 | 2d | 3 | 0.81mi |
| 1585 Leonaire Ct Unit 1585-87 Leonaire St. Louis, MO | 1.0 | 1.0 | 550 | $750 | $1.36 | 44d | 1 | 1.26mi |
| 1574 Leonaire Ct Unit 1510 St. Louis, MO | 1.0 | 1.0 | 550 | $750 | $1.36 | 44d | 1 | 1.26mi |
Listing history 8 events
-
2026-06-18days on market $55,000 Active 8 DOM
-
2026-06-17days on market $55,000 Active 7 DOM
-
2026-06-16days on market $55,000 Active 6 DOM
-
2026-06-15days on market $55,000 Active 5 DOM
-
2026-06-13days on market $55,000 Active 3 DOM
-
2026-06-13statusdays on market $55,000 Active 2 DOM
-
2026-06-10remarks 545-char remark
-
2026-06-10$55,000 Coming Soon 1 DOM
ⓘ Source: listings_history table (triggers on properties + properties_extension) + one-shot
backfill from property_details.listing_events for pre-trigger history.
Tax reassessment forecast MO · Resets to sale price
- Current annual tax
- $963 · $80/mo
- Projected year-2 tax
- $963 · $80/mo
- Expected delta
- $0/yr ($0/mo · -0.0%)
ⓘ Screening estimate from a state-policy table — verify with the county assessor before closing.
Climate risk First Street
- Flood 1/10 Low FEMA zone X (unshaded) · 0% chance over 30 yrs
- Wildfire 1/10 Low
- Heat 5/10 Major 7 d/yr ≥107°F today · 21 d/yr by 30 yrs out
- Wind 2/10 Low 100% chance of damaging wind over 30 yrs
- Air quality 4/10 Moderate 4 unhealthy d/yr today · 5 by 30 yrs out
Nearby sold comps map
Loading sold comps map…
Walkable amenities ~0.75 mi
Loading nearby amenities…
Taxation est. · year 1
- Rental income
- $11,735
- − Mortgage interest
- −$3,081
- − Property taxes
- −$963
- − Insurance
- −$275
- − Repairs & maintenance
- −$939
- − Management
- −$939
- − Depreciation
- −$1,600
- Taxable income
- $3,938
- Est. tax owed @ 24.0%
- −$945
- After-tax cash flow
- $3,626/yr
For passive investors: Depreciation is non-cash, so a rental often shows a tax loss while cash-flowing — sheltering income. Rental losses are passive: they offset passive income freely, and up to $25,000/yr can offset ordinary (W-2) income if you actively participate and your MAGI is under $100k (phasing out to $0 by $150k); unused losses carry forward. On sale, claimed depreciation is recaptured at up to 25%, and gains may owe capital-gains tax (a 1031 exchange can defer both). Figures are a year-1 estimate at your 24.0% rate — not tax advice; consult a CPA.
Schools (NCES district)
- District
- Hazelwood
- NCES district ID
- 2913830
- Math proficiency
- 11% ▼ -13.00%
- Reading proficiency
- 26% ▼ -6.00%
- Median HH income
- $51,621
- Composite
- 16.77/100
- National rank
- #9156
- State rank
- #306 of 324 in MO
Livability — Spanish Lake
- Score
- 51/100
- State rank
- #870
- US rank
- #25189
Category grades
Schools grade is shown separately in the Schools card above.
Census & demographics
- Census place
- Spanish Lake, MO
- County
- Saint Louis County · 888,823 people
- City population
- 18,233
- Metro
- St. Louis, MO-IL
- Population (ZIP)
- 18,233
- Household income
- $56,096
- Rent vs Own
- Severe rent burden
- 925.0
Population outlook (St. Louis County) Hauer SSP2
- Today (2025)
- 1,025,227 people
- By 2030
- 1,028,023 · +0.3%
- By 2040
- 1,020,940 · -0.4%
- By 2050
- 1,007,280 · -1.8%
- By 2075
- 987,277 · -3.7%
- By 2100
- 921,984 · -10.1%
Race, ethnicity, and origin ACS 2023
- Neighborhood character
- Predominantly Black (81%)
- Race & ethnicity
- Black 81% White 14% Two or more races 4% Hispanic / Latino 1%
- Foreign-born
- 2% · Canada
- Languages at home
- 98% English-only · Spanish 1%
Political lean MEDSL · St. Louis
- 2024 margin
- Strong D (+23.4) · D 60.8% · R 37.4% · Other 1.7%
- 2008→2024 swing
- +3.5pp toward D · 2008: 19.9pp · 2024: 23.4pp
- All cycles
- 2024: D+23.4 2020: D+24.0 2016: D+16.2 2012: D+13.7 2008: D+19.9
Not yet ingested
- Civics
- —
Market trends
- HPI YoY
- ▼ -74.09%
- Current HPI
- 165.2146
- Rent YoY
- ▼ -1.54%
- Metro
- St. Louis, MO-IL
- State GDP YoY
- ▲ 1.84%
- F500 in state
- 20
Industry mix (Fortune 500 HQ in MO)
| Industry | F500 HQs | Revenue |
|---|---|---|
| Healthcare | 1 | $163B |
|
||
| Insurance | 1 | $21B |
|
||
| Industrial Technology | 1 | $17B |
|
||
| Retail | 1 | $16B |
|
||
| Industrial Distribution | 1 | $10B |
|
||
| Utilities | 1 | $9B |
|
||
Price history
+57.6% since first listed3 events — show timeline
- 2026-06-09 Coming Soon $55,000 MARIS as Distributed by MLS Grid
- 2002-07-22 Sold (Public Records) $49,000 Public Records
- 1991-07-03 Sold (Public Records) $34,900 Public Records
Property tax history
+0.4%/yrLatest (2022): $963 · +1.5% YoY. Source: county tax records.
Cash-flow waterfall
monthlySold comps — $/sqft
last 12 mo · ≤1 miLoading sold comps…