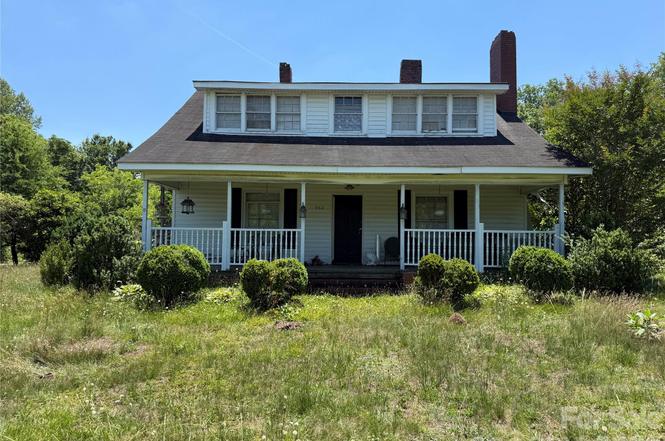
962 Greensboro Street Ext · Lexington, NC
Flood risk 1/10 · Minimal
- FEMA flood zone
- X (unshaded)
- Chance of flooding over 30 yrs
- 0.0%
- Est. flood insurance / yr
- $507 – $1,088
Fire risk 3/10 · Minor
- Est. fire insurance / yr
- $906 – $1,684
Heat risk 5/10 · Moderate
- Hot days now (above 104°F)
- 7 days/yr
- Hot days in 30 yrs
- 17 days/yr
Wind risk 4/10 · Minor
- Chance of severe wind over 30 yrs
- 12.0%
Air-quality risk 2/10 · Minimal
- Unhealthy air days now
- 1 days/yr
- Unhealthy air days in 30 yrs
- 1 days/yr
Risk factors via First Street. Map © Google.
Why this score? — see what drove the D grade
The composite is a weighted blend of 9 inputs, each scored 0–100. Each bar is that input's sub-score; the figure is the points it added to the 100-point composite (weight × sub-score).
- Cash flow +15.4/30.0
- ARV discount +7.5/15.0
- DSCR +4.7/10.0
- Livability +3.6/5.0
- Rent growth +3.3/5.0
- 1% rule +3.0/10.0
- Schools +2.8/10.0
- Condition / age +2.5/5.0
- Appreciation +0.0/10.0
$215,000
🖨 Deal sheet (PDF) 📄 Offer letter ✓ Due diligence
Key facts
- Future redevelopment
- Rental income
- Ra3 land
Tags
Property features AI
Finance
- Other: Zoning: RA3
- HOA & community: No HOA
Exterior
- Parking: Detached garage; Driveway; 4 garage spaces; Main level garage
- Utilities: Water: other (see remarks); Sewer: N/A
- Home design: Single-family residence (residential); Site-built construction; Two levels; Main level garage
- Construction: Vinyl exterior; Basement foundation; Basement present
- Exterior features: Lot includes both dirt and paved road frontage; Publicly maintained road
Interior
- Kitchen: No appliances listed
- Bedrooms: 3 bedrooms on the main level
- Bathrooms: 2 full bathrooms on the main level
- Heating & cooling: Forced air heating; Central air conditioning
- Interior features: Interior entry basement; Fireplace
- Laundry & utility: Laundry details — see remarks
Neighborhood map
What this means for you Summary
Snapshot
- This is a 3-bed/2.0-bath single-family listed at $215k.
Deal economics
- At list price, monthly cash flow is $81 ($977/yr) — positive.
- The deal already cash-flows at list — no discount required.
- To meet the 1% rule (rent ≥ 1% of price), the offer needs to be $171k (20.3% below list).
- Recommended offer: $171k (20.3% below list) — sets the bar for 1% rule.
- Cap rate 6.7% vs local median 3.5% in Lexington — top-decile yield for the area; either an underpriced asset or a hidden risk that comps aren't pricing in. Stress-test before assuming the spread holds.
Location & tenants
- Location reads 72/100 on livability (#89 in NC) — a middle-class / working-renter tenant base. Strengths: commute A+, cost of living A+, health & safety A+; Watch: crime F, amenities D-, employment F.
- Lexington City Schools (suburban): math 32% / reading 38% proficiency, ranked #136 of 178 in NC (top 76%) — families likely to look elsewhere, expect single-tenant / working-renter base with shorter leases; 78% free/reduced lunch — lower-income household profile, screen leases tightly.
- Zoned schools: Pickett Elementary School (math 32% / reading 32%, grade F, #908 of 1,410 statewide, top 67%, 394 students, 99% FRL); Lexington Middle School (math 31% / reading 41%, grade F, #273 of 475 statewide, top 58%, 647 students, 100% FRL); Lexington Senior High School (math 27% / reading 52%, grade F, #393 of 535 statewide, top 75%, 928 students, 99% FRL) — zoned schools average 99% FRL vs 78% district-wide (21 pts higher); higher-poverty schools than district average — tighter screening recommended.
- Market conditions: Rents rising (+3.4%/yr); 362 active listings in the ZIP; 990 units permitted in Davidson County in 2024 (54 in 5+ unit buildings).
- This rent runs 32% of the median local income ($64k/yr) — at the standard rent-burdened threshold; future hikes will face affordability resistance.
Forward outlook
- Local home prices are declining (-3.0%/yr); year-one equity from $1k of loan paydown is wiped out by about $6k of value loss. Plan a longer hold.
- Davidson County population projected to shrink 6% by 2050 — rents likely to lag national; underwrite the cash flow, not the appreciation.
Negotiation context
- Only 4 days on market — expect competitive offers; lowballing is unlikely to land.
- Current owner paid $59k; list at $215k implies a 264% gain — meaningful room to come down on a strong offer.
Risks & watch-outs
- Watch-outs: built in 1915 — expect roof / HVAC / electrical / plumbing capex.
- Climate carrying-cost: extreme-heat days projected 7→17/yr by 2055 (HVAC capex compounding) — expect insurance premiums to compound above CPI over the hold.
Questions for the listing agent
- Built in 1915 — when were the roof, HVAC, electrical panel, plumbing, and water heater last replaced?
- Is there a deadline driving the sale (1031 exchange, divorce, estate, relocation)? That informs how much negotiation room exists.
- Schools are D-rated, which usually means shorter tenancies and higher turnover. Who's the typical renter profile here, and what's been the actual vacancy rate?
- Crime grade is F in this area — have there been break-ins, vandalism, or insurance claims at this property in the last 3 years? What carrier currently insures it and at what premium?
- The area grade is low — what's the realistic commute time and amenity access for the typical tenant pool here? Any planned neighborhood developments (good or bad) we should know about?
- What's the average days-on-market for RENTAL listings here right now (not sales)? A rising rental-DOM trend means longer vacancies and softer asking-rent achievability than the comps imply.
- What's the recent tenant-quality profile in this submarket — average credit score on applications, eviction rate, late-payment / NSF rate, and stable-employment percentage? A property-management company in the area should have these aggregated.
- How much new for-sale + rental construction is in the pipeline within 1–3 miles? Heavy new supply typically softens prices + rents 12–24 months out; constrained supply supports both.
Investment metrics
- 1% rule
- 0.80% ✗
- Cap rate
- 6.75%
- Cash-on-cash
- 1.62%
- DSCR
- 1.07
- GRM
- 10.5
CMA / ARV
No comps found within radius.
Projected returns pro-forma
-3.0% appreciation · 3.37% rent growth · sell at horizon
- IRR
- -13.4%
- Equity multiple
- 0.52×
- Total profit
- $-29,117
- Equity at exit
- $32,057
- IRR
- -4.1%
- Equity multiple
- 0.73×
- Total profit
- $-16,457
- Equity at exit
- $18,589
Cash invested: $60,200 (down + closing). Projections, not guarantees.
Landlord ↔ Tenant lean methodology
- Overall (STATE)
- 85 Strongly Landlord-Friendly
- State North Carolina
- 85 Strongly Landlord-Friendly · R+3
- County
- — inherits STATE
- City
- — inherits STATE
ZIP-level market 27295
- Home prices YoY
- -15.2%
- Rents YoY
- 3.4%
- Active inventory
- 362
- Price-to-rent
- 10.5×
Monthly cashflow live
- Estimated rent
- $1,714 medium interval (Pro) →
- Mortgage (P&I)
- −$1,127
- Tax from tax record
- −$55 /mo · $663/yr
- Insurance
- −$90
- HOA
- −$0
- Vacancy / Maint / Mgmt
- −$360
- Net cashflow
- $81
Break-even live
Sensitivity live
| Price | -10% $203 | -5% $142 | +0% $81 | +5% $21 | +10% $-40 |
|---|---|---|---|---|---|
| Rent | -10% $-54 | -5% $14 | +0% $81 | +5% $149 | +10% $217 |
| Rate | -1.0pp $190 | -0.5pp $136 | base $81 | +0.5pp $26 | +1.0pp $-31 |
UW: 25.0% down · 7.5% · 30yr · 1.5% tax · 5.0% vac · 8.0% maint · 8.0% mgmt
Financing live
Cash to close
- Down payment
- $53,750
- Closing costs
- $6,450
- Reserves months
- —
- Total cash needed
- —
Loan-product check · same deal, 3 products live
Conventional
25% down · 7.5% · 30yr
- Down + closing
- —
- Monthly P&I
- —
- Monthly cashflow
- —
- DSCR
- —
- Eligible?
- —
Personal DTI + credit; lowest rate.
DSCR
20% down · 8.5% · 30yr
- Down + closing
- —
- Monthly P&I
- —
- Monthly cashflow
- —
- DSCR
- —
- Eligible?
- —
No personal income docs; deal must DSCR.
Hard money
10% down · 12.0% · 12mo
- Down + closing
- —
- Monthly P&I
- —
- Monthly cashflow
- —
- DSCR
- —
- Eligible?
- —
Short-term bridge; refi at stabilization.
Listing history 3 events
-
2026-06-21days on market $215,000 Active 4 DOM
-
2026-06-18status $215,000 Active 1 DOM
-
2026-06-17$215,000 Coming Soon 1 DOM
ⓘ Source: listings_history table (triggers on properties + properties_extension) + one-shot
backfill from property_details.listing_events for pre-trigger history.
Tax reassessment forecast NC · Resets to sale price
- Current annual tax
- $663 · $55/mo
- Projected year-2 tax
- $1,763 · $147/mo
- Expected delta
- +$1,100/yr (+$92/mo · 165.7%)
ⓘ Screening estimate from a state-policy table — verify with the county assessor before closing.
Climate risk First Street
- Flood 1/10 Low FEMA zone X (unshaded) · 0% chance over 30 yrs
- Wildfire 3/10 Moderate
- Heat 5/10 Major 7 d/yr ≥104°F today · 17 d/yr by 30 yrs out
- Wind 4/10 Moderate 12% chance of damaging wind over 30 yrs
- Air quality 2/10 Low 1 unhealthy d/yr today · 1 by 30 yrs out
Nearby sold comps map
Loading sold comps map…
Walkable amenities ~0.75 mi
Loading nearby amenities…
Taxation est. · year 1
- Rental income
- $20,564
- − Mortgage interest
- −$12,043
- − Property taxes
- −$663
- − Insurance
- −$1,075
- − Repairs & maintenance
- −$1,645
- − Management
- −$1,645
- − Depreciation
- −$6,255
- Taxable loss
- −$2,763
- Est. tax savings @ 24.0%
- +$663
- After-tax cash flow
- $1,640/yr
For passive investors: Depreciation is non-cash, so a rental often shows a tax loss while cash-flowing — sheltering income. Rental losses are passive: they offset passive income freely, and up to $25,000/yr can offset ordinary (W-2) income if you actively participate and your MAGI is under $100k (phasing out to $0 by $150k); unused losses carry forward. On sale, claimed depreciation is recaptured at up to 25%, and gains may owe capital-gains tax (a 1031 exchange can defer both). Figures are a year-1 estimate at your 24.0% rate — not tax advice; consult a CPA.
Schools (NCES district)
- District
- Lexington City Schools
- NCES district ID
- 3702640
- Math proficiency
- 32% ▲ 3.00%
- Reading proficiency
- 38% ▲ 6.00%
- Median HH income
- $27,758
- Composite
- 28.2/100
- National rank
- #6807
- State rank
- #136 of 178 in NC
Livability — Lexington
- Score
- 72/100
- State rank
- #89
- US rank
- #6051
Category grades
Schools grade is shown separately in the Schools card above.
Census & demographics
- County
- Davidson County · 129,088 people
- City population
- 79,578
- Metro
- Winston-Salem, NC
- Population (ZIP)
- 39,267
- Household income
- $63,961
- Rent vs Own
- Severe rent burden
- 733.0
Population outlook (Davidson County) Hauer SSP2
- Today (2025)
- 167,156 people
- By 2030
- 167,216 · +0.0%
- By 2040
- 164,524 · -1.6%
- By 2050
- 157,229 · -5.9%
- By 2075
- 138,084 · -17.4%
- By 2100
- 112,729 · -32.6%
Race, ethnicity, and origin ACS 2023
- Neighborhood character
- Predominantly White (82%)
- Race & ethnicity
- White 82% Hispanic / Latino 6% Black 6% Two or more races 4% Asian 3%
- Hispanic origin (detail)
- Mexican 4%
- Common ancestry
- Serbian 2% Slovak 2% Italian 2%
- Foreign-born
- 5% · Canada, Jamaica
- Languages at home
- 93% English-only · Spanish 5% Other Asian/Pacific 1%
Political lean MEDSL · Davidson
- 2024 margin
- Solid R (+47.1) · D 25.9% · R 73.0% · Other 1.1%
- 2008→2024 swing
- -13.5pp toward R · 2008: -33.5pp · 2024: -47.1pp
- All cycles
- 2024: R+47.1 2020: R+47.5 2016: R+49.4 2012: R+40.9 2008: R+33.5
Not yet ingested
- Civics
- —
Market trends
- HPI YoY
- ▼ -46.39%
- Current HPI
- 258.6557
- Rent YoY
- ▲ 3.37%
- Metro
- Winston-Salem, NC
- State GDP YoY
- ▲ 3.28%
- F500 in state
- 26
Industry mix (Fortune 500 HQ in NC)
| Industry | F500 HQs | Revenue |
|---|---|---|
| Financial Services | 2 | $213B |
|
||
| Retail | 2 | $95B |
|
||
| Industrial Conglomerate | 1 | $38B |
|
||
| Metals / Steel | 1 | $35B |
|
||
| Utilities | 1 | $30B |
|
||
| Industrial Machinery | 1 | $19B |
|
||
Price history
+264.4% since first listed2 events — show timeline
- 2026-06-17 Coming Soon $215,000 CANOPYMLS as Distributed by MLS Grid
- 1990-03-01 Sold (Public Records) $59,000 Public Records
Property tax history
-1.6%/yrLatest (2025): $663 · +0.0% YoY. Source: county tax records.
Cash-flow waterfall
monthlySold comps — $/sqft
last 12 mo · ≤1 miLoading sold comps…