 Multi-family
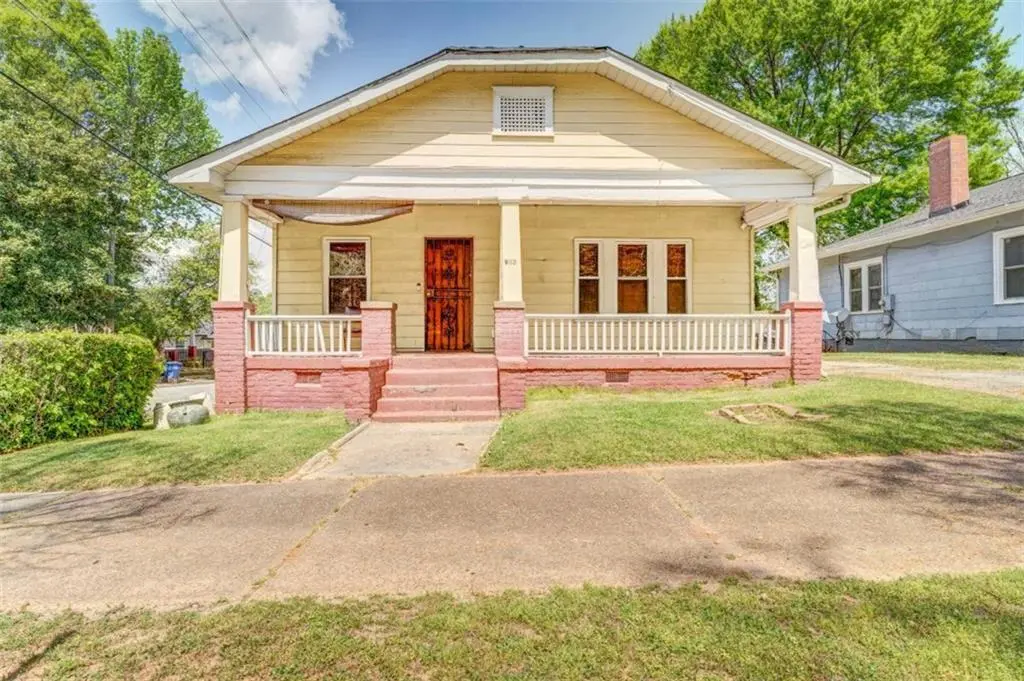
943 Washington Pl SW · Atlanta, GA
Flood risk 1/10 · Minimal
- FEMA flood zone
- X (unshaded)
- Chance of flooding over 30 yrs
- 0.0%
- Est. flood insurance / yr
- $473 – $860
Fire risk 1/10 · Minimal
- Est. fire insurance / yr
- $963 – $1,789
Heat risk 5/10 · Moderate
- Hot days now (above 103°F)
- 7 days/yr
- Hot days in 30 yrs
- 18 days/yr
Wind risk 4/10 · Minor
- Chance of severe wind over 30 yrs
- 22.0%
Air-quality risk 4/10 · Minor
- Unhealthy air days now
- 5 days/yr
- Unhealthy air days in 30 yrs
- 7 days/yr
Risk factors via First Street. Map © Google.
Why this score? — see what drove the C- grade
The composite is a weighted blend of 9 inputs, each scored 0–100. Each bar is that input's sub-score; the figure is the points it added to the 100-point composite (weight × sub-score).
- Cash flow +15.7/30.0
- ARV discount +15.0/15.0
- DSCR +4.8/10.0
- Livability +4.2/5.0
- 1% rule +3.2/10.0
- Rent growth +3.1/5.0
- Schools +2.7/10.0
- Condition / age +2.5/5.0
- Appreciation +0.0/10.0
$290,000
🖨 Deal sheet 📄 Offer letter ✓ Due diligence
Multi-family units
County records classify this as Multi-Family (2-4 Unit). Listing-text estimate: 1 unit. estimate disagrees with records
Listing remarks MLS
Two homes. One lot. One smart purchase. 943 Washington Place SW is not your average listing. This property delivers two completely separate living spaces under one roof: a 2 bedroom, 1 bathroom main home and a private rear 1 bedroom, 1 bathroom secondary unit - each with its own exterior entrance and living area, with no interior connection between them. Two distinct homes. One deed. Listed in tax records as a duplex. Combined: 3 bedrooms, 2 bathrooms, 1,770 square feet. This is the setup that house-hackers, investors, and multi-generational families have been searching for. Live in the main home and let the rear unit generate income potential that offsets your mortgage. Lease both sides and capitalize on Atlanta's rental demand. Or keep both spaces for family - parents, adult children, or a caretaker - with the privacy and independence that separate exterior entrances provide. The location delivers. Minutes from Mercedes-Benz Stadium, State Farm Arena, the Lee + White District, downtown Atlanta, the Beltline, MARTA, and major interstates. Walkable to schools and surrounded by new development, local restaurants, and entertainment. Washington Place is a street that has already shown what this neighborhood can produce - and this property is priced well below that ceiling. Bring your vision. The potential here is in the structure, the location, and the numbers.
Key facts
- Income potential
- Walkable to schools
- Exterior entrance
Tags
Neighborhood map
What this means for you Summary
Snapshot
- This is a 3-bed/2.0-bath multifamily listed at $290k.
Deal economics
- At list price, monthly cash flow is $129 ($2k/yr) — positive.
- The deal already cash-flows at list — no discount required.
- To meet the 1% rule (rent ≥ 1% of price), the offer needs to be $239k (17.6% below list).
- Recommended offer: $239k (17.6% below list) — sets the bar for 1% rule.
- Cap rate 6.8% vs local median 3.1% in Atlanta — top-decile yield for the area; either an underpriced asset or a hidden risk that comps aren't pricing in. Stress-test before assuming the spread holds.
Location & tenants
- Location reads 83/100 on livability (#6 in GA, #919 nationally) — a professional / high-income tenant draw. Strengths: amenities A+, commute A+, housing A+; Watch: schools C-, cost of living C-.
- Atlanta Public Schools (urban): math 28% / reading 35% proficiency, ranked #80 of 174 in GA (top 46%) — families likely to look elsewhere, expect single-tenant / working-renter base with shorter leases; 71% free/reduced lunch — lower-income household profile, screen leases tightly.
- Market conditions: Rents rising (+2.5%/yr); 293 active listings in the ZIP; 40 comparable units currently listed for rent nearby; rentals at typical pace (median 25d on market — plan ~3-4 weeks tenant-placement turnaround); lower-income renter base — watch delinquency; 11,565 units permitted in Fulton County in 2024 (8,159 in 5+ unit buildings).
- At $2,390/mo this rent would consume 68% of the median local household income ($42k/yr) (locally 1293% of renters already pay >50% of income on rent) — very limited rent-growth headroom before tenants either downsize or default.
Forward outlook
- Local home prices are declining (-3.0%/yr); year-one equity from $2k of loan paydown is wiped out by about $9k of value loss. Plan a longer hold.
- Fulton County population projected at +38% by 2050 — long-run rental-demand tailwind backs the buy-and-hold thesis.
Negotiation context
- It's been on market 76 days — a 6% lower offer ($273k) is reasonable based on typical stale-listing flexibility.
- 3 sale attempts with the ask held roughly flat each time — persistent listings suggest the price (not the market) is what's stuck; bring a comps-based counter.
- Current owner paid $40k; list at $290k implies a 625% gain — meaningful room to come down on a strong offer.
Risks & watch-outs
- Watch-outs: built in 1926 — expect roof / HVAC / electrical / plumbing capex.
- Climate carrying-cost: extreme-heat days projected 7→18/yr by 2055 (HVAC capex compounding) — expect insurance premiums to compound above CPI over the hold.
Questions for the listing agent
- It's been on market 76 days. Have you received any prior offers? Is the seller open to a 18% concession, seller financing, or rate buy-down credit?
- Built in 1926 — when were the roof, HVAC, electrical panel, plumbing, and water heater last replaced?
- Why hasn't it sold? Are there any deal-killer items the seller is aware of (foundation, flood, title, zoning, code violations)?
- Is there a deadline driving the sale (1031 exchange, divorce, estate, relocation)? That informs how much negotiation room exists.
- What's the average days-on-market for RENTAL listings here right now (not sales)? A rising rental-DOM trend means longer vacancies and softer asking-rent achievability than the comps imply.
- What's the recent tenant-quality profile in this submarket — average credit score on applications, eviction rate, late-payment / NSF rate, and stable-employment percentage? A property-management company in the area should have these aggregated.
- How much new apartment / multifamily construction is in the pipeline within 1–3 miles? Heavy new supply (>2% of stock underway) typically softens rents 12–24 months out; light construction supports rent growth.
Investment metrics
- 1% rule
- 0.82% ✗
- Cap rate
- 6.83%
- Cash-on-cash
- 1.90%
- DSCR
- 1.08
- GRM
- 10.1
CMA / ARV
- ARV (median comp)
- $370,998
- List price
- $290,000
- Delta
- -21.83%
- Verdict
- UNDERPRICED
- Comps
- 20 within 1.0 mi
Projected returns pro-forma
-3.0% appreciation · 2.53% rent growth · sell at horizon
- IRR
- -13.8%
- Equity multiple
- 0.51×
- Total profit
- $-40,040
- Equity at exit
- $43,240
- IRR
- -5.7%
- Equity multiple
- 0.64×
- Total profit
- $-29,356
- Equity at exit
- $25,074
Cash invested: $81,200 (down + closing). Projections, not guarantees.
Landlord ↔ Tenant lean methodology
- Overall (STATE)
- 90 Strongly Landlord-Friendly
- State Georgia
- 90 Strongly Landlord-Friendly · R+3
- County
- — inherits STATE
- City
- — inherits STATE
ZIP-level market 30314
- Home prices YoY
- -22.9%
- Rents YoY
- 2.5%
- Active inventory
- 293
- Price-to-rent
- 10.1×
Monthly cashflow live
- Estimated rent
- $2,390 high interval (Pro) →
- Mortgage (P&I)
- −$1,521
- Tax from tax record
- −$118 /mo · $1,416/yr
- Insurance
- −$121
- HOA
- −$0
- Vacancy / Maint / Mgmt
- −$502
- Net cashflow
- $129
Break-even live
UW: 25.0% down · 7.5% · 30yr · 1.5% tax · 5.0% vac · 8.0% maint · 8.0% mgmt
Financing live
Cash to close
- Down payment
- $72,500
- Closing costs
- $8,700
- Reserves months
- —
- Total cash needed
- —
Loan-product check · same deal, 3 products live
Conventional
25% down · 7.5% · 30yr
- Down + closing
- —
- Monthly P&I
- —
- Monthly cashflow
- —
- DSCR
- —
- Eligible?
- —
Personal DTI + credit; lowest rate.
DSCR
20% down · 8.5% · 30yr
- Down + closing
- —
- Monthly P&I
- —
- Monthly cashflow
- —
- DSCR
- —
- Eligible?
- —
No personal income docs; deal must DSCR.
Hard money
10% down · 12.0% · 12mo
- Down + closing
- —
- Monthly P&I
- —
- Monthly cashflow
- —
- DSCR
- —
- Eligible?
- —
Short-term bridge; refi at stabilization.
Rent comps 40 comps
| Address | Beds | Baths | Sqft | Rent | $/sqft | DOM | Units | Dist |
|---|---|---|---|---|---|---|---|---|
| 884 T P Burruss SR Dr SW Atlanta, GA | 3.0 | 2.0 | 1366 | $2,299 | $1.68 | 24d | 1 | 0.15mi |
| 15 Ollie St NW Atlanta, GA | 3.0 | 2.5 | 1594 | $3,150 | $1.98 | 24d | 1 | 0.15mi |
| 1000 Palmetto Ave SW Atlanta, GA | 3.0 | 2.0 | 1566 | $1,925 | $1.23 | 24d | 1 | 0.18mi |
| 954 Parsons St SW Atlanta, GA | 4.0 | 3.5 | 1376 | $2,800 | $2.03 | 22d | 1 | 0.21mi |
| 740 Liberty Commons Dr NW #1101 Atlanta, GA | 3.0 | 3.5 | 1890 | $2,600 | $1.38 | 24d | 1 | 0.22mi |
| 1004 Desoto St NW Atlanta, GA | 3.0 | 2.0 | 1550 | $1,995 | $1.29 | 24d | 1 | 0.24mi |
| 152 Joseph Echols Lowery Blvd SW Atlanta, GA | 4.0 | 3.0 | 1822 | $4,000 | $2.20 | 24d | 1 | 0.25mi |
| 60 Paschal Blvd NW Atlanta, GA | 1.0–3.0 | 1.0–2.5 | 945 | $1,625 | $1.72 | 24d | 25 | 0.31mi |
| 155 Rosser St SW Atlanta, GA | 3.0 | 2.0 | 1500 | $2,073 | $1.38 | 24d | 1 | 0.40mi |
| 1005 Westmoor Dr NW Unit A Atlanta, GA | 4.0 | 2.0 | 1348 | $1,695 | $1.26 | 24d | 1 | 0.41mi |
| 1064 Westmoor Dr NW Atlanta, GA | 3.0 | 3.0 | 1770 | $2,300 | $1.30 | 24d | 1 | 0.43mi |
| 272 Joseph E Lowery Blvd NW Atlanta, GA | 3.0 | 1.0 | 1230 | $1,800 | $1.46 | 24d | 1 | 0.58mi |
| 221 Stafford St NW Atlanta, GA | 3.0 | 2.0 | 2293 | $2,400 | $1.05 | 24d | 1 | 0.59mi |
| 220 Napoleon Dr SW Atlanta, GA | 4.0 | 3.0 | 2500 | $3,199 | $1.28 | 11d | 1 | 0.60mi |
| 891 Rock St NW Atlanta, GA | 2.0–3.0 | 2.0 | 1104 | $1,491 | $1.35 | 24d | 4 | 0.61mi |
| 1181 Westview Dr SW Atlanta, GA | 4.0 | 2.0 | 1392 | $2,400 | $1.72 | 24d | 1 | 0.62mi |
| 120 Burbank Dr NW Atlanta, GA | 3.0 | 2.0 | 1331 | $1,795 | $1.35 | 24d | 1 | 0.68mi |
| 167 Rockmart Dr SW Atlanta, GA | 4.0 | 3.5 | 2347 | $3,033 | $1.29 | 24d | 1 | 0.69mi |
| 1332 Akridge St NW Atlanta, GA | 3.0 | 2.0 | 1400 | $1,775 | $1.27 | 24d | 1 | 0.78mi |
| 29 Chappell Rd NW Atlanta, GA | 3.0 | 2.0 | 1670 | $1,953 | $1.17 | 22d | 1 | 0.82mi |
| 1380 Mozley Pl SW Atlanta, GA | 3.0 | 2.0 | 1941 | $1,400 | $0.72 | 7d | 1 | 0.83mi |
| 679 Jones Ave NW Atlanta, GA | 3.0 | 2.0 | 1350 | $2,195 | $1.63 | 24d | 1 | 0.90mi |
| 455 Joseph E Lowery Blvd NW Atlanta, GA | 3.0 | 2.5 | 1890 | $1,950 | $1.03 | 12d | 1 | 0.92mi |
| 23 Larkin Pl SW Atlanta, GA | 1.0–2.0 | 1.0–2.0 | 1011 | $2,129 | $2.10 | 1d | 14 | 0.96mi |
| 438 Griffin St NW Atlanta, GA | 4.0 | 3.0 | 2426 | $2,750 | $1.13 | 4d | 1 | 0.97mi |
| 396 Elm St NW Atlanta, GA | 3.0 | 2.0 | 1792 | $2,100 | $1.17 | 24d | 1 | 0.97mi |
| 415 Hopkins St SW Atlanta, GA | 3.0 | 1.0 | 2550 | $2,000 | $0.78 | 5d | 1 | 0.98mi |
| 436 Markham St SW Atlanta, GA | 3.0 | 3.0 | 2010 | $4,000 | $1.99 | 24d | 1 | 0.99mi |
| 434 Markham St SW Atlanta, GA | 3.0 | 3.0 | 2010 | $3,975 | $1.98 | 24d | 1 | 1.00mi |
| 238 Walker St SW Atlanta, GA | 1.0–2.0 | 1.0–2.5 | 1550 | $2,685 | $1.73 | 14d | 2 | 1.03mi |
| 1265 Oak St SW Atlanta, GA | 4.0 | 3.0 | 1821 | $3,300 | $1.81 | 24d | 1 | 1.10mi |
| 530 James P Brawley Dr NW Atlanta, GA | 2.0 | 2.0 | 1600 | $1,375 | $0.86 | 24d | 1 | 1.10mi |
| 539 Paines Ave NW Apt 1 Atlanta, GA | 2.0 | 1.0 | 2520 | $1,450 | $0.58 | 24d | 1 | 1.10mi |
| 539 Paines Ave NW Unit 3 Atlanta, GA | 2.0 | 1.0 | 2520 | $1,550 | $0.62 | 24d | 1 | 1.10mi |
| 370 Northside Dr NW Atlanta, GA | 1.0–3.0 | 1.0–2.0 | 981 | $2,025 | $2.06 | 1d | 28 | 1.11mi |
| 306 Fair St SW Atlanta, GA | 3.0 | 3.5 | 2221 | $3,400 | $1.53 | 18d | 1 | 1.12mi |
| 66 Holly Rd NW Atlanta, GA | 3.0 | 2.5 | 1632 | $2,228 | $1.37 | 2d | 1 | 1.12mi |
| 1448 Rome Dr NW Unit 1448 Atlanta, GA | 3.0 | 2.5 | 1400 | $2,300 | $1.64 | 12d | 1 | 1.12mi |
| 99 Centennial Olympic Park Dr Atlanta, GA | 2.0 | 1.0–2.0 | 851 | $2,552 | $3.00 | 24d | 23 | 1.13mi |
| 99 Centennial Olympic Park Dr Atlanta, GA | 2.0 | 1.0–2.0 | 929 | $2,451 | $2.64 | 1d | 15 | 1.13mi |
Listing history 22 events
-
2026-06-18days on market $290,000 Active 76 DOM
-
2026-06-17days on market $290,000 Active 75 DOM
-
2026-06-16days on market $290,000 Active 74 DOM
-
2026-06-15days on market $290,000 Active 73 DOM
-
2026-06-13days on market $290,000 Active 71 DOM
-
2026-06-13days on market $290,000 Active 70 DOM
-
2026-06-09days on market $290,000 Active 67 DOM
-
2026-06-08days on market $290,000 Active 66 DOM
-
2026-06-07days on market $290,000 Active 65 DOM
-
2026-06-04days on market $290,000 Active 62 DOM
-
2026-06-03days on market $290,000 Active 61 DOM
-
2026-06-02days on market $290,000 Active 60 DOM
-
2026-06-01days on market $290,000 Active 59 DOM
-
2026-05-31days on market $290,000 Active 58 DOM
-
2026-04-03$290,000 New 1385-char remark
Show marketing remark (1409 chars)
Two homes. One lot. One smart purchase. 943 Washington Place SW is not your average listing. This property delivers two completely separate living spaces under one roof: a 2 bedroom, 1 bathroom main home and a private rear 1 bedroom, 1 bathroom secondary unit — each with its own exterior entrance and living area, with no interior connection between them. Two distinct homes. One deed. Listed in tax records as a duplex. Combined: 3 bedrooms, 2 bathrooms, 1,770 square feet. This is the setup that house-hackers, investors, and multi-generational families have been searching for. Live in the main home and let the rear unit generate income potential that offsets your mortgage. Lease both sides and capitalize on Atlanta's rental demand. Or keep both spaces for family — parents, adult children, or a caretaker — with the privacy and independence that separate exterior entrances provide. The location delivers. Minutes from Mercedes-Benz Stadium, State Farm Arena, the Lee + White District, downtown Atlanta, the Beltline, MARTA, and major interstates. Walkable to schools and surrounded by new development, local restaurants, and entertainment. Washington Place is a street that has already shown what this neighborhood can produce — and this property is priced well below that ceiling. Bring your vision. The potential here is in the structure, the location, and the numbers.
-
2026-04-03$290,000 Active 1409-char remark
Show marketing remark (1409 chars)
Two homes. One lot. One smart purchase. 943 Washington Place SW is not your average listing. This property delivers two completely separate living spaces under one roof: a 2 bedroom, 1 bathroom main home and a private rear 1 bedroom, 1 bathroom secondary unit — each with its own exterior entrance and living area, with no interior connection between them. Two distinct homes. One deed. Listed in tax records as a duplex. Combined: 3 bedrooms, 2 bathrooms, 1,770 square feet. This is the setup that house-hackers, investors, and multi-generational families have been searching for. Live in the main home and let the rear unit generate income potential that offsets your mortgage. Lease both sides and capitalize on Atlanta's rental demand. Or keep both spaces for family — parents, adult children, or a caretaker — with the privacy and independence that separate exterior entrances provide. The location delivers. Minutes from Mercedes-Benz Stadium, State Farm Arena, the Lee + White District, downtown Atlanta, the Beltline, MARTA, and major interstates. Walkable to schools and surrounded by new development, local restaurants, and entertainment. Washington Place is a street that has already shown what this neighborhood can produce — and this property is priced well below that ceiling. Bring your vision. The potential here is in the structure, the location, and the numbers.
-
2026-03-16historical
-
2025-12-22price $260,000
-
2025-12-12price $295,000
-
2025-10-23price $319,900
-
2025-10-08$375,000 New
-
1994-04-06soldstatus $40,000
ⓘ Source: listings_history table (triggers on properties + properties_extension) + one-shot
backfill from property_details.listing_events for pre-trigger history.
Tax reassessment forecast GA · Resets to sale price
- Current annual tax
- $1,416 · $118/mo
- Projected year-2 tax
- $2,668 · $222/mo
- Expected delta
- +$1,252/yr (+$104/mo · 88.5%)
ⓘ Screening estimate from a state-policy table — verify with the county assessor before closing.
Climate risk First Street
- Flood 1/10 Low FEMA zone X (unshaded) · 0% chance over 30 yrs
- Wildfire 1/10 Low
- Heat 5/10 Major 7 d/yr ≥103°F today · 18 d/yr by 30 yrs out
- Wind 4/10 Moderate 22% chance of damaging wind over 30 yrs
- Air quality 4/10 Moderate 5 unhealthy d/yr today · 7 by 30 yrs out
Nearby sold comps map
Loading sold comps map…
Walkable amenities ~0.75 mi
Loading nearby amenities…
Taxation est. · year 1
- Rental income
- $28,682
- − Mortgage interest
- −$16,245
- − Property taxes
- −$1,416
- − Insurance
- −$1,450
- − Repairs & maintenance
- −$2,295
- − Management
- −$2,295
- − Depreciation
- −$8,436
- Taxable loss
- −$3,454
- Est. tax savings @ 24.0%
- +$829
- After-tax cash flow
- $2,372/yr
For passive investors: Depreciation is non-cash, so a rental often shows a tax loss while cash-flowing — sheltering income. Rental losses are passive: they offset passive income freely, and up to $25,000/yr can offset ordinary (W-2) income if you actively participate and your MAGI is under $100k (phasing out to $0 by $150k); unused losses carry forward. On sale, claimed depreciation is recaptured at up to 25%, and gains may owe capital-gains tax (a 1031 exchange can defer both). Figures are a year-1 estimate at your 24.0% rate — not tax advice; consult a CPA.
Schools (NCES district)
- District
- Atlanta Public Schools
- NCES district ID
- 1300120
- Math proficiency
- 28% ▼ -6.00%
- Reading proficiency
- 35% ▼ -2.00%
- Median HH income
- $48,306
- Composite
- 27.27/100
- National rank
- #7006
- State rank
- #80 of 174 in GA
Livability — Atlanta
- Score
- 83/100
- State rank
- #6
- US rank
- #919
Category grades
Schools grade is shown separately in the Schools card above.
Census & demographics
- Census place
- Atlanta, GA
- County
- Fulton County · 1,094,430 people
- City population
- 629,525
- Metro
- Atlanta-Sandy Springs-Alpharetta, GA
- Population (ZIP)
- 23,333
- Household income
- $42,089
- Rent vs Own
- Severe rent burden
- 1293.0
Population outlook (Fulton County) Hauer SSP2
- Today (2025)
- 1,203,707 people
- By 2030
- 1,299,706 · +8.0%
- By 2040
- 1,488,256 · +23.6%
- By 2050
- 1,664,580 · +38.3%
- By 2075
- 2,036,072 · +69.2%
- By 2100
- 2,222,402 · +84.6%
Race, ethnicity, and origin ACS 2023
- Neighborhood character
- Predominantly Black (76%)
- Race & ethnicity
- Black 76% White 11% Hispanic / Latino 7% Asian 4% Two or more races 3%
- Hispanic origin (detail)
- Mexican 4% Dominican 1%
- Common ancestry
- Lithuanian 1%
- Foreign-born
- 6% · Canada, China, South Korea
- Languages at home
- 89% English-only · Spanish 5% Other Indo-European 1% Chinese 1%
Political lean MEDSL · Fulton
- 2024 margin
- Solid D (+44.9) · D 71.9% · R 27.0% · Other 1.1%
- 2008→2024 swing
- +9.8pp toward D · 2008: 35.0pp · 2024: 44.9pp
- All cycles
- 2024: D+44.9 2020: D+46.4 2016: D+42.1 2012: D+29.6 2008: D+35.0
Not yet ingested
- Civics
- —
Market trends
- HPI YoY
- ▼ -95.32%
- Current HPI
- 321.4626
- Rent YoY
- ▲ 2.53%
- Metro
- Atlanta-Sandy Springs-Alpharetta, GA
- State GDP YoY
- ▲ 2.66%
- F500 in state
- 28
Industry mix (Fortune 500 HQ in GA)
| Industry | F500 HQs | Revenue |
|---|---|---|
| Paper / Packaging | 2 | $29B |
|
||
| Retail | 1 | $160B |
|
||
| Transportation / Logistics | 1 | $91B |
|
||
| Airlines | 1 | $62B |
|
||
| Consumer Goods | 1 | $47B |
|
||
| Utilities | 1 | $25B |
|
||
Price history
+625.0% since first listed8 events — show timeline
- 2026-04-03 Listed $290,000 FMLS
- 2026-04-03 Listed $290,000 GAMLS
- 2026-03-16 Listing Removed — GAMLS
- 2025-12-22 Price Changed $260,000 GAMLS
- 2025-12-12 Price Changed $295,000 GAMLS
- 2025-10-23 Price Changed $319,900 GAMLS
- 2025-10-08 Listed $375,000 GAMLS
- 1994-04-06 Sold (Public Records) $40,000 Public Records
Property tax history
+2.0%/yrLatest (2025): $1,416 · -41.0% YoY. Source: county tax records.
Cash-flow waterfall
monthlySold comps — $/sqft
last 12 mo · ≤1 miLoading sold comps…