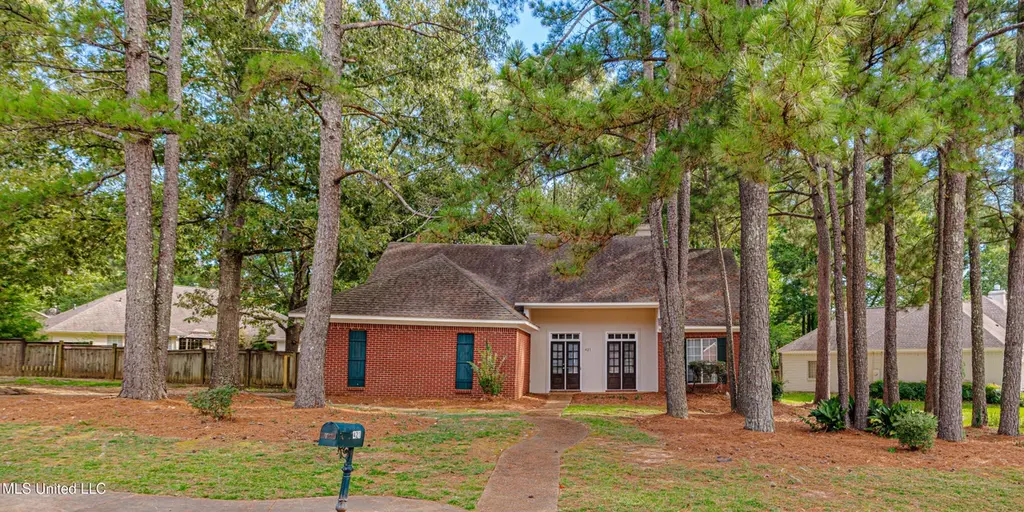
421 Violet Dr · Madison, MS
Flood risk 1/10 · Minimal
- FEMA flood zone
- X (unshaded)
- Chance of flooding over 30 yrs
- 0.0%
- Est. flood insurance / yr
- $507 – $1,088
Fire risk 1/10 · Minimal
- Est. fire insurance / yr
- $1,241 – $2,305
Heat risk 7/10 · Major
- Hot days now (above 108°F)
- 7 days/yr
- Hot days in 30 yrs
- 20 days/yr
Wind risk 8/10 · Major
- Chance of severe wind over 30 yrs
- 80.0%
Air-quality risk 2/10 · Minimal
- Unhealthy air days now
- 0 days/yr
- Unhealthy air days in 30 yrs
- 1 days/yr
Risk factors via First Street. Map © Google.
Why this score? — see what drove the B- grade
The composite is a weighted blend of 9 inputs, each scored 0–100. Each bar is that input's sub-score; the figure is the points it added to the 100-point composite (weight × sub-score).
- Cash flow +23.6/30.0
- ARV discount +15.0/15.0
- DSCR +7.6/10.0
- 1% rule +6.0/10.0
- Schools +4.8/10.0
- Livability +4.0/5.0
- Rent growth +3.2/5.0
- Condition / age +2.5/5.0
- Appreciation +0.0/10.0
$225,000
🖨 Deal sheet 📄 Offer letter ✓ Due diligence
Listing remarks MLS
Bright, spacious, and full of potential -- this home offers generous living areas, plenty of natural light, and a large lot perfect for outdoor enjoyment. Visible exterior foundation concerns are present, and the price reflects the opportunity to make this home your own. Imagine customizing this space to fit your family's needs and lifestyle. With strong neighborhood appeal and comparable sales supporting future value, this home is ready for the next chapter of its story -- and yours.
Key facts
- Close to parks
- Close to schools
- Local amenities
Tags
Neighborhood map
What this means for you Summary
Snapshot
- This is a 3-bed/4.0-bath single-family listed at $225k.
Deal economics
- At list price, monthly cash flow is $425 ($5k/yr) — positive.
- The deal already cash-flows at list — no discount required.
- Meets the 1% rule at list price ($2k rent vs $225k).
- Recommended offer: $205k (9.0% below list) — sets the bar for market timing.
- Cap rate 8.6% vs local median 3.7% in Madison — top-decile yield for the area; either an underpriced asset or a hidden risk that comps aren't pricing in. Stress-test before assuming the spread holds.
Location & tenants
- Location reads 81/100 on livability (#4 in MS, #1,556 nationally) — a professional / high-income tenant draw. Strengths: crime A+, employment A+, housing A+; Watch: amenities D-, commute F.
- Madison County School District (rural): math 54% / reading 54% proficiency, ranked #3 of 130 in MS (top 2%) — acceptable for families but not a draw, mixed tenant base, ~2y average lease.
- Market conditions: Rents rising (+2.6%/yr); 628 active listings in the ZIP; high-income renter base; 553 units permitted in Madison County in 2024 (0 in 5+ unit buildings).
Forward outlook
- Local home prices are declining (-3.0%/yr); year-one equity from $2k of loan paydown is wiped out by about $7k of value loss. Plan a longer hold.
- Madison County population projected at +34% by 2050 — long-run rental-demand tailwind backs the buy-and-hold thesis.
Negotiation context
- It's been on market 105 days — a 9% lower offer ($205k) is reasonable based on typical stale-listing flexibility.
- 8 sale attempts since 20y ago with the ask held roughly flat each time — persistent listings suggest the price (not the market) is what's stuck; bring a comps-based counter.
Risks & watch-outs
- Climate carrying-cost: severe wind risk, 80% chance of damaging wind over 30y; extreme-heat days projected 7→20/yr by 2055 (HVAC capex compounding) — expect insurance premiums to compound above CPI over the hold.
Questions for the listing agent
- It's been on market 105 days. Have you received any prior offers? Is the seller open to a 9% concession, seller financing, or rate buy-down credit?
- What does the HOA fee cover, when was the last increase, and are there any pending special assessments or reserve-fund shortfalls?
- Why hasn't it sold? Are there any deal-killer items the seller is aware of (foundation, flood, title, zoning, code violations)?
- Is there a deadline driving the sale (1031 exchange, divorce, estate, relocation)? That informs how much negotiation room exists.
- Schools are A-rated — typically a magnet for longer-tenancy family renters. What's the average tenant stay here, and is there a school-zone premium baked into asking?
- What's the average days-on-market for RENTAL listings here right now (not sales)? A rising rental-DOM trend means longer vacancies and softer asking-rent achievability than the comps imply.
- What's the recent tenant-quality profile in this submarket — average credit score on applications, eviction rate, late-payment / NSF rate, and stable-employment percentage? A property-management company in the area should have these aggregated.
- How much new for-sale + rental construction is in the pipeline within 1–3 miles? Heavy new supply typically softens prices + rents 12–24 months out; constrained supply supports both.
Investment metrics
- 1% rule
- 1.10% ✓
- Cap rate
- 8.56%
- Cash-on-cash
- 8.10%
- DSCR
- 1.36
- GRM
- 7.6
CMA / ARV
- ARV (median comp)
- $326,364
- List price
- $225,000
- Delta
- -31.06%
- Verdict
- UNDERPRICED
- Comps
- 20 within 1.0 mi
Show comp detail 3 sales within ~0.75 mi
| Address | Dist | Beds/Ba | Sqft | Sold | Price | $/sf | Match |
|---|---|---|---|---|---|---|---|
| 414 Violet Dr | 0.03mi | 3/2.0 | 1,666 (-0%) | 4mo | $280,000 | $168 | 87 |
| 810 Annandale Rd | 0.11mi | 3/2.0 | 1,638 (-2%) | 21mo | $285,000 | $174 | 66 |
| 107 Lilac Ct | 0.39mi | 3/3.0 | 1,700 (+2%) | 15mo | $299,000 | $176 | 62 |
Match score weights: distance 35% · size 25% · config 20% · recency 20%. Top-matched comps best support the ARV.
Projected returns pro-forma
-3.0% appreciation · 2.61% rent growth · sell at horizon
- IRR
- -4.4%
- Equity multiple
- 0.84×
- Total profit
- $-10,315
- Equity at exit
- $33,548
- IRR
- 4.8%
- Equity multiple
- 1.35×
- Total profit
- $22,053
- Equity at exit
- $19,454
Cash invested: $63,000 (down + closing). Projections, not guarantees.
Landlord ↔ Tenant lean methodology
- Overall (STATE)
- 90 Strongly Landlord-Friendly
- State Mississippi
- 90 Strongly Landlord-Friendly · R+11
- County
- — inherits STATE
- City
- — inherits STATE
ZIP-level market 39110
- Home prices YoY
- -28.3%
- Rents YoY
- 2.6%
- Active inventory
- 628
- Price-to-rent
- 7.6×
Monthly cashflow live
- Estimated rent
- $2,481 medium interval (Pro) →
- Mortgage (P&I)
- −$1,180
- Tax from tax record
- −$239 /mo · $2,865/yr
- Insurance
- −$94
- HOA
- −$22
- Vacancy / Maint / Mgmt
- −$521
- Net cashflow
- $425
Break-even live
UW: 25.0% down · 7.5% · 30yr · 1.5% tax · 5.0% vac · 8.0% maint · 8.0% mgmt
Financing live
Cash to close
- Down payment
- $56,250
- Closing costs
- $6,750
- Reserves months
- —
- Total cash needed
- —
Loan-product check · same deal, 3 products live
Conventional
25% down · 7.5% · 30yr
- Down + closing
- —
- Monthly P&I
- —
- Monthly cashflow
- —
- DSCR
- —
- Eligible?
- —
Personal DTI + credit; lowest rate.
DSCR
20% down · 8.5% · 30yr
- Down + closing
- —
- Monthly P&I
- —
- Monthly cashflow
- —
- DSCR
- —
- Eligible?
- —
No personal income docs; deal must DSCR.
Hard money
10% down · 12.0% · 12mo
- Down + closing
- —
- Monthly P&I
- —
- Monthly cashflow
- —
- DSCR
- —
- Eligible?
- —
Short-term bridge; refi at stabilization.
HOA detail
- Monthly dues
- $22 · $264/yr
Listing history 30 events
-
2026-06-02status $225,000 Pending 105 DOM
-
2026-06-01days on market $225,000 Active 105 DOM
-
2026-05-31days on market $225,000 Active 104 DOM
-
2026-05-30days on market $225,000 Active 103 DOM
-
2026-05-07price $225,000 492-char remark
Show marketing remark (492 chars)
Bright, spacious, and full of potential -- this home offers generous living areas, plenty of natural light, and a large lot perfect for outdoor enjoyment. Visible exterior foundation concerns are present, and the price reflects the opportunity to make this home your own. Imagine customizing this space to fit your family's needs and lifestyle. With strong neighborhood appeal and comparable sales supporting future value, this home is ready for the next chapter of its story -- and yours.
-
2026-02-16$235,000 Active 492-char remark
Show marketing remark (492 chars)
Bright, spacious, and full of potential -- this home offers generous living areas, plenty of natural light, and a large lot perfect for outdoor enjoyment. Visible exterior foundation concerns are present, and the price reflects the opportunity to make this home your own. Imagine customizing this space to fit your family's needs and lifestyle. With strong neighborhood appeal and comparable sales supporting future value, this home is ready for the next chapter of its story -- and yours.
-
2026-01-29historical
-
2026-01-01status Active
-
2025-12-31historical
-
2025-10-16price $249,900
-
2025-09-15price $254,900
-
2025-07-29$259,900 Active
-
2024-10-25historical $1,995
-
2024-10-12$1,995
-
2024-10-12historical $2,095
-
2024-09-24$2,095
-
2024-09-24historical $2,095
-
2024-09-17$2,095
-
2022-02-03price $1,850
-
2021-09-27soldstatus
-
2021-08-26soldstatus $232,000
-
2021-07-12$235,000
-
2006-12-29soldstatus
-
2006-12-06soldstatus
-
2006-09-06$189,900
-
2003-08-19soldstatus
-
2000-07-06soldstatus
-
1998-09-02soldstatus
-
1995-09-06soldstatus
-
1994-08-19soldstatus
ⓘ Source: listings_history table (triggers on properties + properties_extension) + one-shot
backfill from property_details.listing_events for pre-trigger history.
Tax reassessment forecast MS · Resets to sale price
- Current annual tax
- $2,865 · $239/mo
- Projected year-2 tax
- $2,865 · $239/mo
- Expected delta
- $0/yr ($0/mo · 0.0%)
ⓘ Screening estimate from a state-policy table — verify with the county assessor before closing.
Climate risk First Street
- Flood 1/10 Low FEMA zone X (unshaded) · 0% chance over 30 yrs
- Wildfire 1/10 Low
- Heat 7/10 Severe 7 d/yr ≥108°F today · 20 d/yr by 30 yrs out
- Wind 8/10 Severe 80% chance of damaging wind over 30 yrs
- Air quality 2/10 Low 0 unhealthy d/yr today · 1 by 30 yrs out
Nearby sold comps map
Loading sold comps map…
Walkable amenities ~0.75 mi
Loading nearby amenities…
Taxation est. · year 1
- Rental income
- $29,769
- − Mortgage interest
- −$12,603
- − Property taxes
- −$2,865
- − Insurance
- −$1,125
- − Repairs & maintenance
- −$2,381
- − Management
- −$2,381
- − HOA
- −$264
- − Depreciation
- −$6,545
- Taxable income
- $1,603
- Est. tax owed @ 24.0%
- −$385
- After-tax cash flow
- $4,719/yr
For passive investors: Depreciation is non-cash, so a rental often shows a tax loss while cash-flowing — sheltering income. Rental losses are passive: they offset passive income freely, and up to $25,000/yr can offset ordinary (W-2) income if you actively participate and your MAGI is under $100k (phasing out to $0 by $150k); unused losses carry forward. On sale, claimed depreciation is recaptured at up to 25%, and gains may owe capital-gains tax (a 1031 exchange can defer both). Figures are a year-1 estimate at your 24.0% rate — not tax advice; consult a CPA.
Schools (NCES district)
- District
- Madison County School District
- NCES district ID
- 2802790
- Math proficiency
- 54% ▼ -7.00%
- Reading proficiency
- 54% ▼ -7.00%
- Median HH income
- $70,579
- Composite
- 48.08/100
- National rank
- #2188
- State rank
- #3 of 130 in MS
Livability — Madison
- Score
- 81/100
- State rank
- #4
- US rank
- #1556
Category grades
Schools grade is shown separately in the Schools card above.
Census & demographics
- Census place
- Madison, MS
- County
- Madison County · 75,005 people
- City population
- 50,443
- Metro
- Jackson, MS
- Population (ZIP)
- 50,443
- Household income
- $125,506
- Rent vs Own
- Severe rent burden
- 227.0
Population outlook (Madison County) Hauer SSP2
- Today (2025)
- 122,509 people
- By 2030
- 131,737 · +7.5%
- By 2040
- 148,930 · +21.6%
- By 2050
- 164,300 · +34.1%
- By 2075
- 197,495 · +61.2%
- By 2100
- 211,429 · +72.6%
Race, ethnicity, and origin ACS 2023
- Neighborhood character
- Predominantly White (76%)
- Race & ethnicity
- White 76% Black 15% Asian 4% Two or more races 3% Hispanic / Latino 2%
- Common ancestry
- Italian 6% Slovak 3% Lithuanian 3%
- Foreign-born
- 5% · China, Canada
- Languages at home
- 92% English-only · Spanish 2% Other Indo-European 2% Chinese 1%
Political lean MEDSL · Madison
- 2024 margin
- R (+17.3) · D 40.8% · R 58.0% · Other 1.2%
- 2008→2024 swing
- -1.7pp toward R · 2008: -15.6pp · 2024: -17.3pp
- All cycles
- 2024: R+17.3 2020: R+11.8 2016: R+16.1 2012: R+15.7 2008: R+15.6
Not yet ingested
- Civics
- —
Market trends
- HPI YoY
- ▼ -60.99%
- Current HPI
- 154.6909
- Rent YoY
- ▲ 2.61%
- Metro
- Jackson, MS
- State GDP YoY
- —
- F500 in state
- 0
Price history
+18.5% since first listed26 events — show timeline
- 2026-05-07 Price Changed $225,000 MLSU
- 2026-02-16 Listed $235,000 MLSU
- 2026-01-29 Listing Removed — MLSU
- 2026-01-01 Relisted — MLSU
- 2025-12-31 Listing Removed — MLSU
- 2025-10-16 Price Changed $249,900 MLSU
- 2025-09-15 Price Changed $254,900 MLSU
- 2025-07-29 Listed $259,900 MLSU
- 2024-10-25 Rental Removed $1,995 RENTLY
- 2024-10-12 Listed for Rent $1,995 RENTLY
- 2024-10-12 Rental Removed $2,095 RENTLY
- 2024-09-24 Listed for Rent $2,095 RENTLY
- 2024-09-24 Rental Removed $2,095 RENTLY
- 2024-09-17 Listed for Rent $2,095 RENTLY
- 2022-02-03 Price Changed $1,850 RENT.
- 2021-09-27 Sold (MLS) — MLSU
- 2021-08-26 Sold (Public Records) $232,000 Public Records
- 2021-07-12 Listed $235,000 MLSU
- 2006-12-29 Sold (Public Records) — Public Records
- 2006-12-06 Sold (MLS) — MLSU
- 2006-09-06 Listed $189,900 MLSU
- 2003-08-19 Sold (Public Records) — Public Records
- 2000-07-06 Sold (Public Records) — Public Records
- 1998-09-02 Sold (Public Records) — Public Records
- 1995-09-06 Sold (Public Records) — Public Records
- 1994-08-19 Sold (Public Records) — Public Records
Property tax history
+4.3%/yrLatest (2025): $2,865 · +0.0% YoY. Source: county tax records.
Cash-flow waterfall
monthlySold comps — $/sqft
last 12 mo · ≤1 miLoading sold comps…