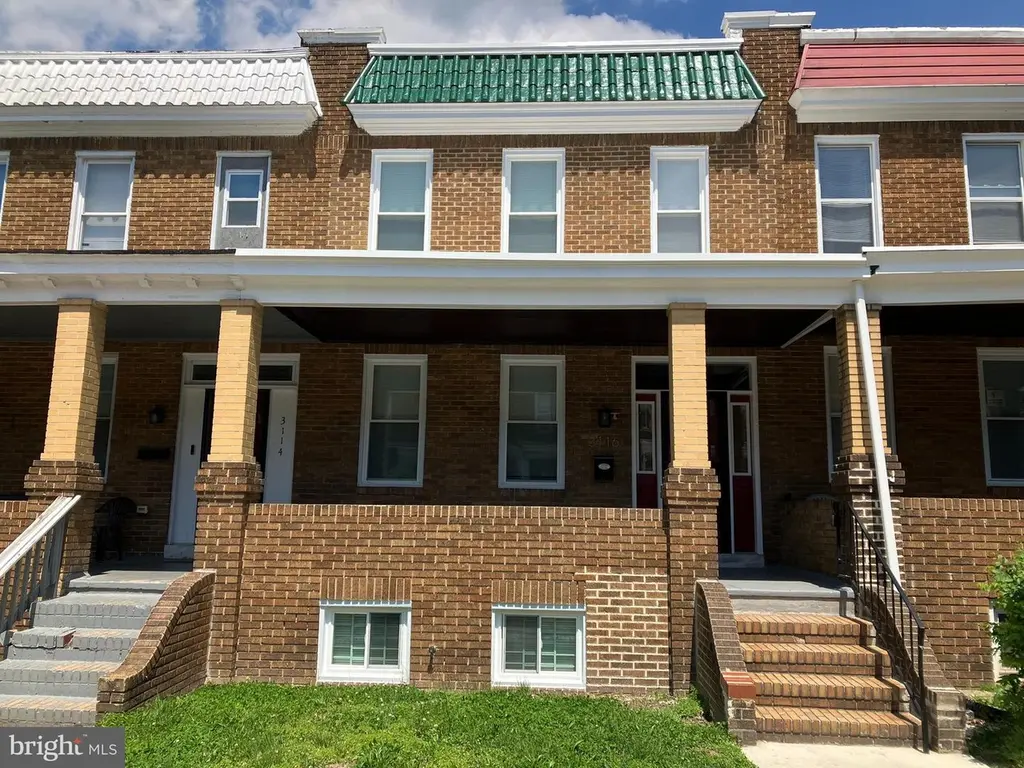
3116 Cliftmont Ave · Baltimore, MD
Flood risk 5/10 · Moderate
- FEMA flood zone
- X (unshaded)
- Chance of flooding over 30 yrs
- 0.67%
- Est. flood insurance / yr
- $473 – $860
Fire risk 1/10 · Minimal
- Est. fire insurance / yr
- $755 – $1,403
Heat risk 8/10 · Major
- Hot days now (above 103°F)
- 7 days/yr
- Hot days in 30 yrs
- 15 days/yr
Wind risk 6/10 · Moderate
- Chance of severe wind over 30 yrs
- 27.0%
Air-quality risk 4/10 · Minor
- Unhealthy air days now
- 6 days/yr
- Unhealthy air days in 30 yrs
- 7 days/yr
Risk factors via First Street. Map © Google.
Why this score? — see what drove the C- grade
The composite is a weighted blend of 9 inputs, each scored 0–100. Each bar is that input's sub-score; the figure is the points it added to the 100-point composite (weight × sub-score).
- Cash flow +17.7/30.0
- ARV discount +7.5/15.0
- DSCR +5.5/10.0
- Appreciation +4.7/10.0
- Rent growth +3.8/5.0
- Livability +3.8/5.0
- 1% rule +3.6/10.0
- Condition / age +2.5/5.0
- Schools +1.0/10.0
$209,500
🖨 Deal sheet 📄 Offer letter ✓ Due diligence
Listing remarks
Another high-quality home renovation by St. Ambrose Housing Aid Center. Your new home has been thoughtfully renovated and is ready for you to move right in. Features include a new roof, new windows and doors, new kitchen, new SS kitchen appliances, new washer & dryer, new bathrooms, new rear concrete parking pad, new plumbing, new electric, new furnace & central AC, beautifully refinished hardwood floors, fresh neutral paint and a rear second floor bonus room. The large lower level has tons of space for a family room, kids play room; whatever you wish. This house is ready for your finishing touches to make it your home! Buyer may be eligible for closing cost grants and favorabl
Key facts
- New kitchen
- New doors
- New washer and dryer
Tags
Property features AI
Exterior
- Parking: Driveway; Off-street parking
- Utilities: Public water; Public sewer
- Home design: Interior townhouse/rowhouse; Effective year remodeled: 2026; Fee simple ownership
- Construction: Brick construction; Block and brick/mortar foundation; Cool/white roof; Built year source: assessor
- Exterior features: Above-grade and below-grade structures; Ground rent paid annually; Located in city limits
Interior
- Kitchen: Kitchen (appliances not specified)
- Bedrooms: Three bedrooms on the upper level (1st upper level)
- Flooring: Ceramic tile; Luxury vinyl plank; Hardwood
- Bathrooms: One full bathroom on the upper level; One half bathroom on the main level
- Heating & cooling: Forced air heating fueled by natural gas; Central air conditioning (electric)
- Interior features: Excellent condition; Full unfinished basement with space for finished rooms
- Laundry & utility: Hot water heated by natural gas
Neighborhood map
What this means for you Summary
Snapshot
- This is a 3-bed/2.0-bath townhouse listed at $210k.
Deal economics
- At list price, monthly cash flow is $167 ($2k/yr) — positive.
- The deal already cash-flows at list — no discount required.
- To meet the 1% rule (rent ≥ 1% of price), the offer needs to be $180k (14.1% below list).
- Recommended offer: $180k (14.1% below list) — sets the bar for 1% rule.
- Cap rate 7.2% vs local median 6.0% in Baltimore — meaningfully above typical; check what's discounted (condition, days-on-market, listing class) to confirm the premium yield is real.
Location & tenants
- Location reads 76/100 on livability (#90 in MD, #3,396 nationally) — a middle-class / working-renter tenant base. Strengths: amenities A+, commute A+, housing A+; Watch: schools D, crime F.
- Baltimore City Public Schools (urban): math 7% / reading 16% proficiency, ranked #24 of 24 in MD (top 100%) — low school quality limits family demand, transient renter base, plan for 1-2y turnover; 79% free/reduced lunch — lower-income household profile, screen leases tightly.
- Market conditions: Rents rising fast (+5.2%/yr); 319 active listings in the ZIP; 40 comparable units currently listed for rent nearby; rentals at typical pace (median 24d on market — plan ~3-4 weeks tenant-placement turnaround); 42% of comp listings sitting > 30 days — soft ceiling on asking rent; 1,273 units permitted in Baltimore city in 2024 (1,104 in 5+ unit buildings).
- This rent runs 42% of the median local income ($51k/yr) — at the standard rent-burdened threshold; future hikes will face affordability resistance.
Forward outlook
- In year one you build about $258 of equity ($1k loan paydown + $-1k appreciation (-0.6% local appreciation)).
- Baltimore County population projected to shrink 4% by 2050 — rents likely to lag national; underwrite the cash flow, not the appreciation.
- At projected returns (-0.6% appreciation + 5.2% rent growth), your $59k cash investment doubles in ~9 years — after that, you're playing with house money.
Negotiation context
- It's been on market 51 days — a 3% lower offer ($203k) is reasonable based on typical stale-listing flexibility.
- 2 sale attempts since 26y ago; this cycle's ask has dropped $20k (9%) from the opening price — seller is motivated, your offer sets the floor, not the list.
- Current owner paid $75k; list at $210k implies a 179% gain — meaningful room to come down on a strong offer.
Risks & watch-outs
- Watch-outs: built in 1925 — expect roof / HVAC / electrical / plumbing capex.
- Climate carrying-cost: moderate flood risk; major wind risk, 27% chance of damaging wind over 30y; extreme-heat days projected 7→15/yr by 2055 (HVAC capex compounding) — expect insurance premiums to compound above CPI over the hold.
Questions for the listing agent
- It's been on market 51 days. Have you received any prior offers? Is the seller open to a 14% concession, seller financing, or rate buy-down credit?
- Built in 1925 — when were the roof, HVAC, electrical panel, plumbing, and water heater last replaced?
- Is there a deadline driving the sale (1031 exchange, divorce, estate, relocation)? That informs how much negotiation room exists.
- Schools are D-rated, which usually means shorter tenancies and higher turnover. Who's the typical renter profile here, and what's been the actual vacancy rate?
- Crime grade is F in this area — have there been break-ins, vandalism, or insurance claims at this property in the last 3 years? What carrier currently insures it and at what premium?
- What's the average days-on-market for RENTAL listings here right now (not sales)? A rising rental-DOM trend means longer vacancies and softer asking-rent achievability than the comps imply.
- What's the recent tenant-quality profile in this submarket — average credit score on applications, eviction rate, late-payment / NSF rate, and stable-employment percentage? A property-management company in the area should have these aggregated.
- How much new for-sale + rental construction is in the pipeline within 1–3 miles? Heavy new supply typically softens prices + rents 12–24 months out; constrained supply supports both.
Investment metrics
- 1% rule
- 0.86% ✗
- Cap rate
- 7.25%
- Cash-on-cash
- 3.42%
- DSCR
- 1.15
- GRM
- 9.7
CMA / ARV
- ARV (median comp)
- $106,224
- List price
- $209,500
- Delta
- 97.23%
- Verdict
- OVERPRICED
- Comps
- 20 within 1.0 mi
Show comp detail 12 sales within ~0.75 mi
| Address | Dist | Beds/Ba | Sqft | Sold | Price | $/sf | Match |
|---|---|---|---|---|---|---|---|
| 2902 Clifton Park Ter | 0.20mi | 3/1.5 | 1,344 (+1%) | 1mo | $66,000 | $49 | 86 |
| 3533 Elmley Ave | 0.25mi | 3/1.5 | 1,344 (+1%) | 1mo | $70,000 | $52 | 83 |
| 2821 Erdman Ave | 0.25mi | 2/2.0 (-1) | 1,260 (-5%) | 0mo | $75,000 | $60 | 75 |
| 3733 Ravenwood Ave | 0.58mi | 3/2.0 | 1,350 (+2%) | 1mo | $135,000 | $100 | 70 |
| 3238 Ravenwood Ave | 0.30mi | 3/1.5 | 1,158 (-13%) | 0mo | $70,000 | $60 | 62 |
| 3564 Elmora Ave | 0.36mi | 3/1.5 | 1,478 (+11%) | 1mo | $133,500 | $90 | 61 |
| 3555 Elmora Ave | 0.36mi | 4/2.0 (+1) | 1,178 (-11%) | 1mo | $254,000 | $216 | 59 |
| 3406 Ramona Ave | 0.67mi | 3/2.0 | 1,408 (+6%) | 0mo | $85,000 | $60 | 58 |
| 3571 Dudley Ave | 0.69mi | 3/2.0 | 1,400 (+5%) | 1mo | $175,000 | $125 | 58 |
| 3532 Cliftmont Ave | 0.55mi | 3/2.0 | 1,200 (-10%) | 2mo | $168,000 | $140 | 57 |
| 3838 Lyndale Ave | 0.58mi | 2/2.0 (-1) | 1,190 (-10%) | 2mo | $113,500 | $95 | 49 |
| 4117 Eastmont Ave | 0.69mi | 3/2.0 | 1,176 (-11%) | 1mo | $224,900 | $191 | 48 |
Match score weights: distance 35% · size 25% · config 20% · recency 20%. Top-matched comps best support the ARV.
Projected returns pro-forma
-0.57% appreciation · 5.25% rent growth · sell at horizon
- IRR
- 1.1%
- Equity multiple
- 1.05×
- Total profit
- $3,048
- Equity at exit
- $54,950
- IRR
- 8.7%
- Equity multiple
- 1.94×
- Total profit
- $55,260
- Equity at exit
- $61,523
Cash invested: $58,660 (down + closing). Projections, not guarantees.
Landlord ↔ Tenant lean methodology
- Overall (CITY)
- 12 Strongly Tenant-Friendly
- State Maryland
- 27 Tenant-Leaning · D+14
- County
- — inherits STATE
- City Baltimore
- 12 Strongly Tenant-Friendly · D+58
ZIP-level market 21213
- Home prices YoY
- -0.1%
- Rents YoY
- 5.2%
- Active inventory
- 319
- Price-to-rent
- 9.7×
Monthly cashflow live
- Estimated rent
- $1,799 high interval (Pro) →
- Mortgage (P&I)
- −$1,099
- Tax from tax record
- −$68 /mo · $817/yr
- Insurance
- −$87
- HOA
- −$0
- Vacancy / Maint / Mgmt
- −$378
- Net cashflow
- $167
Break-even live
UW: 25.0% down · 7.5% · 30yr · 1.5% tax · 5.0% vac · 8.0% maint · 8.0% mgmt
Financing live
Cash to close
- Down payment
- $52,375
- Closing costs
- $6,285
- Reserves months
- —
- Total cash needed
- —
Loan-product check · same deal, 3 products live
Conventional
25% down · 7.5% · 30yr
- Down + closing
- —
- Monthly P&I
- —
- Monthly cashflow
- —
- DSCR
- —
- Eligible?
- —
Personal DTI + credit; lowest rate.
DSCR
20% down · 8.5% · 30yr
- Down + closing
- —
- Monthly P&I
- —
- Monthly cashflow
- —
- DSCR
- —
- Eligible?
- —
No personal income docs; deal must DSCR.
Hard money
10% down · 12.0% · 12mo
- Down + closing
- —
- Monthly P&I
- —
- Monthly cashflow
- —
- DSCR
- —
- Eligible?
- —
Short-term bridge; refi at stabilization.
Rent comps 40 comps
| Address | Beds | Baths | Sqft | Rent | $/sqft | DOM | Units | Dist |
|---|---|---|---|---|---|---|---|---|
| 3335 Lyndale Ave Baltimore, MD | 2.0 | 2.0 | 1344 | $1,600 | $1.19 | 23d | 1 | 0.19mi |
| 3317 Lyndale Ave Baltimore, MD | 3.0 | 1.0 | 900 | $1,300 | $1.44 | 43d | 1 | 0.20mi |
| 3315 Lyndale Ave Baltimore, MD | 2.0 | 1.5 | 896 | $1,650 | $1.84 | 17d | 1 | 0.20mi |
| 3326 Elmora Ave Baltimore, MD | 3.0 | 1.0 | 1200 | $1,450 | $1.21 | 23d | 1 | 0.22mi |
| 3222 Lyndale Ave Unit 1 Baltimore, MD | 3.0 | 1.5 | 1500 | $2,200 | $1.47 | 12d | 1 | 0.22mi |
| 3213 Elmley Ave Baltimore, MD | 2.0 | 1.0 | 1188 | $1,395 | $1.17 | 43d | 1 | 0.22mi |
| 3218 Lyndale Ave Baltimore, MD | 3.0 | 1.5 | 1020 | $1,500 | $1.47 | 23d | 1 | 0.22mi |
| 3339 Elmora Ave Baltimore, MD | 3.0 | 2.0 | 896 | $1,600 | $1.79 | 43d | 1 | 0.23mi |
| 3221 Lyndale Ave Baltimore, MD | 2.0 | 2.0 | 1020 | $1,700 | $1.67 | 23d | 1 | 0.24mi |
| 3322 Ravenwood Ave Baltimore, MD | 3.0 | 2.0 | 932 | $1,800 | $1.93 | 23d | 1 | 0.26mi |
| 3512 Elmora Ave Baltimore, MD | 3.0 | 1.5 | 1472 | $1,900 | $1.29 | 20d | 1 | 0.27mi |
| 3551 Elmley Ave Baltimore, MD | 3.0 | 1.5 | 1872 | $2,095 | $1.12 | 23d | 1 | 0.27mi |
| 3343 Ravenwood Ave Unit 3343 Baltimore, MD | 2.0 | 2.0 | 948 | $1,855 | $1.96 | 17d | 1 | 0.27mi |
| 2113 Belair Rd Baltimore, MD | 3.0 | 1.0 | 1344 | $1,795 | $1.34 | 43d | 1 | 0.31mi |
| 2828 Lake Ave Baltimore, MD | 3.0 | 2.0 | 1164 | $1,850 | $1.59 | 4d | 1 | 0.34mi |
| 3610 Elmley Ave Baltimore, MD | 2.0 | 1.5 | 1200 | $1,550 | $1.29 | 20d | 1 | 0.35mi |
| 3436 Cardenas Ave Baltimore, MD | 2.0 | 1.0 | 1146 | $1,395 | $1.22 | 43d | 1 | 0.36mi |
| 3519 Kentucky Ave Baltimore, MD | 3.0 | 2.0 | 1536 | $2,100 | $1.37 | 10d | 1 | 0.45mi |
| 3515 Parklawn Ave Baltimore, MD | 3.0 | 2.0 | 1240 | $1,700 | $1.37 | 2d | 1 | 0.45mi |
| 3525 Kentucky Ave Baltimore, MD | 3.0 | 1.5 | 1536 | $1,950 | $1.27 | 43d | 1 | 0.45mi |
| 2837 Pelham Ave Baltimore, MD | 4.0 | 2.0 | 1164 | $1,675 | $1.44 | 43d | 1 | 0.45mi |
| 2817 Pelham Ave Baltimore, MD | 3.0 | 2.0 | 1464 | $1,950 | $1.33 | 23d | 1 | 0.46mi |
| 3902 Erdman Ave Unit 1 Baltimore, MD | 2.0 | 1.0 | 1000 | $1,275 | $1.27 | 23d | 1 | 0.46mi |
| 2848 Pelham Ave Baltimore, MD | 3.0 | 2.0 | 1164 | $1,700 | $1.46 | 43d | 1 | 0.47mi |
| 3603 Ravenwood Ave Unit 1 Baltimore, MD | 4.0 | 1.0 | 1566 | $1,600 | $1.02 | 43d | 1 | 0.48mi |
| 3914 Erdman Ave #1 Baltimore, MD | 3.0 | 1.0 | 1200 | $1,319 | $1.10 | 17d | 1 | 0.48mi |
| 4104 Erdman Ave Unit 2 Baltimore, MD | 2.0 | 1.0 | 1566 | $1,075 | $0.69 | 4d | 1 | 0.53mi |
| 3028 Kenyon Ave Baltimore, MD | 2.0 | 2.0 | 1075 | $1,395 | $1.30 | 43d | 1 | 0.54mi |
| 2735 Chesterfield Ave Baltimore, MD | 3.0 | 2.5 | 1536 | $2,000 | $1.30 | 10d | 1 | 0.54mi |
| 3572 Juneway Unit 1 Baltimore, MD | 2.0 | 1.0 | 1800 | $1,200 | $0.67 | 43d | 1 | 0.56mi |
| 3305 Dudley Ave Baltimore, MD | 3.0 | 2.0 | 1413 | $1,950 | $1.38 | 43d | 1 | 0.60mi |
| 3544 Chesterfield Ave Baltimore, MD | 3.0 | 1.5 | 1200 | $1,635 | $1.36 | 43d | 1 | 0.61mi |
| 3300 Dudley Ave Baltimore, MD | 4.0 | 2.0 | 1724 | $2,200 | $1.28 | 43d | 1 | 0.62mi |
| 3566 Dudley Ave Baltimore, MD | 2.0 | 1.0 | 896 | $1,800 | $2.01 | 23d | 1 | 0.73mi |
| 3551 Shannon Dr Baltimore, MD | 3.0 | 2.0 | 1485 | $2,358 | $1.59 | 23d | 1 | 0.76mi |
| 3573 Shannon Dr Baltimore, MD | 4.0 | 2.0 | 1493 | $2,300 | $1.54 | 17d | 1 | 0.76mi |
| 2522 E Federal St Baltimore, MD | 2.0 | 2.0 | 1760 | $1,400 | $0.80 | 43d | 1 | 0.76mi |
| 2311 E Lafayette Ave Baltimore, MD | 3.0 | 1.0 | 1000 | $1,400 | $1.40 | 43d | 1 | 0.78mi |
| 1403 N Linwood Ave Baltimore, MD | 3.0 | 2.0 | 1660 | $1,995 | $1.20 | 43d | 1 | 0.81mi |
| 2621 E Oliver St Baltimore, MD | 3.0 | 2.0 | 1600 | $1,700 | $1.06 | 23d | 1 | 0.82mi |
Listing history 24 events
-
2026-06-17status $209,500 Pending 51 DOM
-
2026-06-17days on market $209,500 Active 51 DOM
-
2026-06-16days on market $209,500 Active 50 DOM
-
2026-06-15days on market $209,500 Active 49 DOM
-
2026-06-13pricedays on market $209,500 Active 47 DOM
-
2026-06-09days on market $214,500 Active 43 DOM
-
2026-06-08days on market $214,500 Active 42 DOM
-
2026-06-07days on market $214,500 Active 41 DOM
-
2026-06-04days on market $214,500 Active 38 DOM
-
2026-06-03days on market $214,500 Active 37 DOM
-
2026-06-02days on market $214,500 Active 36 DOM
-
2026-06-01days on market $214,500 Active 35 DOM
-
2026-05-31days on market $214,500 Active 34 DOM
-
2026-05-13price $219,500 720-char remark
-
2026-05-07price $224,500 720-char remark
-
2026-04-27$229,500 Active 720-char remark
-
2024-09-23soldstatus $75,000
-
2006-08-21soldstatus $84,000
-
2001-02-12soldstatus $13,015
-
2000-11-03historical
-
2000-04-09$40,800
-
1996-09-30soldstatus $42,000
-
1996-09-30soldstatus $70,500
-
1996-07-17soldstatus $34,000
ⓘ Source: listings_history table (triggers on properties + properties_extension) + one-shot
backfill from property_details.listing_events for pre-trigger history.
Tax reassessment forecast MD · Partial reset (capped growth)
- Current annual tax
- $817 · $68/mo
- Projected year-2 tax
- $1,550 · $129/mo
- Expected delta
- +$733/yr (+$61/mo · 89.7%)
ⓘ Screening estimate from a state-policy table — verify with the county assessor before closing.
Climate risk First Street
- Flood 5/10 Major FEMA zone X (unshaded) · 67% chance over 30 yrs
- Wildfire 1/10 Low
- Heat 8/10 Severe 7 d/yr ≥103°F today · 15 d/yr by 30 yrs out
- Wind 6/10 Major 27% chance of damaging wind over 30 yrs
- Air quality 4/10 Moderate 6 unhealthy d/yr today · 7 by 30 yrs out
Nearby sold comps map
Loading sold comps map…
Walkable amenities ~0.75 mi
Loading nearby amenities…
Taxation est. · year 1
- Rental income
- $21,585
- − Mortgage interest
- −$11,735
- − Property taxes
- −$817
- − Insurance
- −$1,048
- − Repairs & maintenance
- −$1,727
- − Management
- −$1,727
- − Depreciation
- −$6,095
- Taxable loss
- −$1,563
- Est. tax savings @ 24.0%
- +$375
- After-tax cash flow
- $2,379/yr
For passive investors: Depreciation is non-cash, so a rental often shows a tax loss while cash-flowing — sheltering income. Rental losses are passive: they offset passive income freely, and up to $25,000/yr can offset ordinary (W-2) income if you actively participate and your MAGI is under $100k (phasing out to $0 by $150k); unused losses carry forward. On sale, claimed depreciation is recaptured at up to 25%, and gains may owe capital-gains tax (a 1031 exchange can defer both). Figures are a year-1 estimate at your 24.0% rate — not tax advice; consult a CPA.
Schools (NCES district)
- District
- Baltimore City Public Schools
- NCES district ID
- 2400090
- Math proficiency
- 7% ▼ -9.00%
- Reading proficiency
- 16% ▼ -5.00%
- Median HH income
- $42,108
- Composite
- 10.08/100
- National rank
- #9805
- State rank
- #24 of 24 in MD
Livability — Baltimore
- Score
- 76/100
- State rank
- #90
- US rank
- #3396
Category grades
Schools grade is shown separately in the Schools card above.
Census & demographics
- Census place
- Baltimore, MD
- County
- Baltimore City · 558,601 people
- City population
- 588,727
- Metro
- Baltimore-Columbia-Towson, MD
- Population (ZIP)
- 28,058
- Household income
- $51,344
- Rent vs Own
- Severe rent burden
- 1868.0
Population outlook (Baltimore County) Hauer SSP2
- Today (2025)
- 624,249 people
- By 2030
- 621,541 · -0.4%
- By 2040
- 609,756 · -2.3%
- By 2050
- 597,249 · -4.3%
- By 2075
- 552,236 · -11.5%
- By 2100
- 513,934 · -17.7%
Race, ethnicity, and origin ACS 2023
- Neighborhood character
- Predominantly Black (86%)
- Race & ethnicity
- Black 86% White 6% Hispanic / Latino 4% Two or more races 3%
- Foreign-born
- 3% · Canada
- Languages at home
- 96% English-only · Spanish 3%
Political lean MEDSL · Baltimore
- 2024 margin
- Solid D (+73.0) · D 85.2% · R 12.2% · Other 2.6%
- 2008→2024 swing
- -2.5pp toward R · 2008: 75.5pp · 2024: 73.0pp
- All cycles
- 2024: D+73.0 2020: D+76.6 2016: D+74.6 2012: D+76.4 2008: D+75.5
Not yet ingested
- Civics
- —
Market trends
- HPI YoY
- ▼ -0.57%
- Current HPI
- 427.4453
- Rent YoY
- ▲ 5.25%
- Metro
- Baltimore-Columbia-Towson, MD
- State GDP YoY
- ▲ 2.97%
- F500 in state
- 12
Industry mix (Fortune 500 HQ in MD)
| Industry | F500 HQs | Revenue |
|---|---|---|
| Aerospace / Defense | 1 | $71B |
|
||
| Utilities | 1 | $25B |
|
||
| Hotels | 1 | $24B |
|
||
| Consumer Goods | 1 | $7B |
|
||
| Real Estate | 1 | $6B |
|
||
| Chemicals | 1 | $2B |
|
||
Price history
+516.2% since first listed14 events — show timeline
- 2026-06-17 Pending — BRIGHT MLS
- 2026-06-11 Price Changed $209,500 BRIGHT MLS
- 2026-05-26 Price Changed $214,500 BRIGHT MLS
- 2026-05-13 Price Changed $219,500 BRIGHT MLS
- 2026-05-07 Price Changed $224,500 BRIGHT MLS
- 2026-04-27 Listed $229,500 BRIGHT MLS
- 2024-09-23 Sold (Public Records) $75,000 Public Records
- 2006-08-21 Sold (Public Records) $84,000 Public Records
- 2001-02-12 Sold (MLS) $13,015 MRIS
- 2000-11-03 Delisted — MRIS
- 2000-04-09 Listed $40,800 MRIS
- 1996-09-30 Sold (Public Records) $70,500 Public Records
- 1996-09-30 Sold (Public Records) $42,000 Public Records
- 1996-07-17 Sold (Public Records) $34,000 Public Records
Property tax history
-5.8%/yrLatest (2025): $817 · +1.8% YoY. Source: county tax records.
Cash-flow waterfall
monthlySold comps — $/sqft
last 12 mo · ≤1 miLoading sold comps…