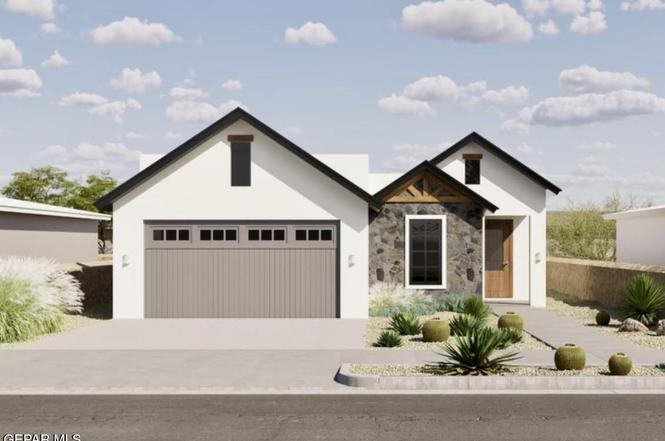
601 Espa Ct · Vinton, TX
Flood risk 1/10 · Minimal
- FEMA flood zone
- X
- Chance of flooding over 30 yrs
- 0.0%
- Est. flood insurance / yr
- $507 – $1,088
Fire risk 4/10 · Minor
- Est. fire insurance / yr
- $1,222 – $2,270
Heat risk 6/10 · Moderate
- Hot days now (above 100°F)
- 7 days/yr
- Hot days in 30 yrs
- 27 days/yr
Wind risk 1/10 · Minimal
- Chance of severe wind over 30 yrs
- —
Air-quality risk 2/10 · Minimal
- Unhealthy air days now
- 1 days/yr
- Unhealthy air days in 30 yrs
- 1 days/yr
Risk factors via First Street. Map © Google.
Why this score? — see what drove the D grade
The composite is a weighted blend of 9 inputs, each scored 0–100. Each bar is that input's sub-score; the figure is the points it added to the 100-point composite (weight × sub-score).
- Cash flow +10.6/30.0
- ARV discount +7.5/15.0
- Appreciation +6.3/10.0
- DSCR +3.1/10.0
- Livability +3.0/5.0
- Schools +2.9/10.0
- Rent growth +2.5/5.0
- Condition / age +2.5/5.0
- 1% rule +2.2/10.0
$291,950
🖨 Deal sheet 📄 Offer letter ✓ Due diligence
Key facts
- 8,787 sq ft lot
- 2 garage spots
- Built 2026
Neighborhood map
What this means for you Summary
Snapshot
- This is a 3-bed/2.5-bath land listed at $292k.
Deal economics
- At list price, monthly cash flow is $-143 ($-2k/yr) — negative.
- To cash-flow at today's rent, offer at most $267k (8.7% below list).
- To meet the 1% rule (rent ≥ 1% of price), the offer needs to be $210k (28.1% below list).
- Recommended offer: $210k (28.1% below list) — sets the bar for 1% rule.
Location & tenants
- Location reads 59/100 on livability (#1,135 in TX) — a working-class tenant base; expect higher turnover. Strengths: cost of living A+, housing A+, crime A-; Watch: amenities F, commute F, employment D-.
- Canutillo ISD (other): math 28% / reading 39% proficiency, ranked #542 of 826 in TX (top 66%) — families likely to look elsewhere, expect single-tenant / working-renter base with shorter leases; 71% free/reduced lunch — lower-income household profile, screen leases tightly.
- Zoned schools: Canutillo El (math 22% / reading 32%, grade F, #2,791 of 4,322 statewide, top 68%, 519 students, 82% FRL); Canutillo Middle (math 21% / reading 34%, grade F, #1,156 of 1,662 statewide, top 71%, 700 students, 64% FRL); Canutillo H S (math 36% / reading 41%, grade F, #866 of 1,632 statewide, top 54%, 1,642 students, 65% FRL) — zoned schools at 70% FRL track the district average.
- Market conditions: 30 active listings in the ZIP; 1 comparable units currently listed for rent nearby; 2,196 units permitted in El Paso County in 2024 (143 in 5+ unit buildings).
Forward outlook
- In year one you build about $10k of equity ($2k loan paydown + $8k appreciation (2.7% local appreciation)).
- El Paso County population projected at +10% by 2050 — modest demand growth; plan on rents tracking national, not racing it.
- By year 4, paydown + projected appreciation supports a ~$34k cash-out refi (75% LTV) — recoverable capital for the next deal without selling this one.
Negotiation context
- It's been on market 70 days — a 6% lower offer ($274k) is reasonable based on typical stale-listing flexibility.
Risks & watch-outs
- Climate carrying-cost: extreme-heat days projected 7→27/yr by 2055 (HVAC capex compounding) — expect insurance premiums to compound above CPI over the hold.
Questions for the listing agent
- What do current leases actually rent for vs. the listed asking? Can we see a recent rent roll and the last 12 months of T-12 income?
- It's been on market 70 days. Have you received any prior offers? Is the seller open to a 28% concession, seller financing, or rate buy-down credit?
- Why hasn't it sold? Are there any deal-killer items the seller is aware of (foundation, flood, title, zoning, code violations)?
- Is there a deadline driving the sale (1031 exchange, divorce, estate, relocation)? That informs how much negotiation room exists.
- Schools are F-rated, which usually means shorter tenancies and higher turnover. Who's the typical renter profile here, and what's been the actual vacancy rate?
- The area grade is low — what's the realistic commute time and amenity access for the typical tenant pool here? Any planned neighborhood developments (good or bad) we should know about?
- What's the average days-on-market for RENTAL listings here right now (not sales)? A rising rental-DOM trend means longer vacancies and softer asking-rent achievability than the comps imply.
- What's the recent tenant-quality profile in this submarket — average credit score on applications, eviction rate, late-payment / NSF rate, and stable-employment percentage? A property-management company in the area should have these aggregated.
- How much new for-sale + rental construction is in the pipeline within 1–3 miles? Heavy new supply typically softens prices + rents 12–24 months out; constrained supply supports both.
Investment metrics
- 1% rule
- 0.72% ✗
- Cap rate
- 5.71%
- Cash-on-cash
- -2.10%
- DSCR
- 0.91
- GRM
- 11.6
CMA / ARV
No comps found within radius.
Projected returns pro-forma
2.69% appreciation · 3.0% rent growth · sell at horizon
- IRR
- 4.6%
- Equity multiple
- 1.26×
- Total profit
- $21,171
- Equity at exit
- $126,177
- IRR
- 7.9%
- Equity multiple
- 2.15×
- Total profit
- $94,068
- Equity at exit
- $190,580
Cash invested: $81,746 (down + closing). Projections, not guarantees.
Landlord ↔ Tenant lean methodology
- Overall (STATE)
- 87 Strongly Landlord-Friendly
- State Texas
- 87 Strongly Landlord-Friendly · R+5
- County
- — inherits STATE
- City
- — inherits STATE
ZIP-level market 79821
- Home prices YoY
- 1.3%
- Active inventory
- 30
- Price-to-rent
- 11.6×
Monthly cashflow live
- Estimated rent
- $2,100 medium interval (Pro) →
- Mortgage (P&I)
- −$1,531
- Tax from tax record
- −$149 /mo · $1,792/yr
- Insurance
- −$122
- HOA
- −$0
- Vacancy / Maint / Mgmt
- −$441
- Net cashflow
- $-143
Break-even live
UW: 25.0% down · 7.5% · 30yr · 1.5% tax · 5.0% vac · 8.0% maint · 8.0% mgmt
Financing live
Cash to close
- Down payment
- $72,988
- Closing costs
- $8,758
- Reserves months
- —
- Total cash needed
- —
Loan-product check · same deal, 3 products live
Conventional
25% down · 7.5% · 30yr
- Down + closing
- —
- Monthly P&I
- —
- Monthly cashflow
- —
- DSCR
- —
- Eligible?
- —
Personal DTI + credit; lowest rate.
DSCR
20% down · 8.5% · 30yr
- Down + closing
- —
- Monthly P&I
- —
- Monthly cashflow
- —
- DSCR
- —
- Eligible?
- —
No personal income docs; deal must DSCR.
Hard money
10% down · 12.0% · 12mo
- Down + closing
- —
- Monthly P&I
- —
- Monthly cashflow
- —
- DSCR
- —
- Eligible?
- —
Short-term bridge; refi at stabilization.
Rent comps 1 comps
| Address | Beds | Baths | Sqft | Rent | $/sqft | DOM | Units | Dist |
|---|---|---|---|---|---|---|---|---|
| 355 Sol Ct Vinton, TX | 4.0 | 3.0 | 1932 | $2,100 | $1.09 | 23d | 1 | 0.52mi |
Listing history 2 events
-
2026-04-23status Pending
-
2026-02-11$291,950 Active
ⓘ Source: listings_history table (triggers on properties + properties_extension) + one-shot
backfill from property_details.listing_events for pre-trigger history.
Tax reassessment forecast TX · Resets to sale price
- Current annual tax
- $1,792 · $149/mo
- Projected year-2 tax
- $5,343 · $445/mo
- Expected delta
- +$3,551/yr (+$296/mo · 198.2%)
ⓘ Screening estimate from a state-policy table — verify with the county assessor before closing.
Climate risk First Street
- Flood 1/10 Low FEMA zone X · 0% chance over 30 yrs
- Wildfire 4/10 Moderate
- Heat 6/10 Major 7 d/yr ≥100°F today · 27 d/yr by 30 yrs out
- Wind 1/10 Low
- Air quality 2/10 Low 1 unhealthy d/yr today · 1 by 30 yrs out
Nearby sold comps map
Loading sold comps map…
Walkable amenities ~0.75 mi
Loading nearby amenities…
Taxation est. · year 1
- Rental income
- $25,200
- − Mortgage interest
- −$16,354
- − Property taxes
- −$1,792
- − Insurance
- −$1,460
- − Repairs & maintenance
- −$2,016
- − Management
- −$2,016
- − Depreciation
- −$8,493
- Taxable loss
- −$6,930
- Est. tax savings @ 24.0%
- +$1,663
- After-tax cash flow
- $-52/yr
For passive investors: Depreciation is non-cash, so a rental often shows a tax loss while cash-flowing — sheltering income. Rental losses are passive: they offset passive income freely, and up to $25,000/yr can offset ordinary (W-2) income if you actively participate and your MAGI is under $100k (phasing out to $0 by $150k); unused losses carry forward. On sale, claimed depreciation is recaptured at up to 25%, and gains may owe capital-gains tax (a 1031 exchange can defer both). Figures are a year-1 estimate at your 24.0% rate — not tax advice; consult a CPA.
Schools (NCES district)
- District
- Canutillo ISD
- NCES district ID
- 4812780
- Math proficiency
- 28% ▼ -23.00%
- Reading proficiency
- 39% ▼ -7.00%
- Median HH income
- $48,327
- Composite
- 28.91/100
- National rank
- #6636
- State rank
- #542 of 826 in TX
Livability — Vinton
- Score
- 59/100
- State rank
- #1135
- US rank
- #20035
Category grades
Schools grade is shown separately in the Schools card above.
Census & demographics
- Census place
- Vinton, TX
- Population (ZIP)
- 6,550
Population outlook (El Paso County) Hauer SSP2
- Today (2025)
- 897,899 people
- By 2030
- 922,694 · +2.8%
- By 2040
- 960,492 · +7.0%
- By 2050
- 982,919 · +9.5%
- By 2075
- 997,266 · +11.1%
- By 2100
- 900,630 · +0.3%
Race, ethnicity, and origin ACS 2023
- Neighborhood character
- Predominantly Hispanic (88%)
- Race & ethnicity
- Hispanic / Latino 88% Two or more races 28% White 8% Black 1%
- Hispanic origin (detail)
- Mexican 78%
- Foreign-born
- 26% · Canada
- Languages at home
- 25% English-only · Spanish 74%
Political lean MEDSL · El Paso
- 2024 margin
- D (+15.1) · D 57.0% · R 41.8% · Other 1.2%
- 2008→2024 swing
- -17.4pp toward R · 2008: 32.5pp · 2024: 15.1pp
- All cycles
- 2024: D+15.1 2020: D+35.1 2016: D+43.2 2012: D+32.6 2008: D+32.5
Not yet ingested
- Civics
- —
Market trends
- HPI YoY
- ▲ 2.69%
- Current HPI
- 207.1199
- Rent YoY
- —
- Metro
- —
- State GDP YoY
- ▲ 3.95%
- F500 in state
- 110
Industry mix (Fortune 500 HQ in TX)
| Industry | F500 HQs | Revenue |
|---|---|---|
| Energy | 16 | $1,198B |
|
||
| Technology | 5 | $198B |
|
||
| Engineering / Construction | 4 | $72B |
|
||
| Energy Services | 3 | $60B |
|
||
| Utilities | 3 | $41B |
|
||
| Healthcare | 2 | $330B |
|
||
Price history
2 events — show timeline
- 2026-04-23 Pending — GEPARMLS
- 2026-02-11 Listed $291,950 GEPARMLS
Cash-flow waterfall
monthlySold comps — $/sqft
last 12 mo · ≤1 miLoading sold comps…