 🔨 Auction
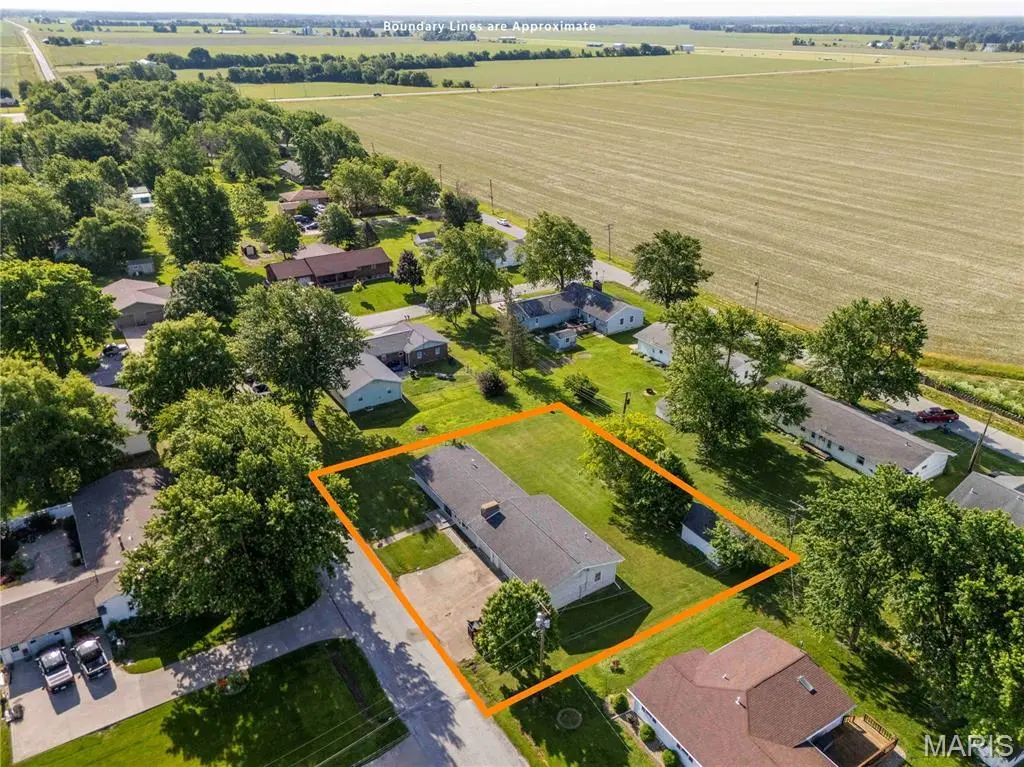
507 Hope St · Monroe City, MO
Flood risk 1/10 · Minimal
- FEMA flood zone
- X (unshaded)
- Chance of flooding over 30 yrs
- 0.0%
- Est. flood insurance / yr
- $507 – $1,088
Fire risk 2/10 · Minimal
- Est. fire insurance / yr
- $1,054 – $1,958
Heat risk 4/10 · Minor
- Hot days now (above 107°F)
- 7 days/yr
- Hot days in 30 yrs
- 18 days/yr
Wind risk 2/10 · Minimal
- Chance of severe wind over 30 yrs
- 0.0%
Air-quality risk 1/10 · Minimal
- Unhealthy air days now
- 0 days/yr
- Unhealthy air days in 30 yrs
- 0 days/yr
Risk factors via First Street. Map © Google.
Why this score? — see what drove the C- grade
The composite is a weighted blend of 9 inputs, each scored 0–100. Each bar is that input's sub-score; the figure is the points it added to the 100-point composite (weight × sub-score).
- Cash flow +15.0/30.0
- ARV discount +7.5/15.0
- Appreciation +6.9/10.0
- 1% rule +5.0/10.0
- DSCR +5.0/10.0
- Schools +4.1/10.0
- Livability +3.2/5.0
- Rent growth +2.5/5.0
- Condition / age +2.5/5.0
$1
🖨 Deal sheet 📄 Offer letter ✓ Due diligence
Listing remarks
AUCTION LISTING - List price is not indicative of Seller’s final reserve amount. This listing is part of an online bidding event. This sale will be executed with a no-contingency contract provided by brokerage representing the Seller. See MLS Supplement Document for complete details. WHY IS THIS HOME BEING AUCTIONED? The seller has chosen to sell their home by auction because they want a defined timeline and a clean close, not because they have something to hide. We are providing a full inspection report, seller's disclosure, home warranty, new survey and many other options to offer full transparency and provide comfort to the prospective buyer. Located on a quiet cul-de-sac street in
Key facts
- Quiet cul-de-sac
- Unfinished basement
- Large yard
Tags
Property features AI
Exterior
- Parking: Attached garage (1 car)
- Utilities: Public water; Public sewer; 220-volt electric service; Electricity, sewer and water connected
- Home design: Single-family residence; One level
- Construction: Frame construction
- Exterior features: Front yard and back yard; Located on a cul-de-sac; Paved lot access
Interior
- Kitchen: Kitchen on main level (approx. 22 x 12)
- Bedrooms: 3 bedrooms (all on the main level)
- Bathrooms: 1 full bathroom (main level); 1 half bathroom (main level)
- Heating & cooling: Central air; Other type of heating
- Interior features: Basement; Wood-burning fireplace
Neighborhood map
What this means for you Summary
Snapshot
- This is a 3-bed/1.5-bath other listed at $1.
Deal economics
- At list price, monthly cash flow is $880 ($11k/yr) — positive.
- The deal already cash-flows at list — no discount required.
- Meets the 1% rule at list price ($1k rent vs $1).
- Cap rate 1055785.6% vs local median 4.0% in Monroe City — top-decile yield for the area; either an underpriced asset or a hidden risk that comps aren't pricing in. Stress-test before assuming the spread holds.
Location & tenants
- Location reads 64/100 on livability (#303 in MO) — a middle-class / working-renter tenant base. Strengths: cost of living A+, housing A+, crime A-; Watch: employment C-, amenities F, commute F.
- Monroe City R-I (rural): math 47% / reading 50% proficiency, ranked #58 of 324 in MO (top 18%) — families likely to look elsewhere, expect single-tenant / working-renter base with shorter leases.
- Zoned schools: Monroe City Elem. (math 57% / reading 47%, grade C-, #231 of 1,115 statewide, top 24%, 316 students, 57% FRL); Monroe City R-I High (math 42% / reading 47%, grade F, #179 of 521 statewide, top 39%, 257 students, 37% FRL) — zoned schools at 47% FRL track the district average.
- Market conditions: 64 active listings in the ZIP; 2 units permitted in Monroe County in 2024 (0 in 5+ unit buildings).
Forward outlook
- Monroe County population projected at -24% by 2050 — secular population decline; favor cash flow + early exit over multi-decade hold.
- At projected returns (3.8% appreciation + 3.0% rent growth), your $0 cash investment doubles in ~1 year — after that, you're playing with house money.
Negotiation context
- Only 7 days on market — expect competitive offers; lowballing is unlikely to land.
Questions for the listing agent
- Built in 1972 — when were the roof, HVAC, electrical panel, plumbing, and water heater last replaced?
- Is there a deadline driving the sale (1031 exchange, divorce, estate, relocation)? That informs how much negotiation room exists.
- What's the average days-on-market for RENTAL listings here right now (not sales)? A rising rental-DOM trend means longer vacancies and softer asking-rent achievability than the comps imply.
- What's the recent tenant-quality profile in this submarket — average credit score on applications, eviction rate, late-payment / NSF rate, and stable-employment percentage? A property-management company in the area should have these aggregated.
- How much new for-sale + rental construction is in the pipeline within 1–3 miles? Heavy new supply typically softens prices + rents 12–24 months out; constrained supply supports both.
Investment metrics
- 1% rule
- 111370.00% ✓
- Cap rate
- 1055785.60%
- Cash-on-cash
- 3770640.38%
- DSCR
- 167773.28
- GRM
- 0.0
CMA / ARV
No comps found within radius.
Projected returns pro-forma
3.84% appreciation · 3.0% rent growth · sell at horizon
- IRR
- —
- Equity multiple
- 200190.01×
- Total profit
- $56,053
- Equity at exit
- $0
- IRR
- —
- Equity multiple
- 432264.58×
- Total profit
- $121,034
- Equity at exit
- $1
Cash invested: $0 (down + closing). Projections, not guarantees.
Landlord ↔ Tenant lean methodology
- Overall (STATE)
- 81 Strongly Landlord-Friendly
- State Missouri
- 81 Strongly Landlord-Friendly · R+10
- County
- — inherits STATE
- City
- — inherits STATE
ZIP-level market 63456
- Home prices YoY
- 1.8%
- Active inventory
- 64
Monthly cashflow live
- Estimated rent
- $1,114 medium interval (Pro) →
- Mortgage (P&I)
- −$0
- Tax est. 1.5%
- −$0 /mo · $0/yr
- Insurance
- −$0
- HOA
- −$0
- Vacancy / Maint / Mgmt
- −$234
- Net cashflow
- $880
Break-even live
UW: 25.0% down · 7.5% · 30yr · 1.5% tax · 5.0% vac · 8.0% maint · 8.0% mgmt
Financing live
Cash to close
- Down payment
- $0
- Closing costs
- $0
- Reserves months
- —
- Total cash needed
- —
Loan-product check · same deal, 3 products live
Conventional
25% down · 7.5% · 30yr
- Down + closing
- —
- Monthly P&I
- —
- Monthly cashflow
- —
- DSCR
- —
- Eligible?
- —
Personal DTI + credit; lowest rate.
DSCR
20% down · 8.5% · 30yr
- Down + closing
- —
- Monthly P&I
- —
- Monthly cashflow
- —
- DSCR
- —
- Eligible?
- —
No personal income docs; deal must DSCR.
Hard money
10% down · 12.0% · 12mo
- Down + closing
- —
- Monthly P&I
- —
- Monthly cashflow
- —
- DSCR
- —
- Eligible?
- —
Short-term bridge; refi at stabilization.
Listing history 7 events
-
2026-06-18days on market $1 Active 7 DOM
-
2026-06-17days on market $1 Active 6 DOM
-
2026-06-16days on market $1 Active 5 DOM
-
2026-06-15days on market $1 Active 4 DOM
-
2026-06-13days on market $1 Active 2 DOM
-
2026-06-12remarks 693-char remark
-
2026-06-12$1 Active 1 DOM
ⓘ Source: listings_history table (triggers on properties + properties_extension) + one-shot
backfill from property_details.listing_events for pre-trigger history.
Climate risk First Street
- Flood 1/10 Low FEMA zone X (unshaded) · 0% chance over 30 yrs
- Wildfire 2/10 Low
- Heat 4/10 Moderate 7 d/yr ≥107°F today · 18 d/yr by 30 yrs out
- Wind 2/10 Low 0% chance of damaging wind over 30 yrs
- Air quality 1/10 Low 0 unhealthy d/yr today · 0 by 30 yrs out
Nearby sold comps map
Loading sold comps map…
Walkable amenities ~0.75 mi
Loading nearby amenities…
Taxation est. · year 1
- Rental income
- $13,364
- − Mortgage interest
- −$0
- − Property taxes
- −$0
- − Insurance
- −$0
- − Repairs & maintenance
- −$1,069
- − Management
- −$1,069
- − Depreciation
- −$0
- Taxable income
- $11,226
- Est. tax owed @ 24.0%
- −$2,694
- After-tax cash flow
- $7,864/yr
For passive investors: Depreciation is non-cash, so a rental often shows a tax loss while cash-flowing — sheltering income. Rental losses are passive: they offset passive income freely, and up to $25,000/yr can offset ordinary (W-2) income if you actively participate and your MAGI is under $100k (phasing out to $0 by $150k); unused losses carry forward. On sale, claimed depreciation is recaptured at up to 25%, and gains may owe capital-gains tax (a 1031 exchange can defer both). Figures are a year-1 estimate at your 24.0% rate — not tax advice; consult a CPA.
Schools (NCES district)
- District
- Monroe City R-I
- NCES district ID
- 2921210
- Math proficiency
- 47% ▲ 4.00%
- Reading proficiency
- 50% ▲ 4.00%
- Median HH income
- $43,684
- Composite
- 40.93/100
- National rank
- #3610
- State rank
- #58 of 324 in MO
Livability — Monroe City
- Score
- 64/100
- State rank
- #303
- US rank
- #13875
Category grades
Schools grade is shown separately in the Schools card above.
Census & demographics
- Census place
- Monroe City, MO
- City population
- 4,938
- Population (ZIP)
- 4,938
Population outlook (Monroe County) Hauer SSP2
- Today (2025)
- 7,974 people
- By 2030
- 7,588 · -4.8%
- By 2040
- 6,815 · -14.5%
- By 2050
- 6,089 · -23.6%
- By 2075
- 4,812 · -39.7%
- By 2100
- 3,737 · -53.1%
Race, ethnicity, and origin ACS 2023
- Neighborhood character
- Predominantly White (89%)
- Race & ethnicity
- White 89% Black 7% Two or more races 3% Hispanic / Latino 1%
- Common ancestry
- Lithuanian 3% Slovak 2% Iranian 1%
- Foreign-born
- 1%
- Languages at home
- 99% English-only · Spanish 0%
Political lean MEDSL · Monroe
- 2024 margin
- Solid R (+59.9) · D 19.6% · R 79.4%
- 2008→2024 swing
- -40.6pp toward R · 2008: -19.2pp · 2024: -59.9pp
- All cycles
- 2024: R+59.9 2020: R+56.7 2016: R+55.6 2012: R+28.7 2008: R+19.2
Not yet ingested
- Civics
- —
Market trends
- HPI YoY
- ▲ 3.84%
- Current HPI
- 216.0874
- Rent YoY
- —
- Metro
- —
- State GDP YoY
- ▲ 1.84%
- F500 in state
- 20
Industry mix (Fortune 500 HQ in MO)
| Industry | F500 HQs | Revenue |
|---|---|---|
| Healthcare | 1 | $163B |
|
||
| Insurance | 1 | $21B |
|
||
| Industrial Technology | 1 | $17B |
|
||
| Retail | 1 | $16B |
|
||
| Industrial Distribution | 1 | $10B |
|
||
| Utilities | 1 | $9B |
|
||
Property tax history
+3.0%/yrLatest (2025): $1,151 · +9.0% YoY. Source: county tax records.
Cash-flow waterfall
monthlySold comps — $/sqft
last 12 mo · ≤1 miLoading sold comps…