351 Essex Rd · Vermilion, OH
Flood risk 1/10 · Minimal
- FEMA flood zone
- X (unshaded)
- Chance of flooding over 30 yrs
- 0.0%
- Est. flood insurance / yr
- $473 – $860
Fire risk 1/10 · Minimal
- Est. fire insurance / yr
- $713 – $1,323
Heat risk 3/10 · Minor
- Hot days now (above 96°F)
- 7 days/yr
- Hot days in 30 yrs
- 17 days/yr
Wind risk 1/10 · Minimal
- Chance of severe wind over 30 yrs
- —
Air-quality risk 3/10 · Minor
- Unhealthy air days now
- 2 days/yr
- Unhealthy air days in 30 yrs
- 3 days/yr
Risk factors via First Street. Map © Google.
Why this score? — see what drove the F grade
The composite is a weighted blend of 9 inputs, each scored 0–100. Each bar is that input's sub-score; the figure is the points it added to the 100-point composite (weight × sub-score).
- Cash flow +13.0/30.0
- Schools +5.0/10.0
- Livability +4.0/5.0
- DSCR +3.9/10.0
- 1% rule +3.0/10.0
- Rent growth +2.5/5.0
- Condition / age +2.5/5.0
- ARV discount +0.0/15.0
- Appreciation +0.0/10.0
$250,000
🖨 Deal sheet 📄 Offer letter ✓ Due diligence
Listing remarks MLS
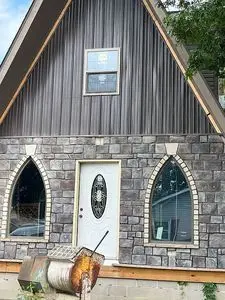
A-frame style with 3 bedrooms, basement, deck close to Lake Erie.
Key facts
- Built 1980
- Listed 23 days
Neighborhood map
What this means for you Summary
Snapshot
- This is a 4-bed/1.5-bath single-family listed at $250k.
Deal economics
- At list price, monthly cash flow is $-13 ($-153/yr) — negative.
- To cash-flow at today's rent, offer at most $248k (0.9% below list).
- To meet the 1% rule (rent ≥ 1% of price), the offer needs to be $199k (20.3% below list).
- Recommended offer: $199k (20.3% below list) — sets the bar for 1% rule.
- Cap rate 6.2% vs local median 5.0% in Vermilion — meaningfully above typical; check what's discounted (condition, days-on-market, listing class) to confirm the premium yield is real.
Location & tenants
- Location reads 81/100 on livability (#96 in OH, #1,481 nationally) — a professional / high-income tenant draw. Strengths: crime A+, cost of living A+, housing A+; Watch: commute F.
- Vermilion Local (suburban): math 56% / reading 60% proficiency, ranked #316 of 656 in OH (top 48%) — acceptable for families but not a draw, mixed tenant base, ~2y average lease.
- Market conditions: 142 active listings in the ZIP; 1,098 units permitted in Lorain County in 2024 (20 in 5+ unit buildings).
- This rent runs 33% of the median local income ($72k/yr) — at the standard rent-burdened threshold; future hikes will face affordability resistance.
Forward outlook
- Local home prices are declining (-3.0%/yr); year-one equity from $2k of loan paydown is wiped out by about $8k of value loss. Plan a longer hold.
Negotiation context
- It's been on market 23 days — a 2% lower offer ($246k) is reasonable based on typical stale-listing flexibility.
- 6 sale attempts since 33y ago with the ask held roughly flat each time — persistent listings suggest the price (not the market) is what's stuck; bring a comps-based counter.
- Current owner paid $10k; list at $250k implies a 2400% gain — meaningful room to come down on a strong offer.
Questions for the listing agent
- What do current leases actually rent for vs. the listed asking? Can we see a recent rent roll and the last 12 months of T-12 income?
- Is there a deadline driving the sale (1031 exchange, divorce, estate, relocation)? That informs how much negotiation room exists.
- Schools are B-rated — typically a magnet for longer-tenancy family renters. What's the average tenant stay here, and is there a school-zone premium baked into asking?
- The area grade is low — what's the realistic commute time and amenity access for the typical tenant pool here? Any planned neighborhood developments (good or bad) we should know about?
- What's the average days-on-market for RENTAL listings here right now (not sales)? A rising rental-DOM trend means longer vacancies and softer asking-rent achievability than the comps imply.
- What's the recent tenant-quality profile in this submarket — average credit score on applications, eviction rate, late-payment / NSF rate, and stable-employment percentage? A property-management company in the area should have these aggregated.
- How much new for-sale + rental construction is in the pipeline within 1–3 miles? Heavy new supply typically softens prices + rents 12–24 months out; constrained supply supports both.
Investment metrics
- 1% rule
- 0.80% ✗
- Cap rate
- 6.23%
- Cash-on-cash
- -0.22%
- DSCR
- 0.99
- GRM
- 10.5
CMA / ARV
- ARV (on-the-fly)
- $166,980
- Comps found
- 10
Show comp detail 10 sales within ~0.75 mi
| Address | Dist | Beds/Ba | Sqft | Sold | Price | $/sf | Match |
|---|---|---|---|---|---|---|---|
| 230 Fairfax Rd | 0.15mi | 3/1.0 (-1) | 1,056 (+4%) | 7mo | $194,000 | $184 | 73 |
| 208 Overlook Rd | 0.31mi | 4/1.0 | 1,054 (+4%) | 10mo | $82,500 | $78 | 68 |
| 387 Harcourt Rd | 0.14mi | 3/1.0 (-1) | 912 (-10%) | 2mo | $209,900 | $230 | 68 |
| 678 Highbridge Rd | 0.37mi | 3/1.5 (-1) | 1,056 (+4%) | 10mo | $190,000 | $180 | 63 |
| 236 Devonshire Rd | 0.23mi | 3/1.0 (-1) | 936 (-8%) | 9mo | $180,000 | $192 | 62 |
| 321 Overlook Rd | 0.31mi | 3/1.0 (-1) | 912 (-10%) | 11mo | $116,000 | $127 | 53 |
| 348 Elberta Dr | 0.69mi | 3/1.0 (-1) | 1,032 (+2%) | 9mo | $170,000 | $165 | 50 |
| 279 Kensington Rd | 0.52mi | 3/1.0 (-1) | 884 (-13%) | 6mo | $110,000 | $124 | 42 |
| 278 Mornington Rd | 0.37mi | 3/1.0 (-1) | 884 (-13%) | 17mo | $140,450 | $159 | 40 |
| 332 Claremont Rd | 0.58mi | 3/2.0 (-1) | 1,142 (+13%) | 14mo | $170,000 | $149 | 33 |
Match score weights: distance 35% · size 25% · config 20% · recency 20%. Top-matched comps best support the ARV.
Projected returns pro-forma
-3.0% appreciation · 3.0% rent growth · sell at horizon
- IRR
- -16.7%
- Equity multiple
- 0.41×
- Total profit
- $-41,377
- Equity at exit
- $37,276
- IRR
- -8.6%
- Equity multiple
- 0.47×
- Total profit
- $-37,302
- Equity at exit
- $21,615
Cash invested: $70,000 (down + closing). Projections, not guarantees.
Landlord ↔ Tenant lean methodology
- Overall (STATE)
- 73 Landlord-Friendly
- State Ohio
- 73 Landlord-Friendly · R+6
- County
- — inherits STATE
- City
- — inherits STATE
ZIP-level market 44089
- Active inventory
- 142
- Price-to-rent
- 10.5×
Monthly cashflow live
- Estimated rent
- $1,993 medium interval (Pro) →
- Mortgage (P&I)
- −$1,311
- Tax from tax record
- −$172 /mo · $2,065/yr
- Insurance
- −$104
- HOA
- −$0
- Vacancy / Maint / Mgmt
- −$419
- Net cashflow
- $-13
Break-even live
UW: 25.0% down · 7.5% · 30yr · 1.5% tax · 5.0% vac · 8.0% maint · 8.0% mgmt
Financing live
Cash to close
- Down payment
- $62,500
- Closing costs
- $7,500
- Reserves months
- —
- Total cash needed
- —
Loan-product check · same deal, 3 products live
Conventional
25% down · 7.5% · 30yr
- Down + closing
- —
- Monthly P&I
- —
- Monthly cashflow
- —
- DSCR
- —
- Eligible?
- —
Personal DTI + credit; lowest rate.
DSCR
20% down · 8.5% · 30yr
- Down + closing
- —
- Monthly P&I
- —
- Monthly cashflow
- —
- DSCR
- —
- Eligible?
- —
No personal income docs; deal must DSCR.
Hard money
10% down · 12.0% · 12mo
- Down + closing
- —
- Monthly P&I
- —
- Monthly cashflow
- —
- DSCR
- —
- Eligible?
- —
Short-term bridge; refi at stabilization.
Listing history 30 events
-
2026-06-18days on market $250,000 Active 23 DOM
-
2026-06-17days on market $250,000 Active 22 DOM
-
2026-06-16days on market $250,000 Active 21 DOM
-
2026-06-15days on market $250,000 Active 20 DOM
-
2026-06-13days on market $250,000 Active 18 DOM
-
2026-06-09days on market $250,000 Active 14 DOM
-
2026-06-08days on market $250,000 Active 13 DOM
-
2026-06-07days on market $250,000 Active 12 DOM
-
2026-06-05days on market $250,000 Active 9 DOM
-
2026-06-03days on market $250,000 Active 8 DOM
-
2026-06-02days on market $250,000 Active 7 DOM
-
2026-06-01days on market $250,000 Active 6 DOM
-
2026-05-31days on market $250,000 Active 5 DOM
-
2026-05-26$250,000 Active
-
2015-01-05soldstatus $10,000 65-char remark
Show marketing remark (65 chars)
A-frame style with 3 bedrooms, basement, deck close to Lake Erie.
-
2014-12-05historical 65-char remark
Show marketing remark (65 chars)
A-frame style with 3 bedrooms, basement, deck close to Lake Erie.
-
2014-11-06$9,500 65-char remark
Show marketing remark (65 chars)
A-frame style with 3 bedrooms, basement, deck close to Lake Erie.
-
2006-05-19soldstatus $70,500 204-char remark
Show marketing remark (204 chars)
Great A Frame Style 4 Bedroom House Priced Well Under Value! Sliding Doors Off Great Room To Deck. Basement Has Fourth Bedroom And Bonus/ Rec Room. Lots Of Square Footage For A Great Price. View It Today!
-
2006-05-19soldstatus $70,500
Show marketing remark (204 chars)
Great A Frame Style 4 Bedroom House Priced Well Under Value! Sliding Doors Off Great Room To Deck. Basement Has Fourth Bedroom And Bonus/ Rec Room. Lots Of Square Footage For A Great Price. View It Today!
-
2006-05-19soldstatus $70,500
Show marketing remark (204 chars)
Great A Frame Style 4 Bedroom House Priced Well Under Value! Sliding Doors Off Great Room To Deck. Basement Has Fourth Bedroom And Bonus/ Rec Room. Lots Of Square Footage For A Great Price. View It Today!
-
2006-04-01$71,500 204-char remark
Show marketing remark (204 chars)
Great A Frame Style 4 Bedroom House Priced Well Under Value! Sliding Doors Off Great Room To Deck. Basement Has Fourth Bedroom And Bonus/ Rec Room. Lots Of Square Footage For A Great Price. View It Today!
-
1999-09-24soldstatus $67,000
-
1999-09-24soldstatus $67,000
-
1999-06-30$69,900
-
1994-01-12soldstatus $57,900
-
1993-12-30soldstatus $57,900
-
1993-10-13$59,900
-
1993-10-12historical
-
1993-04-12$59,875
-
1989-12-29soldstatus $43,500
ⓘ Source: listings_history table (triggers on properties + properties_extension) + one-shot
backfill from property_details.listing_events for pre-trigger history.
Tax reassessment forecast OH · Partial reset (capped growth)
- Current annual tax
- $2,065 · $172/mo
- Projected year-2 tax
- $2,983 · $249/mo
- Expected delta
- +$917/yr (+$76/mo · 44.4%)
ⓘ Screening estimate from a state-policy table — verify with the county assessor before closing.
Climate risk First Street
- Flood 1/10 Low FEMA zone X (unshaded) · 0% chance over 30 yrs
- Wildfire 1/10 Low
- Heat 3/10 Moderate 7 d/yr ≥96°F today · 17 d/yr by 30 yrs out
- Wind 1/10 Low
- Air quality 3/10 Moderate 2 unhealthy d/yr today · 3 by 30 yrs out
Nearby sold comps map
Loading sold comps map…
Walkable amenities ~0.75 mi
Loading nearby amenities…
Taxation est. · year 1
- Rental income
- $23,918
- − Mortgage interest
- −$14,004
- − Property taxes
- −$2,065
- − Insurance
- −$1,250
- − Repairs & maintenance
- −$1,913
- − Management
- −$1,913
- − Depreciation
- −$7,273
- Taxable loss
- −$4,501
- Est. tax savings @ 24.0%
- +$1,080
- After-tax cash flow
- $928/yr
For passive investors: Depreciation is non-cash, so a rental often shows a tax loss while cash-flowing — sheltering income. Rental losses are passive: they offset passive income freely, and up to $25,000/yr can offset ordinary (W-2) income if you actively participate and your MAGI is under $100k (phasing out to $0 by $150k); unused losses carry forward. On sale, claimed depreciation is recaptured at up to 25%, and gains may owe capital-gains tax (a 1031 exchange can defer both). Figures are a year-1 estimate at your 24.0% rate — not tax advice; consult a CPA.
Schools (NCES district)
- District
- Vermilion Local
- NCES district ID
- 3904682
- Math proficiency
- 56% ▼ -13.00%
- Reading proficiency
- 60% ▼ -5.00%
- Median HH income
- $52,091
- Composite
- 49.61/100
- National rank
- #1981
- State rank
- #316 of 656 in OH
Livability — Vermilion
- Score
- 81/100
- State rank
- #96
- US rank
- #1481
Category grades
Schools grade is shown separately in the Schools card above.
Census & demographics
- Census place
- Vermilion, OH
- County
- Erie · 78,232 people
- Metro
- Sandusky, OH
- Population (ZIP)
- 15,873
- Household income
- $72,045
- Rent vs Own
- Severe rent burden
- 5.8
Population outlook (Lorain County) Hauer SSP2
- Today (2025)
- 314,924 people
- By 2030
- 317,546 · +0.8%
- By 2040
- 317,962 · +1.0%
- By 2050
- 312,872 · -0.7%
- By 2075
- 301,806 · -4.2%
- By 2100
- 278,271 · -11.6%
Race, ethnicity, and origin ACS 2023
- Neighborhood character
- Predominantly White (93%)
- Race & ethnicity
- White 93% Hispanic / Latino 4% Two or more races 3%
- Common ancestry
- Romanian 7% Lithuanian 4% Slovak 2%
- Foreign-born
- 1%
- Languages at home
- 98% English-only · Other Indo-European 1%
Political lean MEDSL · Lorain
- 2024 margin
- Lean R (+5.7) · D 46.7% · R 52.4%
- 2008→2024 swing
- -23.6pp toward R · 2008: 17.9pp · 2024: -5.7pp
- All cycles
- 2024: R+5.7 2020: R+2.5 2016: R+0.3 2012: D+14.4 2008: D+17.9
Not yet ingested
- Civics
- —
Market trends
- HPI YoY
- ▼ -122.76%
- Current HPI
- 206.8223
- Rent YoY
- —
- Metro
- —
- State GDP YoY
- ▲ 1.98%
- F500 in state
- 48
Industry mix (Fortune 500 HQ in OH)
| Industry | F500 HQs | Revenue |
|---|---|---|
| Insurance | 3 | $145B |
|
||
| Industrial Machinery | 3 | $49B |
|
||
| Financial Services | 3 | $24B |
|
||
| Consumer Goods | 2 | $93B |
|
||
| Aerospace / Defense | 2 | $47B |
|
||
| Utilities | 2 | $33B |
|
||
Price history
+474.7% since first listed17 events — show timeline
- 2026-05-26 Listed $250,000 FSBO.com
- 2015-01-05 Sold (MLS) $10,000 MLSNOW
- 2014-12-05 Listing Removed — MLSNOW
- 2014-11-06 Listed $9,500 MLSNOW
- 2006-05-19 Sold (Public Records) $70,500 Public Records
- 2006-05-19 Sold (Public Records) $70,500 Public Records
- 2006-05-19 Sold (MLS) $70,500 MLSNOW
- 2006-04-01 Listed $71,500 MLSNOW
- 1999-09-24 Sold (Public Records) $67,000 Public Records
- 1999-09-24 Sold (MLS) $67,000 MLSNOW
- 1999-06-30 Listed $69,900 MLSNOW
- 1994-01-12 Sold (MLS) $57,900 MLSNOW
- 1993-12-30 Sold (Public Records) $57,900 Public Records
- 1993-10-13 Listed $59,900 MLSNOW
- 1993-10-12 Listing Removed — MLSNOW
- 1993-04-12 Listed $59,875 MLSNOW
- 1989-12-29 Sold (Public Records) $43,500 Public Records
Property tax history
+3.1%/yrLatest (2025): $2,065 · +0.2% YoY. Source: county tax records.
Cash-flow waterfall
monthlySold comps — $/sqft
last 12 mo · ≤1 miLoading sold comps…