 🏷️ Likely Rental
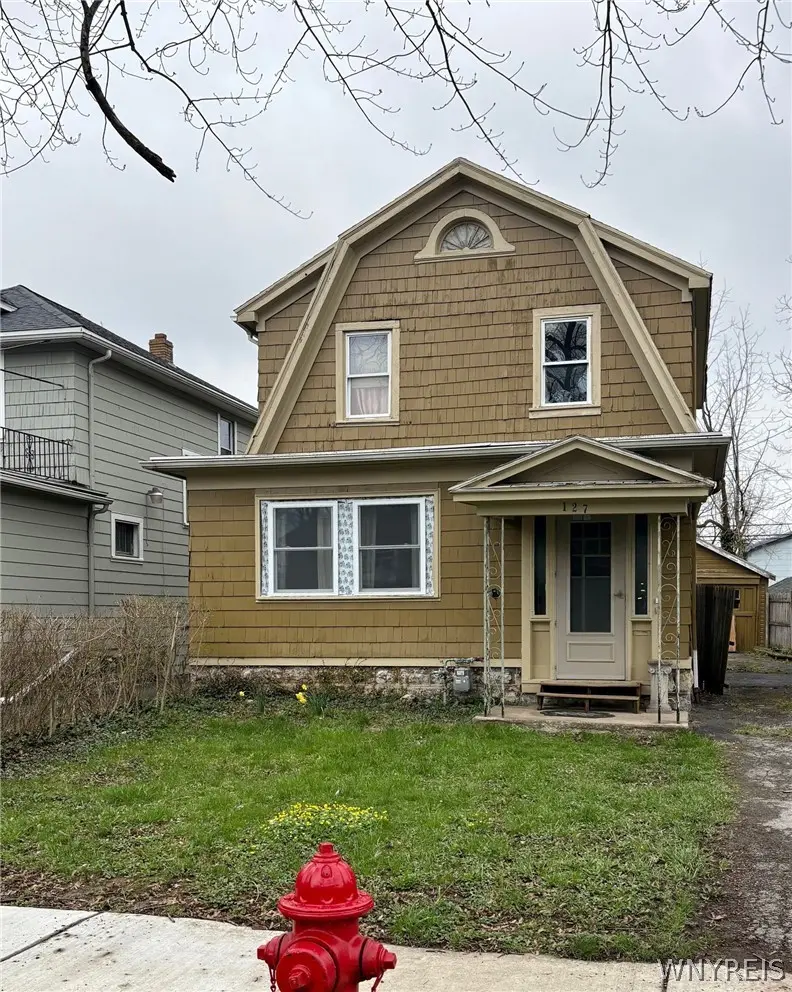
127 W Northrup Pl · Buffalo, NY
Flood risk 1/10 · Minimal
- FEMA flood zone
- X (unshaded)
- Chance of flooding over 30 yrs
- 0.0%
- Est. flood insurance / yr
- $473 – $860
Fire risk 1/10 · Minimal
- Est. fire insurance / yr
- $691 – $1,283
Heat risk 2/10 · Minimal
- Hot days now (above 92°F)
- 7 days/yr
- Hot days in 30 yrs
- 14 days/yr
Wind risk 1/10 · Minimal
- Chance of severe wind over 30 yrs
- —
Air-quality risk 3/10 · Minor
- Unhealthy air days now
- 2 days/yr
- Unhealthy air days in 30 yrs
- 3 days/yr
Risk factors via First Street. Map © Google.
Why this score? — see what drove the B grade
The composite is a weighted blend of 9 inputs, each scored 0–100. Each bar is that input's sub-score; the figure is the points it added to the 100-point composite (weight × sub-score).
- Cash flow +28.3/30.0
- ARV discount +15.0/15.0
- DSCR +10.0/10.0
- 1% rule +7.8/10.0
- Rent growth +4.0/5.0
- Livability +3.9/5.0
- Schools +3.3/10.0
- Condition / age +2.8/5.0
- Appreciation +0.0/10.0
$179,900
🖨 Deal sheet 📄 Offer letter ✓ Due diligence
Listing remarks
Charming 5 bedroom Dutch Colonial for sale in the University district of Buffalo, NY. Freshly painted exterior, laminate floors, , eat in kitchen, and spacious living room w/ sun room, 1 bedrooms, full bath on the 1st floor . Good-sized lot with off-street parking w/ 2 car detached garage. Patio door leads to a wooded deck and a fenced yard. Basement with glass block windows, copper plumbing, updated furnace, AC may need freon. Great location on a quiet street, walking distance to the University of Buffalo & , Buffalo Subway system, bike path, restaurants and shopping. Currently tenant occupied, paying $2,200 per month. This would be great investment or owner occupied property
Key facts
- Laminate floors
- Eat in kitchen
- Front porch
Tags
Property features AI
Exterior
- Parking: Detached 2-car garage
- Utilities: Public water (connected); Community/coop sewer; Circuit breaker electrical service
- Home design: Two-story home; Existing (previously built) property; City street frontage; Rectangular residential lot, near public transit
- Construction: Frame construction; Stone foundation; Asphalt roof; Copper and PEX plumbing
- Exterior features: Blacktop driveway; Deck
Interior
- Kitchen: Gas oven; Gas range; Eat-in kitchen
- Bedrooms: One main-level bedroom; Three additional bedrooms on the second level
- Flooring: Carpet; Ceramic tile; Laminate; Varies
- Bathrooms: Two full bathrooms; One main-level bathroom
- Heating & cooling: Gas forced-air heating; Central air conditioning
- Interior features: Ceiling fan(s); Entrance foyer; Eat-in kitchen; Separate/formal living room; Full basement
- Laundry & utility: Laundry in basement; Gas water heater
Neighborhood map
What this means for you Summary
Snapshot
- This is a 5-bed/2.0-bath single-family listed at $180k. Condition is rated average.
Deal economics
- At list price, monthly cash flow is $575 ($7k/yr) — positive.
- The deal already cash-flows at list — no discount required.
- Meets the 1% rule at list price ($2k rent vs $180k).
- Recommended offer: $175k (3.0% below list) — sets the bar for market timing.
- Cap rate 10.1% vs local median 8.0% in Buffalo — meaningfully above typical; check what's discounted (condition, days-on-market, listing class) to confirm the premium yield is real.
Location & tenants
- Location reads 77/100 on livability (#195 in NY, #3,011 nationally) — a middle-class / working-renter tenant base. Strengths: commute A+, housing A+, health & safety A+; Watch: crime F, employment D-.
- Buffalo City School District (urban): math 41% / reading 40% proficiency, ranked #535 of 590 in NY (top 91%) — families likely to look elsewhere, expect single-tenant / working-renter base with shorter leases; 75% free/reduced lunch — lower-income household profile, screen leases tightly.
- Market conditions: Rents rising fast (+5.8%/yr); 90 active listings in the ZIP; 7 comparable units currently listed for rent nearby; rentals at typical pace (median 15d on market — plan ~3-4 weeks tenant-placement turnaround); 1,244 units permitted in Erie County in 2024 (563 in 5+ unit buildings).
- At $2,302/mo this rent would consume 47% of the median local household income ($58k/yr) (locally 1820% of renters already pay >50% of income on rent) — very limited rent-growth headroom before tenants either downsize or default.
Forward outlook
- Local home prices are declining (-3.0%/yr); year-one equity from $1k of loan paydown is wiped out by about $5k of value loss. Plan a longer hold.
- At projected returns (-3.0% appreciation + 5.8% rent growth), your $50k cash investment doubles in ~7 years — after that, you're playing with house money.
Negotiation context
- It's been on market 40 days — a 3% lower offer ($175k) is reasonable based on typical stale-listing flexibility.
Risks & watch-outs
- Watch-outs: built in 1920 — expect roof / HVAC / electrical / plumbing capex.
Questions for the listing agent
- It's been on market 40 days. Have you received any prior offers? Is the seller open to a 3% concession, seller financing, or rate buy-down credit?
- Built in 1920 — when were the roof, HVAC, electrical panel, plumbing, and water heater last replaced?
- Is there a deadline driving the sale (1031 exchange, divorce, estate, relocation)? That informs how much negotiation room exists.
- Crime grade is F in this area — have there been break-ins, vandalism, or insurance claims at this property in the last 3 years? What carrier currently insures it and at what premium?
- What's the average days-on-market for RENTAL listings here right now (not sales)? A rising rental-DOM trend means longer vacancies and softer asking-rent achievability than the comps imply.
- What's the recent tenant-quality profile in this submarket — average credit score on applications, eviction rate, late-payment / NSF rate, and stable-employment percentage? A property-management company in the area should have these aggregated.
- How much new for-sale + rental construction is in the pipeline within 1–3 miles? Heavy new supply typically softens prices + rents 12–24 months out; constrained supply supports both.
Investment metrics
- 1% rule
- 1.28% ✓
- Cap rate
- 10.13%
- Cash-on-cash
- 13.71%
- DSCR
- 1.61
- GRM
- 6.5
CMA / ARV
- ARV (median comp)
- $243,934
- List price
- $179,900
- Delta
- -26.25%
- Verdict
- UNDERPRICED
- Comps
- 20 within 1.0 mi
Show comp detail 12 sales within ~0.75 mi
| Address | Dist | Beds/Ba | Sqft | Sold | Price | $/sf | Match |
|---|---|---|---|---|---|---|---|
| 129 W Northrup Pl N Unit N | 0.01mi | 5/2.5 | 1,408 (0%) | 8mo | $215,000 | $153 | 91 |
| 69 W Northrup Pl Unit N | 0.11mi | 4/1.0 (-1) | 1,408 (0%) | 9mo | $220,000 | $156 | 78 |
| 142 Englewood Ave | 0.30mi | 5/1.5 | 1,504 (+7%) | 4mo | $215,000 | $143 | 69 |
| 83 Custer St | 0.07mi | 4/1.0 (-1) | 1,295 (-8%) | 6mo | $170,000 | $131 | 69 |
| 66 Northrup Pl | 0.38mi | 5/2.0 | 1,480 (+5%) | 11mo | $245,000 | $166 | 65 |
| 15 Montcalm St | 0.38mi | 4/1.5 (-1) | 1,355 (-4%) | 6mo | $270,000 | $199 | 64 |
| 430 Parker Ave | 0.40mi | 4/1.5 (-1) | 1,512 (+7%) | 6mo | $300,000 | $198 | 57 |
| 27 Taft Pl | 0.65mi | 4/2.0 (-1) | 1,456 (+3%) | 11mo | $335,000 | $230 | 50 |
| 106 Lasalle Ave | 0.41mi | 4/1.5 (-1) | 1,563 (+11%) | 7mo | $205,000 | $131 | 49 |
| 176 Lasalle Ave | 0.51mi | 4/2.0 (-1) | 1,601 (+14%) | 2mo | $270,000 | $169 | 47 |
| 253 Winspear Ave | 0.73mi | 4/2.0 (-1) | 1,584 (+12%) | 6mo | $315,100 | $199 | 35 |
| 78 Shirley Ave | 0.67mi | 4/1.5 (-1) | 1,204 (-14%) | 6mo | $200,000 | $166 | 33 |
Match score weights: distance 35% · size 25% · config 20% · recency 20%. Top-matched comps best support the ARV.
Projected returns pro-forma
-3.0% appreciation · 5.81% rent growth · sell at horizon
- IRR
- 7.0%
- Equity multiple
- 1.28×
- Total profit
- $14,220
- Equity at exit
- $26,824
- IRR
- 18.7%
- Equity multiple
- 2.76×
- Total profit
- $88,800
- Equity at exit
- $15,554
Cash invested: $50,372 (down + closing). Projections, not guarantees.
Landlord ↔ Tenant lean methodology
- Overall (STATE)
- 15 Strongly Tenant-Friendly
- State New York
- 15 Strongly Tenant-Friendly · D+10
- County
- — inherits STATE
- City
- — inherits STATE
ZIP-level market 14214
- Rents YoY
- 5.8%
- Active inventory
- 90
- Price-to-rent
- 6.5×
Monthly cashflow live
- Estimated rent
- $2,302 high interval (Pro) →
- Mortgage (P&I)
- −$943
- Tax est. 1.5%
- −$225 /mo · $2,698/yr
- Insurance
- −$75
- HOA
- −$0
- Vacancy / Maint / Mgmt
- −$483
- Net cashflow
- $575
Break-even live
UW: 25.0% down · 7.5% · 30yr · 1.5% tax · 5.0% vac · 8.0% maint · 8.0% mgmt
Financing live
Cash to close
- Down payment
- $44,975
- Closing costs
- $5,397
- Reserves months
- —
- Total cash needed
- —
Loan-product check · same deal, 3 products live
Conventional
25% down · 7.5% · 30yr
- Down + closing
- —
- Monthly P&I
- —
- Monthly cashflow
- —
- DSCR
- —
- Eligible?
- —
Personal DTI + credit; lowest rate.
DSCR
20% down · 8.5% · 30yr
- Down + closing
- —
- Monthly P&I
- —
- Monthly cashflow
- —
- DSCR
- —
- Eligible?
- —
No personal income docs; deal must DSCR.
Hard money
10% down · 12.0% · 12mo
- Down + closing
- —
- Monthly P&I
- —
- Monthly cashflow
- —
- DSCR
- —
- Eligible?
- —
Short-term bridge; refi at stabilization.
Rent comps 7 comps
| Address | Beds | Baths | Sqft | Rent | $/sqft | DOM | Units | Dist |
|---|---|---|---|---|---|---|---|---|
| 60 Englewood Ave Buffalo, NY | 4.0 | 1.0 | 1400 | $1,650 | $1.18 | 2d | 1 | 0.32mi |
| 65 Northrup Pl Buffalo, NY | 5.0 | 2.0 | 1467 | $2,500 | $1.70 | 14d | 1 | 0.36mi |
| 89 Lasalle Ave Buffalo, NY | 1.0–4.0 | 1.0–4.0 | 1024 | $2,997 | $2.93 | 2d | 10 | 0.41mi |
| 222 Lisbon Ave Buffalo, NY | 4.0 | 1.0 | 1300 | $1,400 | $1.08 | 24d | 1 | 0.58mi |
| 91 Springville Ave Buffalo, NY | 4.0 | 2.0 | 1660 | $2,350 | $1.42 | 24d | 1 | 1.05mi |
| 151 Lamson Rd Buffalo, NY | 4.0 | 2.0 | 1382 | $2,350 | $1.70 | 17d | 1 | 1.32mi |
| 189 Westminster Ave Buffalo, NY | 4.0 | 1.5 | 1065 | $1,595 | $1.50 | 10d | 1 | 1.38mi |
Listing history 4 events
-
2026-06-02statusdays on market $179,900 Pending 40 DOM
-
2026-06-01days on market $179,900 Active 39 DOM
-
2026-05-31days on market $179,900 Active 38 DOM
-
2026-04-23$179,900 Active 690-char remark
ⓘ Source: listings_history table (triggers on properties + properties_extension) + one-shot
backfill from property_details.listing_events for pre-trigger history.
Climate risk First Street
- Flood 1/10 Low FEMA zone X (unshaded) · 0% chance over 30 yrs
- Wildfire 1/10 Low
- Heat 2/10 Low 7 d/yr ≥92°F today · 14 d/yr by 30 yrs out
- Wind 1/10 Low
- Air quality 3/10 Moderate 2 unhealthy d/yr today · 3 by 30 yrs out
Nearby sold comps map
Loading sold comps map…
Walkable amenities ~0.75 mi
Loading nearby amenities…
Taxation est. · year 1
- Rental income
- $27,625
- − Mortgage interest
- −$10,077
- − Property taxes
- −$2,698
- − Insurance
- −$900
- − Repairs & maintenance
- −$2,210
- − Management
- −$2,210
- − Depreciation
- −$5,233
- Taxable income
- $4,296
- Est. tax owed @ 24.0%
- −$1,031
- After-tax cash flow
- $5,873/yr
For passive investors: Depreciation is non-cash, so a rental often shows a tax loss while cash-flowing — sheltering income. Rental losses are passive: they offset passive income freely, and up to $25,000/yr can offset ordinary (W-2) income if you actively participate and your MAGI is under $100k (phasing out to $0 by $150k); unused losses carry forward. On sale, claimed depreciation is recaptured at up to 25%, and gains may owe capital-gains tax (a 1031 exchange can defer both). Figures are a year-1 estimate at your 24.0% rate — not tax advice; consult a CPA.
Condition & rehab AI · 1 photo
This charming Dutch Colonial requires moderate renovations, focusing on exterior siding, interior walls, and flooring to enhance its resale and rental value.
Repairs flagged
- Major Exterior siding — Significant wear and tear
- Major Interior walls — Paint appears worn
Value-add opportunities
- Both Paint interior walls — Enhances curb appeal and interior aesthetics
- Both Replace laminate flooring — Improves living space and adds value
- Both Replace exterior siding — Significant wear and tear, improves curb appeal and value
Renovation cost estimate screening
| Repair item | Severity | Est. cost |
|---|---|---|
| Exterior siding · Significant wear and tear | Major | $15,000–50,000 |
| Interior walls · Paint appears worn | Major | $15,000–50,000 |
| Total estimated repair cost · 2 items | $30,000–100,000 |
Value-add ROI direction
- Both Paint interior walls — Enhances curb appeal and interior aesthetics ↑
- Both Replace laminate flooring — Improves living space and adds value ↑
- Both Replace exterior siding — Significant wear and tear, improves curb appeal and value ↑
ⓘ Cost ranges are severity-bucket heuristics (US national rule-of-thumb). Get contractor quotes + a written scope before underwriting a rehab budget.
Schools (NCES district)
- District
- Buffalo City School District
- NCES district ID
- 3605850
- Math proficiency
- 41% ▲ 11.00%
- Reading proficiency
- 40% ▲ 7.00%
- Median HH income
- $31,665
- Composite
- 33.17/100
- National rank
- #5544
- State rank
- #535 of 590 in NY
Livability — Buffalo
- Score
- 77/100
- State rank
- #195
- US rank
- #3011
Category grades
Schools grade is shown separately in the Schools card above.
Census & demographics
- Census place
- Buffalo, NY
- County
- Erie County · 714,559 people
- City population
- 440,021
- Metro
- Buffalo-Cheektowaga, NY
- Population (ZIP)
- 21,314
- Household income
- $58,228
- Rent vs Own
- Severe rent burden
- 1820.0
Population outlook (Erie County) Hauer SSP2
- Today (2025)
- 933,037 people
- By 2030
- 935,181 · +0.2%
- By 2040
- 928,531 · -0.5%
- By 2050
- 905,725 · -2.9%
- By 2075
- 834,037 · -10.6%
- By 2100
- 708,033 · -24.1%
Race, ethnicity, and origin ACS 2023
- Neighborhood character
- Diverse neighborhood (Simpson 0.67)
- Race & ethnicity
- White 47% Black 31% Asian 11% Hispanic / Latino 7% Two or more races 6%
- Hispanic origin (detail)
- Puerto Rican 3%
- Common ancestry
- Romanian 5% Lithuanian 2% Scotch-Irish 1%
- Foreign-born
- 14% · Canada, China
- Languages at home
- 81% English-only · Other Indo-European 7% Spanish 4% Other Asian/Pacific 1%
Political lean MEDSL · Erie
- 2024 margin
- Lean D (+9.7) · D 54.8% · R 45.2%
- 2008→2024 swing
- -7.9pp toward R · 2008: 17.5pp · 2024: 9.7pp
- All cycles
- 2024: D+9.7 2020: D+14.7 2016: D+4.8 2012: D+15.6 2008: D+17.5
Not yet ingested
- Civics
- —
Market trends
- HPI YoY
- ▼ -282.52%
- Current HPI
- 373.377
- Rent YoY
- ▲ 5.81%
- Metro
- Buffalo-Cheektowaga, NY
- State GDP YoY
- ▲ 2.60%
- F500 in state
- 92
Industry mix (Fortune 500 HQ in NY)
| Industry | F500 HQs | Revenue |
|---|---|---|
| Financial Services | 10 | $950B |
|
||
| Consumer Goods | 9 | $162B |
|
||
| Insurance | 4 | $225B |
|
||
| Telecommunications | 2 | $144B |
|
||
| Pharmaceuticals | 2 | $112B |
|
||
| Media / Entertainment | 2 | $69B |
|
||
Price history
2 events — show timeline
- 2026-06-02 Pending — WNYREIS
- 2026-04-23 Listed $179,900 WNYREIS
Cash-flow waterfall
monthlySold comps — $/sqft
last 12 mo · ≤1 miLoading sold comps…