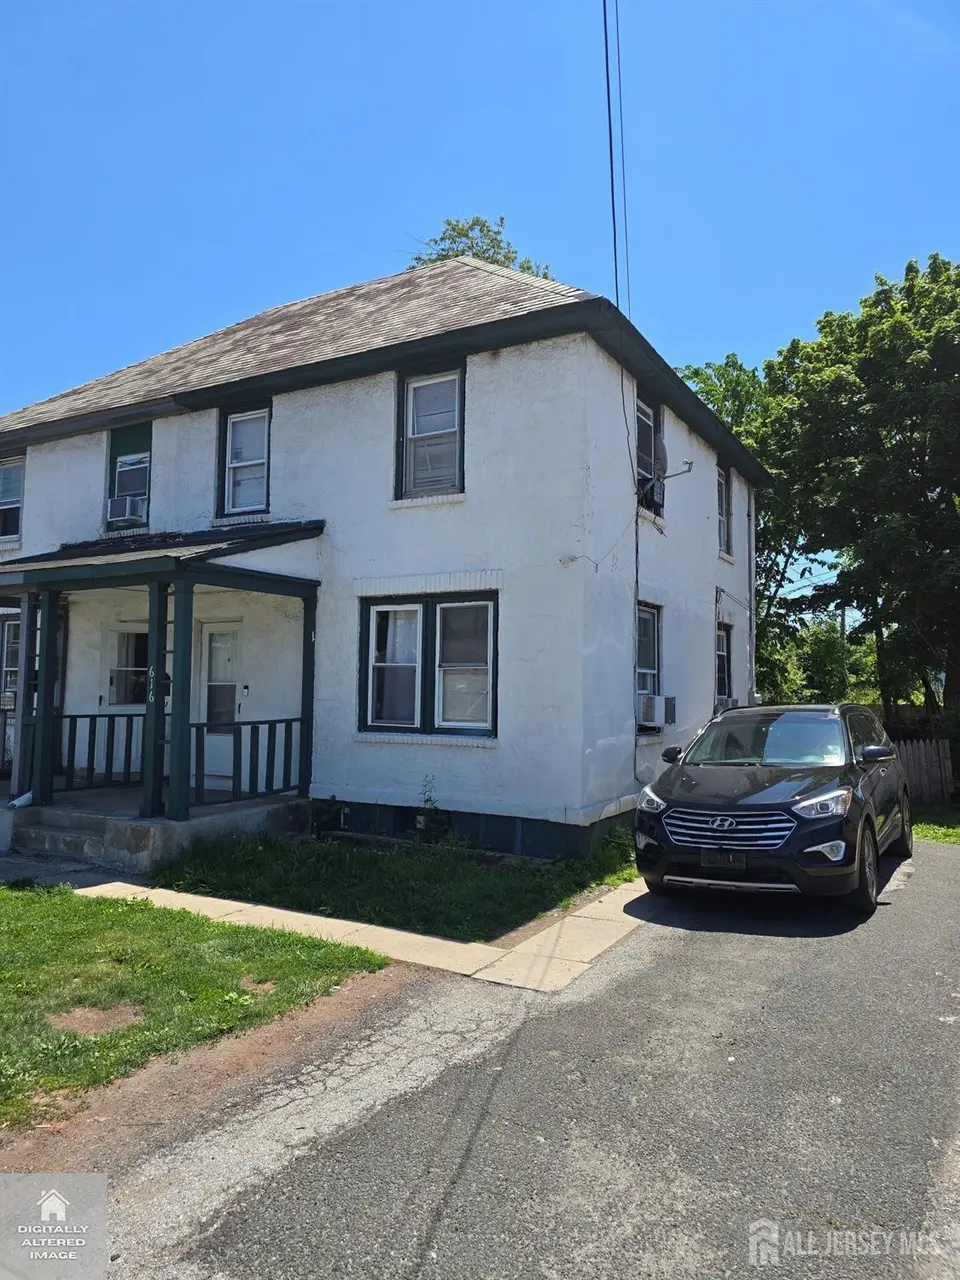
616 Somerset St · New Brunswick, NJ
Flood risk 1/10 · Minimal
- FEMA flood zone
- X (unshaded)
- Chance of flooding over 30 yrs
- 0.0%
- Est. flood insurance / yr
- $507 – $1,088
Fire risk 1/10 · Minimal
- Est. fire insurance / yr
- $526 – $976
Heat risk 7/10 · Major
- Hot days now (above 101°F)
- 7 days/yr
- Hot days in 30 yrs
- 15 days/yr
Wind risk 6/10 · Moderate
- Chance of severe wind over 30 yrs
- 27.0%
Air-quality risk 3/10 · Minor
- Unhealthy air days now
- 3 days/yr
- Unhealthy air days in 30 yrs
- 5 days/yr
Risk factors via First Street. Map © Google.
Why this score? — see what drove the C- grade
The composite is a weighted blend of 9 inputs, each scored 0–100. Each bar is that input's sub-score; the figure is the points it added to the 100-point composite (weight × sub-score).
- Cash flow +18.8/30.0
- ARV discount +12.9/15.0
- DSCR +5.9/10.0
- 1% rule +4.6/10.0
- Livability +3.8/5.0
- Rent growth +3.5/5.0
- Condition / age +2.5/5.0
- Schools +1.2/10.0
- Appreciation +0.0/10.0
$295,000
🖨 Deal sheet 📄 Offer letter ✓ Due diligence
Listing remarks
Did you know that a three bedroom rental in New Brunswick is currently listing for $2,400 a month So with my assistance with mortgage financing and NJ First Time Buyer Programs. .you could probably buy this home for less money than it takes to rent. .my pictures are worth 1000 words. .This home is neat. .well kept. .. bright and cozy . .if you are an investor the tenant would like to stay. .
Key facts
- 2,701 sq ft lot
- 3 parking spots
- Built 1917
Property features AI
Finance
- Other: Garbage service included in tax
- HOA & community: Curbs and sidewalks maintained in the community
Exterior
- Parking: Open parking; Asphalt parking area that fits 3 cars deep
- Utilities: Public water; Public sewer; Electricity connected; Cable TV connected; Natural gas connected
- Home design: 1/2 duplex; Two levels; Exterior entry to full basement
- Construction: Slate roof; Built structure with total building area of 988 (unit not displayed in this section)
- Exterior features: Open porch; Porch; Curbs; Sidewalk; Fencing/wall; Yard; Insulated pane windows; Near shopping; Interior lot; Near public transit
Interior
- Kitchen: Galley-style kitchen; Gas range/oven
- Bedrooms: 3 bedrooms
- Flooring: Carpet; Laminate
- Bathrooms: 1 full bathroom
- Heating & cooling: Forced air heating; Natural gas
- Interior features: Kitchen; Living room; Formal dining room; Attic; Insulated windows
- Laundry & utility: Gas water heater
Neighborhood map
What this means for you Summary
Snapshot
- This is a 3-bed/1.0-bath single-family listed at $295k.
Deal economics
- At list price, monthly cash flow is $294 ($4k/yr) — positive.
- The deal already cash-flows at list — no discount required.
- To meet the 1% rule (rent ≥ 1% of price), the offer needs to be $283k (4.0% below list).
- Recommended offer: $283k (4.0% below list) — sets the bar for 1% rule.
- Cap rate 7.5% vs local median 3.8% in New Brunswick — top-decile yield for the area; either an underpriced asset or a hidden risk that comps aren't pricing in. Stress-test before assuming the spread holds.
Location & tenants
- Location reads 75/100 on livability (#154 in NJ, #3,986 nationally) — a middle-class / working-renter tenant base. Strengths: amenities A+, commute A+, health & safety A+; Watch: employment C-, schools F, crime F.
- New Brunswick School District (urban): math 4% / reading 23% proficiency, ranked #463 of 472 in NJ (top 98%) — low school quality limits family demand, transient renter base, plan for 1-2y turnover; 78% free/reduced lunch — lower-income household profile, screen leases tightly.
- Market conditions: Rents rising (+3.9%/yr); 49 active listings in the ZIP; 17 comparable units currently listed for rent nearby; rentals at typical pace (median 17d on market — plan ~3-4 weeks tenant-placement turnaround); 1,971 units permitted in Middlesex County in 2024 (1,193 in 5+ unit buildings).
- At $2,833/mo this rent would consume 52% of the median local household income ($66k/yr) (locally 4329% of renters already pay >50% of income on rent) — very limited rent-growth headroom before tenants either downsize or default.
Forward outlook
- Local home prices are declining (-3.0%/yr); year-one equity from $2k of loan paydown is wiped out by about $9k of value loss. Plan a longer hold.
- Middlesex County population projected at +15% by 2050 — long-run rental-demand tailwind backs the buy-and-hold thesis.
Negotiation context
- It's been on market 30 days — a 2% lower offer ($291k) is reasonable based on typical stale-listing flexibility.
- Current owner paid $28k; list at $295k implies a 954% gain — meaningful room to come down on a strong offer.
Risks & watch-outs
- Watch-outs: built in 1917 — expect roof / HVAC / electrical / plumbing capex.
- Climate carrying-cost: major wind risk, 27% chance of damaging wind over 30y; extreme-heat days projected 7→15/yr by 2055 (HVAC capex compounding) — expect insurance premiums to compound above CPI over the hold.
Questions for the listing agent
- Built in 1917 — when were the roof, HVAC, electrical panel, plumbing, and water heater last replaced?
- Is there a deadline driving the sale (1031 exchange, divorce, estate, relocation)? That informs how much negotiation room exists.
- Schools are F-rated, which usually means shorter tenancies and higher turnover. Who's the typical renter profile here, and what's been the actual vacancy rate?
- Crime grade is F in this area — have there been break-ins, vandalism, or insurance claims at this property in the last 3 years? What carrier currently insures it and at what premium?
- What's the average days-on-market for RENTAL listings here right now (not sales)? A rising rental-DOM trend means longer vacancies and softer asking-rent achievability than the comps imply.
- What's the recent tenant-quality profile in this submarket — average credit score on applications, eviction rate, late-payment / NSF rate, and stable-employment percentage? A property-management company in the area should have these aggregated.
- How much new for-sale + rental construction is in the pipeline within 1–3 miles? Heavy new supply typically softens prices + rents 12–24 months out; constrained supply supports both.
Investment metrics
- 1% rule
- 0.96% ✗
- Cap rate
- 7.49%
- Cash-on-cash
- 4.28%
- DSCR
- 1.19
- GRM
- 8.7
CMA / ARV
- ARV (on-the-fly)
- $334,932
- Comps found
- 12
Show comp detail 12 sales within ~0.75 mi
| Address | Dist | Beds/Ba | Sqft | Sold | Price | $/sf | Match |
|---|---|---|---|---|---|---|---|
| 6 Lufberry Ave | 0.19mi | 3/1.5 | 950 (-4%) | 1mo | $250,000 | $263 | 82 |
| 53 Mitchell Ave | 0.07mi | 3/1.0 | 1,048 (+6%) | 17mo | $355,000 | $339 | 73 |
| 33 Lufberry Ave | 0.16mi | 3/1.0 | 950 (-4%) | 19mo | $278,000 | $293 | 70 |
| 27 Mitchell Ave | 0.23mi | 3/1.5 | 1,030 (+4%) | 15mo | $295,000 | $286 | 68 |
| 19-A Koolidge Ct | 0.26mi | 2/1.0 (-1) | 885 (-10%) | 6mo | $299,000 | $338 | 60 |
| 142 Harrison St | 0.68mi | 3/2.0 | 958 (-3%) | 4mo | $330,000 | $344 | 56 |
| 303 Columbus Pl | 0.63mi | 3/1.5 | 972 (-2%) | 16mo | $410,000 | $422 | 53 |
| 30 Lafayette Ave | 0.49mi | 2/1.0 (-1) | 1,064 (+8%) | 10mo | $420,000 | $395 | 52 |
| 3 Mitchell Ave | 0.29mi | 2/2.0 (-1) | 1,080 (+9%) | 20mo | $325,000 | $301 | 46 |
| 330 Edpas Rd | 0.43mi | 2/1.0 (-1) | 908 (-8%) | 20mo | $300,000 | $330 | 45 |
| 115 Frank St | 0.69mi | 3/2.0 | 840 (-15%) | 3mo | $510,000 | $607 | 36 |
| 24 Cogswell Pl | 0.64mi | 4/2.0 (+1) | 1,040 (+5%) | 20mo | $420,000 | $404 | 36 |
Match score weights: distance 35% · size 25% · config 20% · recency 20%. Top-matched comps best support the ARV.
Projected returns pro-forma
-3.0% appreciation · 3.87% rent growth · sell at horizon
- IRR
- -8.7%
- Equity multiple
- 0.68×
- Total profit
- $-26,562
- Equity at exit
- $43,985
- IRR
- 1.9%
- Equity multiple
- 1.14×
- Total profit
- $11,405
- Equity at exit
- $25,506
Cash invested: $82,600 (down + closing). Projections, not guarantees.
Landlord ↔ Tenant lean methodology
- Overall (STATE)
- 21 Tenant-Leaning
- State New Jersey
- 21 Tenant-Leaning · D+6
- County
- — inherits STATE
- City
- — inherits STATE
ZIP-level market 08901
- Home prices YoY
- -33.2%
- Rents YoY
- 3.9%
- Active inventory
- 49
- Price-to-rent
- 8.7×
Monthly cashflow live
- Estimated rent
- $2,833 high interval (Pro) →
- Mortgage (P&I)
- −$1,547
- Tax from tax record
- −$274 /mo · $3,285/yr
- Insurance
- −$123
- HOA
- −$0
- Vacancy / Maint / Mgmt
- −$595
- Net cashflow
- $294
Break-even live
UW: 25.0% down · 7.5% · 30yr · 1.5% tax · 5.0% vac · 8.0% maint · 8.0% mgmt
Financing live
Cash to close
- Down payment
- $73,750
- Closing costs
- $8,850
- Reserves months
- —
- Total cash needed
- —
Loan-product check · same deal, 3 products live
Conventional
25% down · 7.5% · 30yr
- Down + closing
- —
- Monthly P&I
- —
- Monthly cashflow
- —
- DSCR
- —
- Eligible?
- —
Personal DTI + credit; lowest rate.
DSCR
20% down · 8.5% · 30yr
- Down + closing
- —
- Monthly P&I
- —
- Monthly cashflow
- —
- DSCR
- —
- Eligible?
- —
No personal income docs; deal must DSCR.
Hard money
10% down · 12.0% · 12mo
- Down + closing
- —
- Monthly P&I
- —
- Monthly cashflow
- —
- DSCR
- —
- Eligible?
- —
Short-term bridge; refi at stabilization.
Rent comps 17 comps
| Address | Beds | Baths | Sqft | Rent | $/sqft | DOM | Units | Dist |
|---|---|---|---|---|---|---|---|---|
| 418 Edpas Rd New Brunswick, NJ | 2.0 | 1.0 | 908 | $2,150 | $2.37 | 7d | 1 | 0.42mi |
| 518 Edpas Rd New Brunswick, NJ | 2.0 | 1.0 | 908 | $1,800 | $1.98 | 3d | 1 | 0.44mi |
| 937 Edpas Rd Unit 1 New Brunswick, NJ | 2.0 | 1.0 | 908 | $2,275 | $2.51 | 2d | 1 | 0.52mi |
| 213 French St Apt 6 New Brunswick, NJ | 3.0 | 1.0 | 862 | $2,895 | $3.36 | 24d | 1 | 0.69mi |
| 265 Franklin Blvd Somerset, NJ | 2.0–3.0 | 1.0 | 860 | $2,950 | $3.43 | 17d | 10 | 0.90mi |
| 79 Renaissance Ln New Brunswick, NJ | 2.0 | 1.5 | 1067 | $2,800 | $2.62 | 16d | 1 | 1.04mi |
| 186 Comstock St New Brunswick, NJ | 2.0 | 1.0 | 1000 | $2,200 | $2.20 | 24d | 1 | 1.06mi |
| 44 Courtlandt St New Brunswick, NJ | 3.0 | 1.0–2.0 | 930 | $4,795 | $5.16 | 1d | 1 | 1.08mi |
| 28 Renaissance Ln New Brunswick, NJ | 2.0 | 1.5 | 1087 | $2,500 | $2.30 | 16d | 1 | 1.10mi |
| 55 Morrell St New Brunswick, NJ | 2.0 | 1.0 | 503 | $2,500 | $4.97 | 24d | 2 | 1.33mi |
| 55 Morrell St New Brunswick, NJ | 2.0 | 1.0 | 558 | $2,600 | $4.66 | 19d | 1 | 1.33mi |
| 60 Paterson St New Brunswick, NJ | 1.0–2.0 | 1.0–1.5 | 974 | $2,985 | $3.06 | 1d | 1 | 1.36mi |
| 110 Somerset St New Brunswick, NJ | 1.0–2.0 | 1.0–2.0 | 912 | $4,433 | $4.86 | 1d | 20 | 1.39mi |
| 39 Throop Ave Unit 3 New Brunswick, NJ | 2.0 | 1.0 | 1000 | $2,400 | $2.40 | 24d | 1 | 1.40mi |
| 7 Livingston Ave New Brunswick, NJ | 2.0 | 1.0–2.0 | 664 | $3,830 | $5.77 | 1d | 18 | 1.41mi |
| 285 George St New Brunswick, NJ | 1.0–2.0 | 1.0–2.0 | 842 | $3,174 | $3.77 | 1d | 7 | 1.43mi |
| 385 George St Unit 2B New Brunswick, NJ | 2.0 | 1.0 | 1037 | $2,650 | $2.56 | 24d | 1 | 1.49mi |
Listing history 16 events
-
2026-06-18days on market $295,000 Active 30 DOM
-
2026-06-17days on market $295,000 Active 29 DOM
-
2026-06-16days on market $295,000 Active 28 DOM
-
2026-06-15days on market $295,000 Active 27 DOM
-
2026-06-13days on market $295,000 Active 25 DOM
-
2026-06-13days on market $295,000 Active 24 DOM
-
2026-06-09days on market $295,000 Active 21 DOM
-
2026-06-08days on market $295,000 Active 20 DOM
-
2026-06-07days on market $295,000 Active 19 DOM
-
2026-06-04days on market $295,000 Active 16 DOM
-
2026-06-03days on market $295,000 Active 15 DOM
-
2026-06-02days on market $295,000 Active 14 DOM
-
2026-06-01days on market $295,000 Active 13 DOM
-
2026-05-31days on market $295,000 Active 12 DOM
-
2026-05-18$295,000 Active
-
1999-08-03soldstatus $28,000
ⓘ Source: listings_history table (triggers on properties + properties_extension) + one-shot
backfill from property_details.listing_events for pre-trigger history.
Tax reassessment forecast NJ · Partial reset (capped growth)
- Current annual tax
- $3,285 · $274/mo
- Projected year-2 tax
- $5,315 · $443/mo
- Expected delta
- +$2,030/yr (+$169/mo · 61.8%)
ⓘ Screening estimate from a state-policy table — verify with the county assessor before closing.
Climate risk First Street
- Flood 1/10 Low FEMA zone X (unshaded) · 0% chance over 30 yrs
- Wildfire 1/10 Low
- Heat 7/10 Severe 7 d/yr ≥101°F today · 15 d/yr by 30 yrs out
- Wind 6/10 Major 27% chance of damaging wind over 30 yrs
- Air quality 3/10 Moderate 3 unhealthy d/yr today · 5 by 30 yrs out
Nearby sold comps map
Loading sold comps map…
Walkable amenities ~0.75 mi
Loading nearby amenities…
Taxation est. · year 1
- Rental income
- $33,997
- − Mortgage interest
- −$16,525
- − Property taxes
- −$3,285
- − Insurance
- −$1,475
- − Repairs & maintenance
- −$2,720
- − Management
- −$2,720
- − Depreciation
- −$8,582
- Taxable loss
- −$1,309
- Est. tax savings @ 24.0%
- +$314
- After-tax cash flow
- $3,848/yr
For passive investors: Depreciation is non-cash, so a rental often shows a tax loss while cash-flowing — sheltering income. Rental losses are passive: they offset passive income freely, and up to $25,000/yr can offset ordinary (W-2) income if you actively participate and your MAGI is under $100k (phasing out to $0 by $150k); unused losses carry forward. On sale, claimed depreciation is recaptured at up to 25%, and gains may owe capital-gains tax (a 1031 exchange can defer both). Figures are a year-1 estimate at your 24.0% rate — not tax advice; consult a CPA.
Schools (NCES district)
- District
- New Brunswick School District
- NCES district ID
- 3411220
- Math proficiency
- 4% ▼ -15.00%
- Reading proficiency
- 23% ▼ -9.00%
- Median HH income
- $40,376
- Composite
- 11.53/100
- National rank
- #9700
- State rank
- #463 of 472 in NJ
Livability — New Brunswick
- Score
- 75/100
- State rank
- #154
- US rank
- #3986
Category grades
Schools grade is shown separately in the Schools card above.
Census & demographics
- Census place
- New Brunswick, NJ
- County
- Middlesex County · 714,427 people
- City population
- 57,263
- Metro
- New York-Newark-Jersey City, NY-NJ-PA
- Population (ZIP)
- 57,263
- Household income
- $65,810
- Rent vs Own
- Severe rent burden
- 4329.0
Population outlook (Middlesex County) Hauer SSP2
- Today (2025)
- 901,713 people
- By 2030
- 930,661 · +3.2%
- By 2040
- 986,276 · +9.4%
- By 2050
- 1,038,920 · +15.2%
- By 2075
- 1,159,418 · +28.6%
- By 2100
- 1,221,973 · +35.5%
Race, ethnicity, and origin ACS 2023
- Neighborhood character
- Diverse neighborhood (Simpson 0.66)
- Race & ethnicity
- Hispanic / Latino 50% White 26% Black 12% Two or more races 10% Asian 9% Native American 7%
- Hispanic origin (detail)
- Mexican 21% Puerto Rican 4% Dominican 10%
- Common ancestry
- Romanian 1%
- Foreign-born
- 36% · Canada, China, Jamaica
- Languages at home
- 44% English-only · Spanish 46% Chinese 3% Other Indo-European 2%
Political lean MEDSL · Middlesex
- 2024 margin
- Lean D (+8.0) · D 52.5% · R 44.5% · Other 3.0%
- 2008→2024 swing
- -13.8pp toward R · 2008: 21.8pp · 2024: 8.0pp
- All cycles
- 2024: D+8.0 2020: D+22.0 2016: D+19.8 2012: D+27.0 2008: D+21.8
Not yet ingested
- Civics
- —
Market trends
- HPI YoY
- ▼ -147.76%
- Current HPI
- 297.8885
- Rent YoY
- ▲ 3.87%
- Metro
- New York-Newark-Jersey City, NY-NJ-PA
- State GDP YoY
- ▲ 2.05%
- F500 in state
- 34
Industry mix (Fortune 500 HQ in NJ)
| Industry | F500 HQs | Revenue |
|---|---|---|
| Consumer Goods | 3 | $31B |
|
||
| Pharmaceuticals | 2 | $153B |
|
||
| Technology | 2 | $21B |
|
||
| Insurance | 2 | $20B |
|
||
| Healthcare | 2 | $19B |
|
||
| Financial Services | 1 | $70B |
|
||
Price history
+953.6% since first listed2 events — show timeline
- 2026-05-18 Listed $295,000 CJMLS
- 1999-08-03 Sold (Public Records) $28,000 Public Records
Property tax history
+0.8%/yrLatest (2025): $3,285 · +2.6% YoY. Source: county tax records.
Cash-flow waterfall
monthlySold comps — $/sqft
last 12 mo · ≤1 miLoading sold comps…