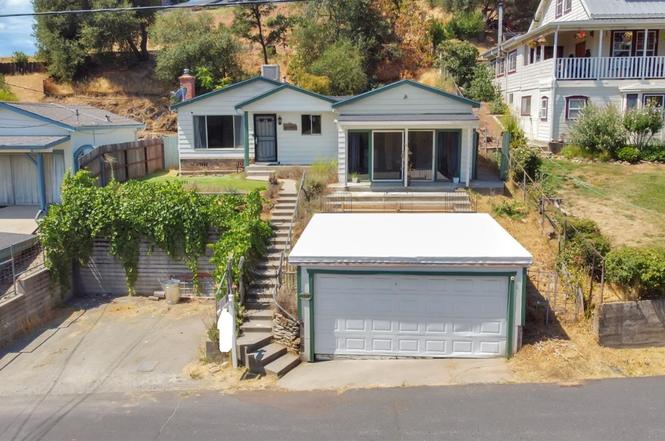
1340 Mark Twain Rd · Angels, CA
Flood risk 1/10 · Minimal
- FEMA flood zone
- X (unshaded)
- Chance of flooding over 30 yrs
- 0.0%
- Est. flood insurance / yr
- $507 – $1,088
Fire risk 8/10 · Major
- Est. fire insurance / yr
- $659 – $1,223
Heat risk 7/10 · Major
- Hot days now (above 102°F)
- 7 days/yr
- Hot days in 30 yrs
- 15 days/yr
Wind risk 1/10 · Minimal
- Chance of severe wind over 30 yrs
- —
Air-quality risk 10/10 · Severe
- Unhealthy air days now
- 27 days/yr
- Unhealthy air days in 30 yrs
- 31 days/yr
Risk factors via First Street. Map © Google.
Why this score? — see what drove the C+ grade
The composite is a weighted blend of 9 inputs, each scored 0–100. Each bar is that input's sub-score; the figure is the points it added to the 100-point composite (weight × sub-score).
- Cash flow +22.7/30.0
- ARV discount +15.0/15.0
- DSCR +7.3/10.0
- 1% rule +6.3/10.0
- Schools +4.5/10.0
- Livability +3.5/5.0
- Rent growth +2.5/5.0
- Condition / age +2.5/5.0
- Appreciation +0.0/10.0
$230,000
🖨 Deal sheet (PDF) 📄 Offer letter ✓ Due diligence
Listing remarks
Charming 3-bedroom, 2-bath home located just minutes from historic downtown Angels Camp. This 1,312 sq ft residence offers a functional layout with a formal living room and spacious family room, abundant natural light with east-facing mountain views. The fenced backyard provides privacy and outdoor enjoyment, while the rooftop deck above the garage offers exciting potential for a unique entertaining space. Conveniently located near shops, dining, schools, and community events, this home blends classic character with modern convenience. This home offers owned solar. Needs a little love but will make an amazing home.
Key facts
- Rooftop deck
- Fenced backyard
- Owned solar
Tags
Property features AI
Finance
- HOA & community: No homeowners association
Exterior
- Parking: Detached 2-car garage
- Utilities: 220 volt electric; Public water; Public sewer; No irrigation
- Home design: Single family detached residence; One story; Built in 1961
- Construction: Composition roof
- Exterior features: Balcony; Lot with other features
Interior
- Kitchen: Gas cooktop; Electric cooktop; Range hood; Dishwasher; Microwave; Tile counters
- Bedrooms: 3 bedrooms (main level)
- Flooring: Concrete floors; Tile floors; Wood floors
- Bathrooms: 2 full bathrooms; Tub with shower over
- Heating & cooling: Propane heating; Wood stove; Central air conditioning; Wall unit(s); Window unit(s)
- Interior features: Great room living area; Tile countertops; One living room fireplace
- Laundry & utility: Laundry inside the home
Neighborhood map
What this means for you Summary
Snapshot
- This is a 3-bed/2.0-bath single-family listed at $230k.
Deal economics
- At list price, monthly cash flow is $395 ($5k/yr) — positive.
- The deal already cash-flows at list — no discount required.
- Meets the 1% rule at list price ($3k rent vs $230k).
- Recommended offer: $202k (12.0% below list) — sets the bar for market timing.
- Cap rate 8.4% vs local median 4.4% in Angels — top-decile yield for the area; either an underpriced asset or a hidden risk that comps aren't pricing in. Stress-test before assuming the spread holds.
Location & tenants
- Location reads 69/100 on livability (#265 in CA) — a middle-class / working-renter tenant base. Strengths: health & safety A+, crime B+, schools B; Watch: amenities F, commute F, cost of living F.
- Bret Harte Union High (town): math 35% / reading 65% proficiency, ranked #429 of 1,400 in CA (top 31%) — acceptable for families but not a draw, mixed tenant base, ~2y average lease.
- Market conditions: 99 active listings in the ZIP; 77 units permitted in Calaveras County in 2024 (0 in 5+ unit buildings).
Forward outlook
- Local home prices are declining (-3.0%/yr); year-one equity from $2k of loan paydown is wiped out by about $7k of value loss. Plan a longer hold.
- Calaveras County population projected at -18% by 2050 — secular population decline; favor cash flow + early exit over multi-decade hold.
Negotiation context
- It's been on market 131 days — a 12% lower offer ($202k) is reasonable based on typical stale-listing flexibility.
- 2 sale attempts; this cycle's ask is 19067% above the opening price — seller raised mid-cycle; expect resistance to lowballs.
Risks & watch-outs
- Climate carrying-cost: severe wildfire risk; extreme-heat days projected 7→15/yr by 2055 (HVAC capex compounding) — expect insurance premiums to compound above CPI over the hold.
Questions for the listing agent
- It's been on market 131 days. Have you received any prior offers? Is the seller open to a 12% concession, seller financing, or rate buy-down credit?
- Built in 1961 — when were the roof, HVAC, electrical panel, plumbing, and water heater last replaced?
- Why hasn't it sold? Are there any deal-killer items the seller is aware of (foundation, flood, title, zoning, code violations)?
- Is there a deadline driving the sale (1031 exchange, divorce, estate, relocation)? That informs how much negotiation room exists.
- Schools are B-rated — typically a magnet for longer-tenancy family renters. What's the average tenant stay here, and is there a school-zone premium baked into asking?
- What's the average days-on-market for RENTAL listings here right now (not sales)? A rising rental-DOM trend means longer vacancies and softer asking-rent achievability than the comps imply.
- What's the recent tenant-quality profile in this submarket — average credit score on applications, eviction rate, late-payment / NSF rate, and stable-employment percentage? A property-management company in the area should have these aggregated.
- How much new for-sale + rental construction is in the pipeline within 1–3 miles? Heavy new supply typically softens prices + rents 12–24 months out; constrained supply supports both.
Investment metrics
- 1% rule
- 1.13% ✓
- Cap rate
- 8.35%
- Cash-on-cash
- 7.36%
- DSCR
- 1.33
- GRM
- 7.4
CMA / ARV
- ARV (on-the-fly)
- $388,352
- Comps found
- 12
Show comp detail 12 sales within ~0.75 mi
| Address | Dist | Beds/Ba | Sqft | Sold | Price | $/sf | Match |
|---|---|---|---|---|---|---|---|
| 1310 Fairview Dr | 0.10mi | 3/2.0 | 1,288 (-2%) | 3mo | $317,000 | $246 | 90 |
| 1356 Mark Twain Rd | 0.02mi | 3/3.0 | 1,350 (+3%) | 10mo | $399,900 | $296 | 82 |
| 1586 Depot Rd | 0.32mi | 3/2.0 | 1,300 (-1%) | 11mo | $349,000 | $268 | 74 |
| 1439 Finnegan Ln | 0.21mi | 3/2.0 | 1,274 (-3%) | 14mo | $322,000 | $253 | 74 |
| 1002 Mark Twain | 0.32mi | 4/2.0 (+1) | 1,420 (+8%) | 1mo | $335,000 | $236 | 65 |
| 1556 So. Main St | 0.35mi | 2/1.0 (-1) | 1,152 (-12%) | 1mo | $350,000 | $304 | 54 |
| 1418 Bush St | 0.16mi | 2/1.0 (-1) | 1,136 (-13%) | 9mo | $310,000 | $273 | 53 |
| 690 Amador Ave | 0.71mi | 3/2.0 | 1,200 (-8%) | 6mo | $360,000 | $300 | 47 |
| 631 Alpine Ave | 0.74mi | 3/2.0 | 1,215 (-7%) | 8mo | $299,000 | $246 | 47 |
| 722 Oneida St | 0.56mi | 2/1.0 (-1) | 1,176 (-10%) | 2mo | $366,000 | $311 | 46 |
| 687 Northstar | 0.73mi | 2/2.0 (-1) | 1,444 (+10%) | 4mo | $460,000 | $319 | 40 |
| 1540 Finnegan | 0.25mi | 2/1.0 (-1) | 1,148 (-12%) | 22mo | $375,000 | $327 | 40 |
Match score weights: distance 35% · size 25% · config 20% · recency 20%. Top-matched comps best support the ARV.
Projected returns pro-forma
-3.0% appreciation · 3.0% rent growth · sell at horizon
- IRR
- -5.0%
- Equity multiple
- 0.81×
- Total profit
- $-12,018
- Equity at exit
- $34,294
- IRR
- 4.7%
- Equity multiple
- 1.35×
- Total profit
- $22,272
- Equity at exit
- $19,886
Cash invested: $64,400 (down + closing). Projections, not guarantees.
Landlord ↔ Tenant lean methodology
- Overall (STATE)
- 18 Strongly Tenant-Friendly
- State California
- 18 Strongly Tenant-Friendly · D+13
- County
- — inherits STATE
- City
- — inherits STATE
ZIP-level market 95222
- Active inventory
- 99
- Price-to-rent
- 7.4×
Monthly cashflow live
- Estimated rent
- $2,596 medium interval (Pro) →
- Mortgage (P&I)
- −$1,206
- Tax from tax record
- −$354 /mo · $4,246/yr
- Insurance
- −$96
- HOA
- −$0
- Vacancy / Maint / Mgmt
- −$545
- Net cashflow
- $395
Break-even live
Sensitivity live
| Price | -10% $525 | -5% $460 | +0% $395 | +5% $330 | +10% $265 |
|---|---|---|---|---|---|
| Rent | -10% $190 | -5% $293 | +0% $395 | +5% $498 | +10% $600 |
| Rate | -1.0pp $511 | -0.5pp $454 | base $395 | +0.5pp $336 | +1.0pp $275 |
UW: 25.0% down · 7.5% · 30yr · 1.5% tax · 5.0% vac · 8.0% maint · 8.0% mgmt
Financing live
Cash to close
- Down payment
- $57,500
- Closing costs
- $6,900
- Reserves months
- —
- Total cash needed
- —
Loan-product check · same deal, 3 products live
Conventional
25% down · 7.5% · 30yr
- Down + closing
- —
- Monthly P&I
- —
- Monthly cashflow
- —
- DSCR
- —
- Eligible?
- —
Personal DTI + credit; lowest rate.
DSCR
20% down · 8.5% · 30yr
- Down + closing
- —
- Monthly P&I
- —
- Monthly cashflow
- —
- DSCR
- —
- Eligible?
- —
No personal income docs; deal must DSCR.
Hard money
10% down · 12.0% · 12mo
- Down + closing
- —
- Monthly P&I
- —
- Monthly cashflow
- —
- DSCR
- —
- Eligible?
- —
Short-term bridge; refi at stabilization.
Listing history 22 events
-
2026-06-17status $230,000 Pending 131 DOM
-
2026-06-17days on market $230,000 Active 131 DOM
-
2026-06-16days on market $230,000 Active 130 DOM
-
2026-06-15days on market $230,000 Active 129 DOM
-
2026-06-14days on market $230,000 Active 127 DOM
-
2026-06-10days on market $230,000 Active 124 DOM
-
2026-06-09days on market $230,000 Active 123 DOM
-
2026-06-08days on market $230,000 Active 122 DOM
-
2026-06-07pricedays on market $230,000 Active 121 DOM
-
2026-06-05pricedays on market $230,900 Active 118 DOM
-
2026-06-03days on market $269,900 Active 117 DOM
-
2026-06-02days on market $269,900 Active 116 DOM
-
2026-06-01days on market $269,900 Active 115 DOM
-
2026-05-31days on market $269,900 Active 114 DOM
-
2026-05-30days on market $269,900 Active 113 DOM
-
2026-04-02historical $1,200
-
2026-04-01$1,200
-
2025-05-21historical
-
2025-02-06Active
-
2021-10-15soldstatus $349,000
-
2018-02-22soldstatus $235,000
-
1999-08-24soldstatus $118,000
ⓘ Source: listings_history table (triggers on properties + properties_extension) + one-shot
backfill from property_details.listing_events for pre-trigger history.
Tax reassessment forecast CA · Resets to sale price
- Current annual tax
- $4,246 · $354/mo
- Projected year-2 tax
- $4,246 · $354/mo
- Expected delta
- $0/yr ($0/mo · 0.0%)
ⓘ Screening estimate from a state-policy table — verify with the county assessor before closing.
Climate risk First Street
- Flood 1/10 Low FEMA zone X (unshaded) · 0% chance over 30 yrs
- Wildfire 8/10 Severe
- Heat 7/10 Severe 7 d/yr ≥102°F today · 15 d/yr by 30 yrs out
- Wind 1/10 Low
- Air quality 10/10 Extreme 27 unhealthy d/yr today · 31 by 30 yrs out
Nearby sold comps map
Loading sold comps map…
Walkable amenities ~0.75 mi
Loading nearby amenities…
Taxation est. · year 1
- Rental income
- $31,155
- − Mortgage interest
- −$12,884
- − Property taxes
- −$4,246
- − Insurance
- −$1,150
- − Repairs & maintenance
- −$2,492
- − Management
- −$2,492
- − Depreciation
- −$6,691
- Taxable income
- $1,200
- Est. tax owed @ 24.0%
- −$288
- After-tax cash flow
- $4,455/yr
For passive investors: Depreciation is non-cash, so a rental often shows a tax loss while cash-flowing — sheltering income. Rental losses are passive: they offset passive income freely, and up to $25,000/yr can offset ordinary (W-2) income if you actively participate and your MAGI is under $100k (phasing out to $0 by $150k); unused losses carry forward. On sale, claimed depreciation is recaptured at up to 25%, and gains may owe capital-gains tax (a 1031 exchange can defer both). Figures are a year-1 estimate at your 24.0% rate — not tax advice; consult a CPA.
Schools (NCES district)
- District
- Bret Harte Union High
- NCES district ID
- 0605940
- Math proficiency
- 35% ▲ 5.00%
- Reading proficiency
- 65% ▲ 5.00%
- Median HH income
- $56,974
- Composite
- 45.41/100
- National rank
- #5708
- State rank
- #429 of 1400 in CA
Livability — Angels
- Score
- 69/100
- State rank
- #265
- US rank
- #8772
Category grades
Schools grade is shown separately in the Schools card above.
Census & demographics
- Census place
- Angels, CA
- City population
- 164
- Population (ZIP)
- 5,666
Population outlook (Calaveras County) Hauer SSP2
- Today (2025)
- 43,163 people
- By 2030
- 41,703 · -3.4%
- By 2040
- 38,202 · -11.5%
- By 2050
- 35,385 · -18.0%
- By 2075
- 30,807 · -28.6%
- By 2100
- 25,755 · -40.3%
Race, ethnicity, and origin ACS 2023
- Neighborhood character
- Predominantly White (85%)
- Race & ethnicity
- White 85% Hispanic / Latino 8% Two or more races 7% Native American 2%
- Hispanic origin (detail)
- Mexican 5%
- Common ancestry
- Slovak 4% Russian 3% Serbian 2%
- Foreign-born
- 3% · Canada
- Languages at home
- 91% English-only · Spanish 8% Other Indo-European 1%
Political lean MEDSL · Calaveras
- 2024 margin
- Strong R (+28.1) · D 34.7% · R 62.8% · Other 2.5%
- 2008→2024 swing
- -15.2pp toward R · 2008: -13.0pp · 2024: -28.1pp
- All cycles
- 2024: R+28.1 2020: R+23.8 2016: R+23.9 2012: R+17.0 2008: R+13.0
Not yet ingested
- Civics
- —
Market trends
- HPI YoY
- ▼ -118.93%
- Current HPI
- 137.7432
- Rent YoY
- —
- Metro
- —
- State GDP YoY
- ▲ 3.21%
- F500 in state
- 116
Industry mix (Fortune 500 HQ in CA)
| Industry | F500 HQs | Revenue |
|---|---|---|
| Technology | 27 | $1,492B |
|
||
| Financial Services | 3 | $174B |
|
||
| Retail | 3 | $44B |
|
||
| Insurance | 3 | $26B |
|
||
| Media / Entertainment | 2 | $115B |
|
||
| Pharmaceuticals / Biotech | 2 | $62B |
|
||
Price history
-99.0% since first listed7 events — show timeline
- 2026-04-02 Rental Removed $1,200 TURBOTENANT
- 2026-04-01 Listed for Rent $1,200 TURBOTENANT
- 2025-05-21 Listing Removed — bridgeMLS, Bay East AOR, or Contra Costa AOR
- 2025-02-06 Listed — bridgeMLS, Bay East AOR, or Contra Costa AOR
- 2021-10-15 Sold (Public Records) $349,000 Public Records
- 2018-02-22 Sold (Public Records) $235,000 Public Records
- 1999-08-24 Sold (Public Records) $118,000 Public Records
Property tax history
+8.1%/yrLatest (2025): $4,246 · +1.0% YoY. Source: county tax records.
Cash-flow waterfall
monthlySold comps — $/sqft
last 12 mo · ≤1 miLoading sold comps…