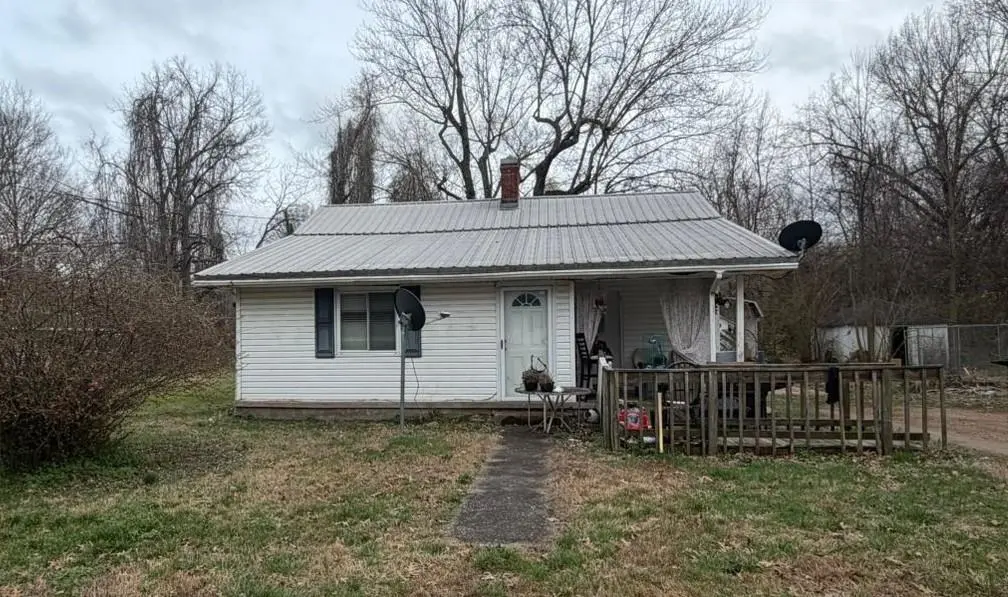
2828 Tennessee Ave · Paducah, KY
Flood risk 1/10 · Minimal
- FEMA flood zone
- X (unshaded)
- Chance of flooding over 30 yrs
- 0.0%
- Est. flood insurance / yr
- $507 – $1,088
Fire risk 1/10 · Minimal
- Est. fire insurance / yr
- $839 – $1,559
Heat risk 6/10 · Moderate
- Hot days now (above 108°F)
- 7 days/yr
- Hot days in 30 yrs
- 20 days/yr
Wind risk 3/10 · Minor
- Chance of severe wind over 30 yrs
- 7.0%
Air-quality risk 3/10 · Minor
- Unhealthy air days now
- 1 days/yr
- Unhealthy air days in 30 yrs
- 4 days/yr
Risk factors via First Street. Map © Google.
Why this score? — see what drove the B- grade
The composite is a weighted blend of 9 inputs, each scored 0–100. Each bar is that input's sub-score; the figure is the points it added to the 100-point composite (weight × sub-score).
- Cash flow +30.0/30.0
- 1% rule +10.0/10.0
- DSCR +10.0/10.0
- ARV discount +7.5/15.0
- Livability +3.4/5.0
- Rent growth +2.5/5.0
- Condition / age +2.5/5.0
- Schools +2.3/10.0
- Appreciation +0.0/10.0
$49,900
🖨 Deal sheet (PDF) 📄 Offer letter ✓ Due diligence
Listing remarks MLS
Great investment opportunity! Looking for an affordable fixer-upper to try your hand at flipping? Or want to add a well priced income property to your portfolio? This 3 bed / 1 bath home has over 1500 square feet of living space and sits on a spacious 1/3 acre lot. Located close to amenities, downtown Paducah, and I-69 access, it doesn't get more convenient! Call today for your personal tour. Property being sold as-is.
Key facts
- Spacious lot
- Downtown access
- Income property
Tags
Neighborhood map
What this means for you Summary
Snapshot
- This is a 3-bed/1.0-bath single-family listed at $50k.
Deal economics
- At list price, monthly cash flow is $695 ($8k/yr) — positive.
- The deal already cash-flows at list — no discount required.
- Meets the 1% rule at list price ($1k rent vs $50k).
- Recommended offer: $45k (9.0% below list) — sets the bar for market timing.
- Cap rate 23.0% vs local median 4.5% in Paducah — top-decile yield for the area; either an underpriced asset or a hidden risk that comps aren't pricing in. Stress-test before assuming the spread holds.
Location & tenants
- Location reads 68/100 on livability (#197 in KY) — a middle-class / working-renter tenant base. Strengths: cost of living A+, housing A+, health & safety A+; Watch: crime C-, employment D, amenities F.
- Paducah Independent (town): math 22% / reading 36% proficiency, ranked #122 of 165 in KY (top 74%) — low school quality limits family demand, transient renter base, plan for 1-2y turnover; 69% free/reduced lunch — lower-income household profile, screen leases tightly.
- Zoned schools: Morgan Elementary School (math 17% / reading 22%, grade F, #572 of 676 statewide, top 88%, 380 students, 89% FRL); Paducah Middle School (math 19% / reading 36%, grade F, #168 of 217 statewide, top 78%, 652 students, 69% FRL); Paducah Tilghman High School (math 22% / reading 42%, grade F, #97 of 254 statewide, top 46%, 878 students, 64% FRL) — zoned schools at 74% FRL track the district average.
- Market conditions: 268 active listings in the ZIP; 1 comparable units currently listed for rent nearby; 187 units permitted in McCracken County in 2024 (104 in 5+ unit buildings).
Forward outlook
- Local home prices are declining (-3.0%/yr); year-one equity from $345 of loan paydown is wiped out by about $1k of value loss. Plan a longer hold.
- McCracken County population projected to shrink 9% by 2050 — rents likely to lag national; underwrite the cash flow, not the appreciation.
- At projected returns (-3.0% appreciation + 3.0% rent growth), your $14k cash investment doubles in ~2 years — after that, you're playing with house money.
Negotiation context
- It's been on market 97 days — a 9% lower offer ($45k) is reasonable based on typical stale-listing flexibility.
- Current owner paid $20k; list at $50k implies a 150% gain — meaningful room to come down on a strong offer.
Risks & watch-outs
- Watch-outs: built in 1925 — expect roof / HVAC / electrical / plumbing capex.
- Climate carrying-cost: extreme-heat days projected 7→20/yr by 2055 (HVAC capex compounding) — expect insurance premiums to compound above CPI over the hold.
Questions for the listing agent
- It's been on market 97 days. Have you received any prior offers? Is the seller open to a 9% concession, seller financing, or rate buy-down credit?
- Built in 1925 — when were the roof, HVAC, electrical panel, plumbing, and water heater last replaced?
- Why hasn't it sold? Are there any deal-killer items the seller is aware of (foundation, flood, title, zoning, code violations)?
- Is there a deadline driving the sale (1031 exchange, divorce, estate, relocation)? That informs how much negotiation room exists.
- Schools are D-rated, which usually means shorter tenancies and higher turnover. Who's the typical renter profile here, and what's been the actual vacancy rate?
- What's the average days-on-market for RENTAL listings here right now (not sales)? A rising rental-DOM trend means longer vacancies and softer asking-rent achievability than the comps imply.
- What's the recent tenant-quality profile in this submarket — average credit score on applications, eviction rate, late-payment / NSF rate, and stable-employment percentage? A property-management company in the area should have these aggregated.
- How much new for-sale + rental construction is in the pipeline within 1–3 miles? Heavy new supply typically softens prices + rents 12–24 months out; constrained supply supports both.
Investment metrics
- 1% rule
- 2.51% ✓
- Cap rate
- 22.99%
- Cash-on-cash
- 59.65%
- DSCR
- 3.65
- GRM
- 3.3
CMA / ARV
- ARV (median comp)
- $159,827
- List price
- $49,900
- Delta
- -68.78%
- Verdict
- UNDERPRICED
- Comps
- 20 within 1.0 mi
Show comp detail 12 sales within ~0.75 mi
| Address | Dist | Beds/Ba | Sqft | Sold | Price | $/sf | Match |
|---|---|---|---|---|---|---|---|
| 2310 S 28th St | 0.38mi | 3/2.0 | 1,616 (+4%) | 11mo | $80,000 | $50 | 62 |
| 3039 Old Mayfield Rd | 0.70mi | 3/1.0 | 1,540 (-1%) | 8mo | $159,500 | $104 | 60 |
| 2516 Clark St | 0.43mi | 4/2.0 (+1) | 1,653 (+7%) | 0mo | $200,000 | $121 | 60 |
| 2605 Adams St | 0.33mi | 3/2.0 | 1,723 (+11%) | 5mo | $178,000 | $103 | 57 |
| 109 Beiderman St | 0.65mi | 3/1.0 | 1,454 (-6%) | 3mo | $25,000 | $17 | 57 |
| 2617 Jefferson St | 0.71mi | 3/1.0 | 1,450 (-6%) | 7mo | $200,000 | $138 | 51 |
| 2915 Mayfield Rd | 0.72mi | 3/2.0 | 1,500 (-3%) | 8mo | $199,000 | $133 | 50 |
| 2018 S 29th St | 0.64mi | 3/1.0 | 1,350 (-13%) | 6mo | $120,000 | $89 | 44 |
| 2014 Jackson St | 0.68mi | 3/1.0 | 1,726 (+11%) | 9mo | $180,550 | $105 | 42 |
| 2542 Monroe St | 0.75mi | 4/2.0 (+1) | 1,668 (+8%) | 2mo | $187,000 | $112 | 41 |
| 2500 Alabama St | 0.66mi | 3/2.0 | 1,408 (-9%) | 11mo | $105,000 | $75 | 41 |
| 922 Stonebrook Dr | 0.68mi | 3/2.0 | 1,745 (+13%) | 7mo | $238,000 | $136 | 37 |
Match score weights: distance 35% · size 25% · config 20% · recency 20%. Top-matched comps best support the ARV.
Projected returns pro-forma
-3.0% appreciation · 3.0% rent growth · sell at horizon
- IRR
- 58.3%
- Equity multiple
- 3.59×
- Total profit
- $36,135
- Equity at exit
- $7,440
- IRR
- 63.1%
- Equity multiple
- 7.32×
- Total profit
- $88,370
- Equity at exit
- $4,314
Cash invested: $13,972 (down + closing). Projections, not guarantees.
Landlord ↔ Tenant lean methodology
- Overall (STATE)
- 83 Strongly Landlord-Friendly
- State Kentucky
- 83 Strongly Landlord-Friendly · R+16
- County
- — inherits STATE
- City
- — inherits STATE
ZIP-level market 42003
- Home prices YoY
- -19.8%
- Active inventory
- 268
- Price-to-rent
- 3.3×
Monthly cashflow live
- Estimated rent
- $1,250 medium interval (Pro) →
- Mortgage (P&I)
- −$262
- Tax from tax record
- −$11 /mo · $126/yr
- Insurance
- −$21
- HOA
- −$0
- Vacancy / Maint / Mgmt
- −$262
- Net cashflow
- $695
Break-even live
Sensitivity live
| Price | -10% $723 | -5% $709 | +0% $695 | +5% $680 | +10% $666 |
|---|---|---|---|---|---|
| Rent | -10% $596 | -5% $645 | +0% $695 | +5% $744 | +10% $793 |
| Rate | -1.0pp $720 | -0.5pp $707 | base $695 | +0.5pp $682 | +1.0pp $668 |
UW: 25.0% down · 7.5% · 30yr · 1.5% tax · 5.0% vac · 8.0% maint · 8.0% mgmt
Financing live
Cash to close
- Down payment
- $12,475
- Closing costs
- $1,497
- Reserves months
- —
- Total cash needed
- —
Loan-product check · same deal, 3 products live
Conventional
25% down · 7.5% · 30yr
- Down + closing
- —
- Monthly P&I
- —
- Monthly cashflow
- —
- DSCR
- —
- Eligible?
- —
Personal DTI + credit; lowest rate.
DSCR
20% down · 8.5% · 30yr
- Down + closing
- —
- Monthly P&I
- —
- Monthly cashflow
- —
- DSCR
- —
- Eligible?
- —
No personal income docs; deal must DSCR.
Hard money
10% down · 12.0% · 12mo
- Down + closing
- —
- Monthly P&I
- —
- Monthly cashflow
- —
- DSCR
- —
- Eligible?
- —
Short-term bridge; refi at stabilization.
Rent comps 1 comps
| Address | Beds | Baths | Sqft | Rent | $/sqft | DOM | Units | Dist |
|---|---|---|---|---|---|---|---|---|
| 1643 Monroe St Apt A Paducah, KY | 2.0 | 1.0 | 1127 | $1,250 | $1.11 | 45d | 1 | 1.17mi |
Listing history 17 events
-
2026-06-17days on market $49,900 Active 97 DOM
-
2026-06-16days on market $49,900 Active 96 DOM
-
2026-06-15days on market $49,900 Active 95 DOM
-
2026-06-14days on market $49,900 Active 93 DOM
-
2026-06-12days on market $49,900 Active 92 DOM
-
2026-06-09days on market $49,900 Active 89 DOM
-
2026-06-08days on market $49,900 Active 88 DOM
-
2026-06-07days on market $49,900 Active 87 DOM
-
2026-06-03days on market $49,900 Active 83 DOM
-
2026-06-02days on market $49,900 Active 82 DOM
-
2026-06-01days on market $49,900 Active 81 DOM
-
2026-05-31days on market $49,900 Active 80 DOM
-
2026-05-30days on market $49,900 Active 79 DOM
-
2026-04-16price $59,900 426-char remark
Show marketing remark (426 chars)
Great investment opportunity! Looking for an affordable fixer-upper to try your hand at flipping? Or want to add a well priced income property to your portfolio? This 3 bed / 1 bath home has over 1500 square feet of living space and sits on a spacious 1/3 acre lot. Located close to amenities, downtown Paducah, and I-69 access, it doesn't get more convenient! Call today for your personal tour. Property being sold as-is.
-
2026-04-02price $69,900 426-char remark
Show marketing remark (426 chars)
Great investment opportunity! Looking for an affordable fixer-upper to try your hand at flipping? Or want to add a well priced income property to your portfolio? This 3 bed / 1 bath home has over 1500 square feet of living space and sits on a spacious 1/3 acre lot. Located close to amenities, downtown Paducah, and I-69 access, it doesn't get more convenient! Call today for your personal tour. Property being sold as-is.
-
2026-03-12$79,900 Active 426-char remark
Show marketing remark (426 chars)
Great investment opportunity! Looking for an affordable fixer-upper to try your hand at flipping? Or want to add a well priced income property to your portfolio? This 3 bed / 1 bath home has over 1500 square feet of living space and sits on a spacious 1/3 acre lot. Located close to amenities, downtown Paducah, and I-69 access, it doesn't get more convenient! Call today for your personal tour. Property being sold as-is.
-
2020-07-14soldstatus $20,000
ⓘ Source: listings_history table (triggers on properties + properties_extension) + one-shot
backfill from property_details.listing_events for pre-trigger history.
Tax reassessment forecast KY · Resets to sale price
- Current annual tax
- $126 · $11/mo
- Projected year-2 tax
- $429 · $36/mo
- Expected delta
- +$303/yr (+$25/mo · 239.9%)
ⓘ Screening estimate from a state-policy table — verify with the county assessor before closing.
Climate risk First Street
- Flood 1/10 Low FEMA zone X (unshaded) · 0% chance over 30 yrs
- Wildfire 1/10 Low
- Heat 6/10 Major 7 d/yr ≥108°F today · 20 d/yr by 30 yrs out
- Wind 3/10 Moderate 7% chance of damaging wind over 30 yrs
- Air quality 3/10 Moderate 1 unhealthy d/yr today · 4 by 30 yrs out
Nearby sold comps map
Loading sold comps map…
Walkable amenities ~0.75 mi
Loading nearby amenities…
Taxation est. · year 1
- Rental income
- $15,000
- − Mortgage interest
- −$2,795
- − Property taxes
- −$126
- − Insurance
- −$250
- − Repairs & maintenance
- −$1,200
- − Management
- −$1,200
- − Depreciation
- −$1,452
- Taxable income
- $7,977
- Est. tax owed @ 24.0%
- −$1,915
- After-tax cash flow
- $6,419/yr
For passive investors: Depreciation is non-cash, so a rental often shows a tax loss while cash-flowing — sheltering income. Rental losses are passive: they offset passive income freely, and up to $25,000/yr can offset ordinary (W-2) income if you actively participate and your MAGI is under $100k (phasing out to $0 by $150k); unused losses carry forward. On sale, claimed depreciation is recaptured at up to 25%, and gains may owe capital-gains tax (a 1031 exchange can defer both). Figures are a year-1 estimate at your 24.0% rate — not tax advice; consult a CPA.
Schools (NCES district)
- District
- Paducah Independent
- NCES district ID
- 2104650
- Math proficiency
- 22% ▼ -14.00%
- Reading proficiency
- 36% ▼ -17.00%
- Median HH income
- $30,067
- Composite
- 23.41/100
- National rank
- #7896
- State rank
- #122 of 165 in KY
Livability — Paducah
- Score
- 68/100
- State rank
- #197
- US rank
- #9780
Category grades
Schools grade is shown separately in the Schools card above.
Census & demographics
- Census place
- Paducah, KY
- City population
- 30,856
- Population (ZIP)
- 29,384
Population outlook (McCracken County) Hauer SSP2
- Today (2025)
- 64,237 people
- By 2030
- 63,468 · -1.2%
- By 2040
- 61,221 · -4.7%
- By 2050
- 58,432 · -9.0%
- By 2075
- 52,668 · -18.0%
- By 2100
- 44,517 · -30.7%
Race, ethnicity, and origin ACS 2023
- Neighborhood character
- Predominantly White (83%)
- Race & ethnicity
- White 83% Black 9% Two or more races 5% Hispanic / Latino 4%
- Common ancestry
- Slovak 2% Lithuanian 1% Serbian 1%
- Foreign-born
- 2% · Canada
- Languages at home
- 97% English-only · Spanish 1% Other Asian/Pacific 1%
Political lean MEDSL · McCracken
- 2024 margin
- Solid R (+34.9) · D 31.9% · R 66.8% · Other 1.2%
- 2008→2024 swing
- -9.7pp toward R · 2008: -25.2pp · 2024: -34.9pp
- All cycles
- 2024: R+34.9 2020: R+31.7 2016: R+37.2 2012: R+32.5 2008: R+25.2
Not yet ingested
- Civics
- —
Market trends
- HPI YoY
- ▼ -58.31%
- Current HPI
- 236.3013
- Rent YoY
- —
- Metro
- —
- State GDP YoY
- ▲ 1.81%
- F500 in state
- 4
Industry mix (Fortune 500 HQ in KY)
| Industry | F500 HQs | Revenue |
|---|---|---|
| Healthcare | 1 | $118B |
|
||
| Food / Beverage | 1 | $7B |
|
||
Price history
+199.5% since first listed4 events — show timeline
- 2026-04-16 Price Changed $59,900 RASKMLS
- 2026-04-02 Price Changed $69,900 RASKMLS
- 2026-03-12 Listed $79,900 RASKMLS
- 2020-07-14 Sold (Public Records) $20,000 Public Records
Property tax history
-36.2%/yrLatest (2020): $126 · +1.1% YoY. Source: county tax records.
Cash-flow waterfall
monthlySold comps — $/sqft
last 12 mo · ≤1 miLoading sold comps…