443 W Lone Oak Rd · Onalaska, TX
Flood risk 1/10 · Minimal
- FEMA flood zone
- X (unshaded)
- Chance of flooding over 30 yrs
- 0.0%
- Est. flood insurance / yr
- $507 – $1,088
Fire risk 5/10 · Moderate
- Est. fire insurance / yr
- $1,222 – $2,270
Heat risk 8/10 · Major
- Hot days now (above 111°F)
- 7 days/yr
- Hot days in 30 yrs
- 24 days/yr
Wind risk 8/10 · Major
- Chance of severe wind over 30 yrs
- 98.0%
Air-quality risk 1/10 · Minimal
- Unhealthy air days now
- 0 days/yr
- Unhealthy air days in 30 yrs
- 0 days/yr
Risk factors via First Street. Map © Google.
Why this score? — see what drove the C+ grade
The composite is a weighted blend of 9 inputs, each scored 0–100. Each bar is that input's sub-score; the figure is the points it added to the 100-point composite (weight × sub-score).
- Cash flow +23.4/30.0
- ARV discount +10.7/15.0
- DSCR +7.5/10.0
- 1% rule +6.2/10.0
- Appreciation +4.7/10.0
- Schools +4.1/10.0
- Livability +3.0/5.0
- Rent growth +2.5/5.0
- Condition / age +2.5/5.0
$109,900
🖨 Deal sheet 📄 Offer letter ✓ Due diligence
Listing remarks MLS
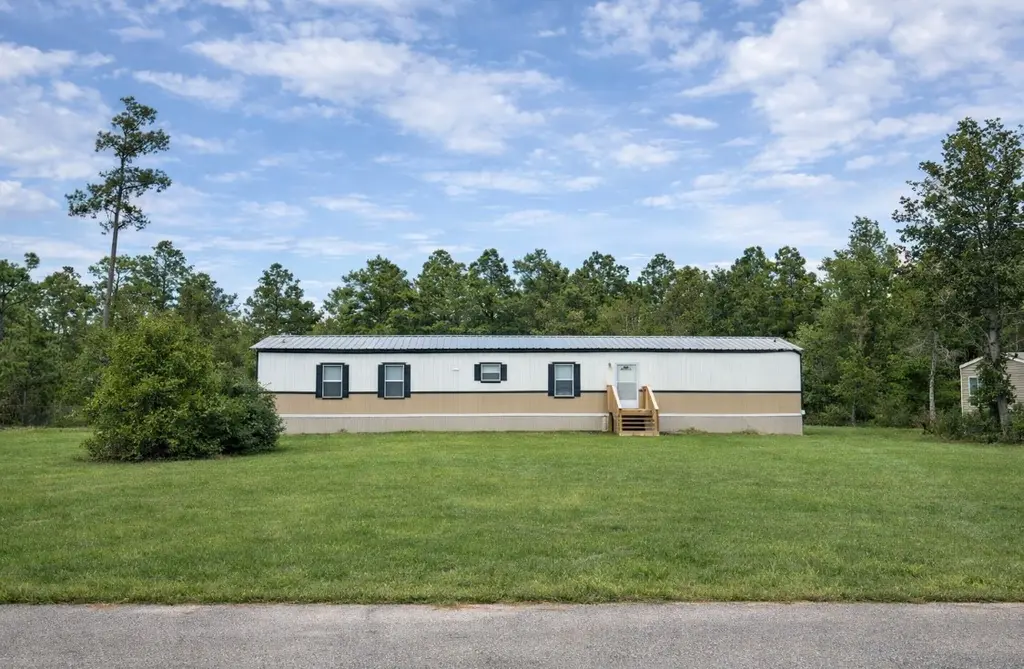
Lake lovers looking for affordable living close to the water — this is it! So close, you can almost hear the waves. This clean and well-maintained 3 bedroom, 2 bathroom home is located in Canyon Park Subdivision and sits on 2 lots, giving you extra space and possibilities. Out back, you’ll find a fire pit area ready for relaxing evenings and nighttime get-togethers. The additional lot space offers plenty of room to build a shop or garage for your boat and jet skis. Whether you’re a first-time buyer, an investment property, or the perfect vacation getaway, this property checks all the boxes. Some pictures are staged with help from AI to show the homes potential with furniture.
Key facts
- Additional lot space
- Fire pit area
- Extra space
Tags
Neighborhood map
What this means for you Summary
Snapshot
- This is a 2-bed/2.0-bath manufactured listed at $110k.
Deal economics
- At list price, monthly cash flow is $203 ($2k/yr) — positive.
- The deal already cash-flows at list — no discount required.
- Meets the 1% rule at list price ($1k rent vs $110k).
- Recommended offer: $103k (6.0% below list) — sets the bar for market timing.
- Cap rate 8.5% vs local median 2.9% in Onalaska — top-decile yield for the area; either an underpriced asset or a hidden risk that comps aren't pricing in. Stress-test before assuming the spread holds.
Location & tenants
- Location reads 60/100 on livability (#1,055 in TX) — a middle-class / working-renter tenant base. Strengths: cost of living A+, housing A+; Watch: employment C-, crime D+, schools D.
- Onalaska ISD (rural): math 50% / reading 48% proficiency, ranked #213 of 826 in TX (top 26%) — families likely to look elsewhere, expect single-tenant / working-renter base with shorter leases.
- Market conditions: 350 active listings in the ZIP; 2 comparable units currently listed for rent nearby; 769 units permitted in Polk County in 2024 (0 in 5+ unit buildings).
Forward outlook
- In year one you build about $91 of equity ($760 loan paydown + $-669 appreciation (-0.6% local appreciation)).
- Polk County population projected at +16% by 2050 — long-run rental-demand tailwind backs the buy-and-hold thesis.
- At projected returns (-0.6% appreciation + 3.0% rent growth), your $31k cash investment doubles in ~8 years — after that, you're playing with house money.
Negotiation context
- It's been on market 90 days — a 6% lower offer ($103k) is reasonable based on typical stale-listing flexibility.
- 3 sale attempts; this cycle's ask has dropped $15k (12%) from the opening price — seller is motivated, your offer sets the floor, not the list.
Risks & watch-outs
- Climate carrying-cost: severe wind risk, 98% chance of damaging wind over 30y; moderate wildfire risk; extreme-heat days projected 7→24/yr by 2055 (HVAC capex compounding) — expect insurance premiums to compound above CPI over the hold.
Questions for the listing agent
- It's been on market 90 days. Have you received any prior offers? Is the seller open to a 6% concession, seller financing, or rate buy-down credit?
- What does the HOA fee cover, when was the last increase, and are there any pending special assessments or reserve-fund shortfalls?
- Why hasn't it sold? Are there any deal-killer items the seller is aware of (foundation, flood, title, zoning, code violations)?
- Is there a deadline driving the sale (1031 exchange, divorce, estate, relocation)? That informs how much negotiation room exists.
- Schools are D-rated, which usually means shorter tenancies and higher turnover. Who's the typical renter profile here, and what's been the actual vacancy rate?
- Crime grade is D in this area — have there been break-ins, vandalism, or insurance claims at this property in the last 3 years? What carrier currently insures it and at what premium?
- What's the average days-on-market for RENTAL listings here right now (not sales)? A rising rental-DOM trend means longer vacancies and softer asking-rent achievability than the comps imply.
- What's the recent tenant-quality profile in this submarket — average credit score on applications, eviction rate, late-payment / NSF rate, and stable-employment percentage? A property-management company in the area should have these aggregated.
- How much new for-sale + rental construction is in the pipeline within 1–3 miles? Heavy new supply typically softens prices + rents 12–24 months out; constrained supply supports both.
Investment metrics
- 1% rule
- 1.12% ✓
- Cap rate
- 8.51%
- Cash-on-cash
- 7.92%
- DSCR
- 1.35
- GRM
- 7.4
CMA / ARV
- ARV (median comp)
- $118,446
- List price
- $109,900
- Delta
- -7.21%
- Verdict
- FAIR
- Comps
- 12 within 2.0 mi
Show comp detail 1 sale within ~0.75 mi
| Address | Dist | Beds/Ba | Sqft | Sold | Price | $/sf | Match |
|---|---|---|---|---|---|---|---|
| 303 W Lone Oak Rd | 0.15mi | 3/2.0 (+1) | 1,064 (-12%) | 0mo | $112,999 | $106 | 67 |
Match score weights: distance 35% · size 25% · config 20% · recency 20%. Top-matched comps best support the ARV.
Projected returns pro-forma
-0.61% appreciation · 3.0% rent growth · sell at horizon
- IRR
- 4.7%
- Equity multiple
- 1.22×
- Total profit
- $6,648
- Equity at exit
- $28,608
- IRR
- 10.7%
- Equity multiple
- 2.09×
- Total profit
- $33,564
- Equity at exit
- $31,851
Cash invested: $30,772 (down + closing). Projections, not guarantees.
Landlord ↔ Tenant lean methodology
- Overall (STATE)
- 87 Strongly Landlord-Friendly
- State Texas
- 87 Strongly Landlord-Friendly · R+5
- County
- — inherits STATE
- City
- — inherits STATE
ZIP-level market 77360
- Home prices YoY
- -0.4%
- Active inventory
- 350
- Price-to-rent
- 7.4×
Monthly cashflow live
- Estimated rent
- $1,233 medium interval (Pro) →
- Mortgage (P&I)
- −$576
- Tax from tax record
- −$119 /mo · $1,428/yr
- Insurance
- −$46
- HOA
- −$30
- Vacancy / Maint / Mgmt
- −$259
- Net cashflow
- $203
Break-even live
UW: 25.0% down · 7.5% · 30yr · 1.5% tax · 5.0% vac · 8.0% maint · 8.0% mgmt
Financing live
Cash to close
- Down payment
- $27,475
- Closing costs
- $3,297
- Reserves months
- —
- Total cash needed
- —
Loan-product check · same deal, 3 products live
Conventional
25% down · 7.5% · 30yr
- Down + closing
- —
- Monthly P&I
- —
- Monthly cashflow
- —
- DSCR
- —
- Eligible?
- —
Personal DTI + credit; lowest rate.
DSCR
20% down · 8.5% · 30yr
- Down + closing
- —
- Monthly P&I
- —
- Monthly cashflow
- —
- DSCR
- —
- Eligible?
- —
No personal income docs; deal must DSCR.
Hard money
10% down · 12.0% · 12mo
- Down + closing
- —
- Monthly P&I
- —
- Monthly cashflow
- —
- DSCR
- —
- Eligible?
- —
Short-term bridge; refi at stabilization.
Rent comps 2 comps
| Address | Beds | Baths | Sqft | Rent | $/sqft | DOM | Units | Dist |
|---|---|---|---|---|---|---|---|---|
| 132 Broken Arrow Onalaska, TX | 3.0 | 2.0 | 1000 | $1,400 | $1.40 | 44d | 1 | 0.64mi |
| 120 Farm to Market Road 356 Unit 4 Onalaska, TX | 2.0 | 1.0 | 754 | $875 | $1.16 | 44d | 1 | 1.04mi |
HOA detail
- Monthly dues
- $30 · $360/yr
- Likely covers
- water
Listing history 22 events
-
2026-06-13status $109,900 Pending 90 DOM
-
2026-06-10days on market $109,900 Active 90 DOM
-
2026-06-09days on market $109,900 Active 89 DOM
-
2026-06-08days on market $109,900 Active 88 DOM
-
2026-06-07days on market $109,900 Active 87 DOM
-
2026-06-05days on market $109,900 Active 84 DOM
-
2026-06-03days on market $109,900 Active 83 DOM
-
2026-06-02days on market $109,900 Active 82 DOM
-
2026-06-01days on market $109,900 Active 81 DOM
-
2026-05-31days on market $109,900 Active 80 DOM
-
2026-05-30days on market $109,900 Active 79 DOM
-
2026-04-15price $120,900 705-char remark
Show marketing remark (705 chars)
Lake lovers looking for affordable living close to the water — this is it! So close, you can almost hear the waves. This clean and well-maintained 3 bedroom, 2 bathroom home is located in Canyon Park Subdivision and sits on 2 lots, giving you extra space and possibilities. Out back, you’ll find a fire pit area ready for relaxing evenings and nighttime get-togethers. The additional lot space offers plenty of room to build a shop or garage for your boat and jet skis. Whether you’re a first-time buyer, an investment property, or the perfect vacation getaway, this property checks all the boxes. Some pictures are staged with help from AI to show the homes potential with furniture.
-
2026-03-12$124,900 Active 705-char remark
Show marketing remark (705 chars)
Lake lovers looking for affordable living close to the water — this is it! So close, you can almost hear the waves. This clean and well-maintained 3 bedroom, 2 bathroom home is located in Canyon Park Subdivision and sits on 2 lots, giving you extra space and possibilities. Out back, you’ll find a fire pit area ready for relaxing evenings and nighttime get-togethers. The additional lot space offers plenty of room to build a shop or garage for your boat and jet skis. Whether you’re a first-time buyer, an investment property, or the perfect vacation getaway, this property checks all the boxes. Some pictures are staged with help from AI to show the homes potential with furniture.
-
2026-03-12historical
Show marketing remark (705 chars)
Lake lovers looking for affordable living close to the water — this is it! So close, you can almost hear the waves. This clean and well-maintained 3 bedroom, 2 bathroom home is located in Canyon Park Subdivision and sits on 2 lots, giving you extra space and possibilities. Out back, you’ll find a fire pit area ready for relaxing evenings and nighttime get-togethers. The additional lot space offers plenty of room to build a shop or garage for your boat and jet skis. Whether you’re a first-time buyer, an investment property, or the perfect vacation getaway, this property checks all the boxes. Some pictures are staged with help from AI to show the homes potential with furniture.
-
2026-01-02price $129,900
-
2025-10-31$138,000 Active
-
2025-10-29historical
-
2025-09-22price $142,900
-
2025-09-02price $147,900
-
2025-08-15price $151,900
-
2025-07-24price $164,900
-
2025-04-17$169,900 Active
ⓘ Source: listings_history table (triggers on properties + properties_extension) + one-shot
backfill from property_details.listing_events for pre-trigger history.
Tax reassessment forecast TX · Resets to sale price
- Current annual tax
- $1,428 · $119/mo
- Projected year-2 tax
- $2,011 · $168/mo
- Expected delta
- +$583/yr (+$49/mo · 40.8%)
ⓘ Screening estimate from a state-policy table — verify with the county assessor before closing.
Climate risk First Street
- Flood 1/10 Low FEMA zone X (unshaded) · 0% chance over 30 yrs
- Wildfire 5/10 Major
- Heat 8/10 Severe 7 d/yr ≥111°F today · 24 d/yr by 30 yrs out
- Wind 8/10 Severe 98% chance of damaging wind over 30 yrs
- Air quality 1/10 Low 0 unhealthy d/yr today · 0 by 30 yrs out
Nearby sold comps map
Loading sold comps map…
Walkable amenities ~0.75 mi
Loading nearby amenities…
Taxation est. · year 1
- Rental income
- $14,800
- − Mortgage interest
- −$6,156
- − Property taxes
- −$1,428
- − Insurance
- −$550
- − Repairs & maintenance
- −$1,184
- − Management
- −$1,184
- − HOA
- −$360
- − Depreciation
- −$3,197
- Taxable income
- $741
- Est. tax owed @ 24.0%
- −$178
- After-tax cash flow
- $2,261/yr
For passive investors: Depreciation is non-cash, so a rental often shows a tax loss while cash-flowing — sheltering income. Rental losses are passive: they offset passive income freely, and up to $25,000/yr can offset ordinary (W-2) income if you actively participate and your MAGI is under $100k (phasing out to $0 by $150k); unused losses carry forward. On sale, claimed depreciation is recaptured at up to 25%, and gains may owe capital-gains tax (a 1031 exchange can defer both). Figures are a year-1 estimate at your 24.0% rate — not tax advice; consult a CPA.
Schools (NCES district)
- District
- Onalaska ISD
- NCES district ID
- 4833690
- Math proficiency
- 50% ▼ -10.00%
- Reading proficiency
- 48% ▼ -1.00%
- Median HH income
- $38,882
- Composite
- 40.91/100
- National rank
- #3616
- State rank
- #213 of 826 in TX
Livability — Onalaska
- Score
- 60/100
- State rank
- #1055
- US rank
- #18716
Category grades
Schools grade is shown separately in the Schools card above.
Census & demographics
- Census place
- Onalaska, TX
- Population (ZIP)
- 6,130
Population outlook (Polk County) Hauer SSP2
- Today (2025)
- 51,049 people
- By 2030
- 53,243 · +4.3%
- By 2040
- 56,528 · +10.7%
- By 2050
- 59,243 · +16.1%
- By 2075
- 63,528 · +24.4%
- By 2100
- 60,376 · +18.3%
Race, ethnicity, and origin ACS 2023
- Neighborhood character
- Predominantly White (86%)
- Race & ethnicity
- White 86% Two or more races 10% Hispanic / Latino 8%
- Hispanic origin (detail)
- Mexican 7%
- Common ancestry
- Lithuanian 4% Italian 2% Romanian 2%
- Foreign-born
- 1% · Canada
- Languages at home
- 95% English-only · Spanish 5%
Political lean MEDSL · Polk
- 2024 margin
- Solid R (+58.9) · D 20.2% · R 79.1%
- 2008→2024 swing
- -21.7pp toward R · 2008: -37.2pp · 2024: -58.9pp
- All cycles
- 2024: R+58.9 2020: R+54.5 2016: R+56.5 2012: R+48.2 2008: R+37.2
Not yet ingested
- Civics
- —
Market trends
- HPI YoY
- ▼ -0.61%
- Current HPI
- 150.9486
- Rent YoY
- —
- Metro
- —
- State GDP YoY
- ▲ 3.95%
- F500 in state
- 110
Industry mix (Fortune 500 HQ in TX)
| Industry | F500 HQs | Revenue |
|---|---|---|
| Energy | 16 | $1,198B |
|
||
| Technology | 5 | $198B |
|
||
| Engineering / Construction | 4 | $72B |
|
||
| Energy Services | 3 | $60B |
|
||
| Utilities | 3 | $41B |
|
||
| Healthcare | 2 | $330B |
|
||
Price history
-28.8% since first listed11 events — show timeline
- 2026-04-15 Price Changed $120,900 HARMLS
- 2026-03-12 Listing Removed — HARMLS
- 2026-03-12 Listed $124,900 HARMLS
- 2026-01-02 Price Changed $129,900 HARMLS
- 2025-10-31 Listed $138,000 HARMLS
- 2025-10-29 Listing Removed — HARMLS
- 2025-09-22 Price Changed $142,900 HARMLS
- 2025-09-02 Price Changed $147,900 HARMLS
- 2025-08-15 Price Changed $151,900 HARMLS
- 2025-07-24 Price Changed $164,900 HARMLS
- 2025-04-17 Listed $169,900 HARMLS
Property tax history
+6.4%/yrLatest (2025): $1,428 · +10.2% YoY. Source: county tax records.
Cash-flow waterfall
monthlySold comps — $/sqft
last 12 mo · ≤1 miLoading sold comps…