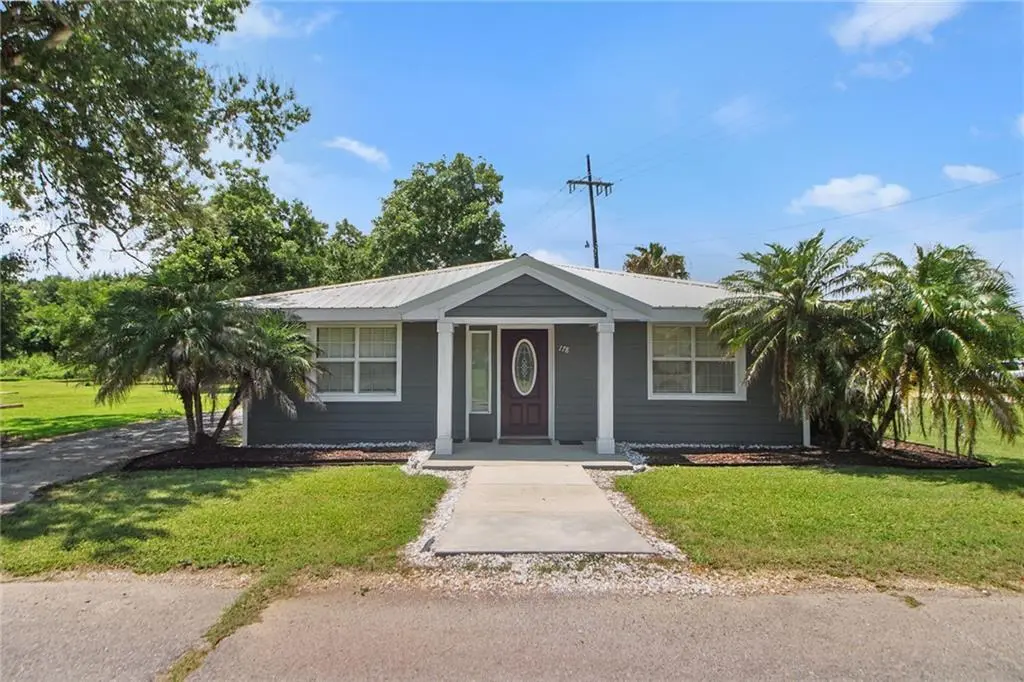
178 E Pipeline Dr · Triumph, LA
Flood risk 9/10 · Severe
- FEMA flood zone
- AE
- Chance of flooding over 30 yrs
- 0.79%
- Est. flood insurance / yr
- $1,737 – $8,500
Fire risk 1/10 · Minimal
- Est. fire insurance / yr
- $1,269 – $2,357
Heat risk 10/10 · Severe
- Hot days now (above 106°F)
- 7 days/yr
- Hot days in 30 yrs
- 24 days/yr
Wind risk 10/10 · Severe
- Chance of severe wind over 30 yrs
- 99.0%
Air-quality risk 2/10 · Minimal
- Unhealthy air days now
- 0 days/yr
- Unhealthy air days in 30 yrs
- 1 days/yr
Risk factors via First Street. Map © Google.
Why this score? — see what drove the F grade
The composite is a weighted blend of 9 inputs, each scored 0–100. Each bar is that input's sub-score; the figure is the points it added to the 100-point composite (weight × sub-score).
- Cash flow +7.0/30.0
- Schools +5.0/10.0
- Appreciation +4.9/10.0
- ARV discount +3.3/15.0
- Livability +2.6/5.0
- Rent growth +2.5/5.0
- Condition / age +2.5/5.0
- DSCR +1.2/10.0
- 1% rule +0.6/10.0
$169,000
🖨 Deal sheet 📄 Offer letter ✓ Due diligence
Listing remarks MLS
FISHERMAN'S RETREAT PLUS INCOME PRODUCING BUNKHOUSE. FISHING GUIDE READY !! 2 SEPERATE BUILDINGS - SEE ATTACHED FLOORPLANS - UPDATED AND RENOVATED WITH OPEN LAYOUTS - SELLER IS A FISHING GUIDE UNDER NAME KAYAK VENICE LA. 2 BEDROOM 2 BATH IN MAIN HOME - 4 BUNKHOUSES 1 BATH IN REAR BUNKHOUSE. LOTS OF STORAGE, METAL ROOF, TERMITE CONTRACT. LITERALLY MISSISSIPPI RIVER ACROSS THE STREET.
Key facts
- Metal roof
- Mississippi river
- Fishing guide ready
Tags
Neighborhood map
What this means for you Summary
Snapshot
- This is a 3-bed/3.0-bath single-family listed at $169k.
Deal economics
- At list price, monthly cash flow is $-674 ($-8k/yr) — negative.
- To cash-flow at today's rent, offer at most $50k (70.5% below list).
- To meet the 1% rule (rent ≥ 1% of price), the offer needs to be $95k (43.8% below list).
- Recommended offer: $50k (70.5% below list) — sets the bar for cash-flow.
Location & tenants
- Location reads 51/100 on livability (#420 in LA) — a working-class tenant base; expect higher turnover. Strengths: cost of living A+, housing A-; Watch: employment D+, schools F, crime F.
- Market conditions: 52 active listings in the ZIP; 2 comparable units currently listed for rent nearby; 88 units permitted in Plaquemines Parish in 2024 (0 in 5+ unit buildings).
Forward outlook
- In year one you build about $679 of equity ($1k loan paydown + $-489 appreciation (-0.3% local appreciation)).
- Plaquemines County population projected at +6% by 2050 — modest demand growth; plan on rents tracking national, not racing it.
Negotiation context
- It's been on market 343 days — a 12% lower offer ($149k) is reasonable based on typical stale-listing flexibility.
- 2 sale attempts with the ask held roughly flat each time — persistent listings suggest the price (not the market) is what's stuck; bring a comps-based counter.
- Current owner paid $50k; list at $169k implies a 238% gain — meaningful room to come down on a strong offer.
Risks & watch-outs
- Watch-outs: flood insurance adds $427/mo.
- Climate carrying-cost: in FEMA flood zone AE (mandatory federal flood insurance); severe wind risk, 99% chance of damaging wind over 30y; extreme-heat days projected 7→24/yr by 2055 (HVAC capex compounding) — expect insurance premiums to compound above CPI over the hold.
Questions for the listing agent
- What do current leases actually rent for vs. the listed asking? Can we see a recent rent roll and the last 12 months of T-12 income?
- It's been on market 343 days. Have you received any prior offers? Is the seller open to a 70% concession, seller financing, or rate buy-down credit?
- What's the actual annual flood-insurance premium (NFIP or private), and is the property in a SFHA with mandatory coverage?
- Why hasn't it sold? Are there any deal-killer items the seller is aware of (foundation, flood, title, zoning, code violations)?
- Is there a deadline driving the sale (1031 exchange, divorce, estate, relocation)? That informs how much negotiation room exists.
- Schools are F-rated, which usually means shorter tenancies and higher turnover. Who's the typical renter profile here, and what's been the actual vacancy rate?
- Crime grade is F in this area — have there been break-ins, vandalism, or insurance claims at this property in the last 3 years? What carrier currently insures it and at what premium?
- The area grade is low — what's the realistic commute time and amenity access for the typical tenant pool here? Any planned neighborhood developments (good or bad) we should know about?
- What's the average days-on-market for RENTAL listings here right now (not sales)? A rising rental-DOM trend means longer vacancies and softer asking-rent achievability than the comps imply.
- What's the recent tenant-quality profile in this submarket — average credit score on applications, eviction rate, late-payment / NSF rate, and stable-employment percentage? A property-management company in the area should have these aggregated.
- How much new for-sale + rental construction is in the pipeline within 1–3 miles? Heavy new supply typically softens prices + rents 12–24 months out; constrained supply supports both.
Investment metrics
- 1% rule
- 0.56% ✗
- Cap rate
- 4.53%
- Cash-on-cash
- -6.28%
- DSCR
- 0.72
- GRM
- 14.8
CMA / ARV
- ARV (median comp)
- $154,498
- List price
- $169,000
- Delta
- 9.39%
- Verdict
- FAIR
- Comps
- 1 within 2.0 mi
Projected returns pro-forma
-0.29% appreciation · 3.0% rent growth · sell at horizon
- IRR
- -23.7%
- Equity multiple
- -0.06×
- Total profit
- $-49,999
- Equity at exit
- $46,640
- IRR
- -16.8%
- Equity multiple
- -0.66×
- Total profit
- $-78,509
- Equity at exit
- $54,158
Cash invested: $47,320 (down + closing). Projections, not guarantees.
Landlord ↔ Tenant lean methodology
- Overall (STATE)
- 90 Strongly Landlord-Friendly
- State Louisiana
- 90 Strongly Landlord-Friendly · R+12
- County
- — inherits STATE
- City
- — inherits STATE
ZIP-level market 70041
- Home prices YoY
- -0.5%
- Active inventory
- 52
- Price-to-rent
- 14.8×
Monthly cashflow live
- Estimated rent
- $950 medium interval (Pro) →
- Mortgage (P&I)
- −$886
- Tax from tax record
- −$41 /mo · $498/yr
- Insurance
- −$70
- Flood insurance flood zone
- −$427 /mo · $5,118/yr
- HOA
- −$0
- Vacancy / Maint / Mgmt
- −$200
- Net cashflow
- $-674
Break-even live
UW: 25.0% down · 7.5% · 30yr · 1.5% tax · 5.0% vac · 8.0% maint · 8.0% mgmt
Financing live
Cash to close
- Down payment
- $42,250
- Closing costs
- $5,070
- Reserves months
- —
- Total cash needed
- —
Loan-product check · same deal, 3 products live
Conventional
25% down · 7.5% · 30yr
- Down + closing
- —
- Monthly P&I
- —
- Monthly cashflow
- —
- DSCR
- —
- Eligible?
- —
Personal DTI + credit; lowest rate.
DSCR
20% down · 8.5% · 30yr
- Down + closing
- —
- Monthly P&I
- —
- Monthly cashflow
- —
- DSCR
- —
- Eligible?
- —
No personal income docs; deal must DSCR.
Hard money
10% down · 12.0% · 12mo
- Down + closing
- —
- Monthly P&I
- —
- Monthly cashflow
- —
- DSCR
- —
- Eligible?
- —
Short-term bridge; refi at stabilization.
Rent comps 2 comps
| Address | Beds | Baths | Sqft | Rent | $/sqft | DOM | Units | Dist |
|---|---|---|---|---|---|---|---|---|
| 187 Wildwood Dr Buras, LA | 3.0 | 1.0 | 840 | $950 | $1.13 | 43d | 1 | 1.49mi |
| 177 Wildwood Dr Buras, LA | 3.0 | 1.0 | 840 | $950 | $1.13 | 43d | 1 | 1.50mi |
Listing history 17 events
-
2026-06-18days on market $169,000 Active 343 DOM
-
2026-06-17days on market $169,000 Active 342 DOM
-
2026-06-16days on market $169,000 Active 341 DOM
-
2026-06-15days on market $169,000 Active 340 DOM
-
2026-06-13days on market $169,000 Active 338 DOM
-
2026-06-13days on market $169,000 Active 337 DOM
-
2026-06-10days on market $169,000 Active 335 DOM
-
2026-06-09days on market $169,000 Active 334 DOM
-
2026-06-08days on market $169,000 Active 333 DOM
-
2026-06-07days on market $169,000 Active 332 DOM
-
2026-06-03days on market $169,000 Active 328 DOM
-
2026-06-02days on market $169,000 Active 327 DOM
-
2026-06-01days on market $169,000 Active 326 DOM
-
2026-05-31days on market $169,000 Active 325 DOM
-
2025-07-09$169,000 Active 386-char remark
Show marketing remark (385 chars)
FISHERMAN'S RETREAT PLUS INCOME PRODUCING BUNKHOUSE. FISHING GUIDE READY !! 2 SEPERATE BUILDINGS - SEE ATTACHED FLOORPLANS - UPDATED AND RENOVATED WITH OPEN LAYOUTS - SELLER IS A FISHING GUIDE UNDER NAME KAYAK VENICE LA. 2 BEDROOM 2 BATH IN MAIN HOME - 4 BUNKHOUSES 1 BATH IN REAR BUNKHOUSE. LOTS OF STORAGE, METAL ROOF, TERMITE CONTRACT. LITERALLY MISSISSIPPI RIVER ACROSS THE STREET.
-
2025-07-09$169,000 Active 385-char remark
Show marketing remark (385 chars)
FISHERMAN'S RETREAT PLUS INCOME PRODUCING BUNKHOUSE. FISHING GUIDE READY !! 2 SEPERATE BUILDINGS - SEE ATTACHED FLOORPLANS - UPDATED AND RENOVATED WITH OPEN LAYOUTS - SELLER IS A FISHING GUIDE UNDER NAME KAYAK VENICE LA. 2 BEDROOM 2 BATH IN MAIN HOME - 4 BUNKHOUSES 1 BATH IN REAR BUNKHOUSE. LOTS OF STORAGE, METAL ROOF, TERMITE CONTRACT. LITERALLY MISSISSIPPI RIVER ACROSS THE STREET.
-
2012-03-23soldstatus $50,000
ⓘ Source: listings_history table (triggers on properties + properties_extension) + one-shot
backfill from property_details.listing_events for pre-trigger history.
Tax reassessment forecast LA · Resets to sale price
- Current annual tax
- $498 · $41/mo
- Projected year-2 tax
- $930 · $77/mo
- Expected delta
- +$432/yr (+$36/mo · 86.7%)
ⓘ Screening estimate from a state-policy table — verify with the county assessor before closing.
Climate risk First Street
- Flood 9/10 Extreme FEMA zone AE · 79% chance over 30 yrs
- Wildfire 1/10 Low
- Heat 10/10 Extreme 7 d/yr ≥106°F today · 24 d/yr by 30 yrs out
- Wind 10/10 Extreme 99% chance of damaging wind over 30 yrs
- Air quality 2/10 Low 0 unhealthy d/yr today · 1 by 30 yrs out
Nearby sold comps map
Loading sold comps map…
Walkable amenities ~0.75 mi
Loading nearby amenities…
Taxation est. · year 1
- Rental income
- $11,400
- − Mortgage interest
- −$9,467
- − Property taxes
- −$498
- − Insurance
- −$5,964
- − Repairs & maintenance
- −$912
- − Management
- −$912
- − Depreciation
- −$4,916
- Taxable loss
- −$11,268
- Est. tax savings @ 24.0%
- +$2,704
- After-tax cash flow
- $-5,386/yr
For passive investors: Depreciation is non-cash, so a rental often shows a tax loss while cash-flowing — sheltering income. Rental losses are passive: they offset passive income freely, and up to $25,000/yr can offset ordinary (W-2) income if you actively participate and your MAGI is under $100k (phasing out to $0 by $150k); unused losses carry forward. On sale, claimed depreciation is recaptured at up to 25%, and gains may owe capital-gains tax (a 1031 exchange can defer both). Figures are a year-1 estimate at your 24.0% rate — not tax advice; consult a CPA.
Schools (NCES district)
No district data.
Livability — Triumph
- Score
- 51/100
- State rank
- #420
- US rank
- #25336
Category grades
Schools grade is shown separately in the Schools card above.
Census & demographics
- Census place
- Triumph, LA
- City population
- 2,092
- Population (ZIP)
- 2,092
Population outlook (Plaquemines County) Hauer SSP2
- Today (2025)
- 24,526 people
- By 2030
- 24,843 · +1.3%
- By 2040
- 25,441 · +3.7%
- By 2050
- 26,074 · +6.3%
- By 2075
- 28,300 · +15.4%
- By 2100
- 30,195 · +23.1%
Race, ethnicity, and origin ACS 2023
- Neighborhood character
- Diverse neighborhood (Simpson 0.61)
- Race & ethnicity
- White 57% Asian 19% Black 15% Two or more races 6% Native American 1%
- Common ancestry
- Lithuanian 25% American 1%
- Foreign-born
- 16% · Vietnam, Canada
- Languages at home
- 82% English-only · Vietnamese 9% Other Asian/Pacific 8% French/Haitian/Cajun 1%
Political lean MEDSL · Plaquemines
- 2024 margin
- Solid R (+38.0) · D 30.4% · R 68.4% · Other 1.2%
- 2008→2024 swing
- -4.4pp toward R · 2008: -33.6pp · 2024: -38.0pp
- All cycles
- 2024: R+38.0 2020: R+36.3 2016: R+33.6 2012: R+28.1 2008: R+33.6
Not yet ingested
- Civics
- —
Market trends
- HPI YoY
- ▼ -0.29%
- Current HPI
- 58.8381
- Rent YoY
- —
- Metro
- —
- State GDP YoY
- ▲ 3.29%
- F500 in state
- 10
Industry mix (Fortune 500 HQ in LA)
| Industry | F500 HQs | Revenue |
|---|---|---|
| Telecommunications | 2 | $23B |
|
||
| Utilities | 1 | $12B |
|
||
| Wholesale / Distribution | 1 | $5B |
|
||
| Advertising | 1 | $2B |
|
||
Price history
+238.0% since first listed3 events — show timeline
- 2025-07-09 Listed $169,000 AcadianaMLS
- 2025-07-09 Listed $169,000 GSREIN
- 2012-03-23 Sold (Public Records) $50,000 Public Records
Property tax history
+5.6%/yrLatest (2025): $498 · -3.6% YoY. Source: county tax records.
Cash-flow waterfall
monthlySold comps — $/sqft
last 12 mo · ≤1 miLoading sold comps…