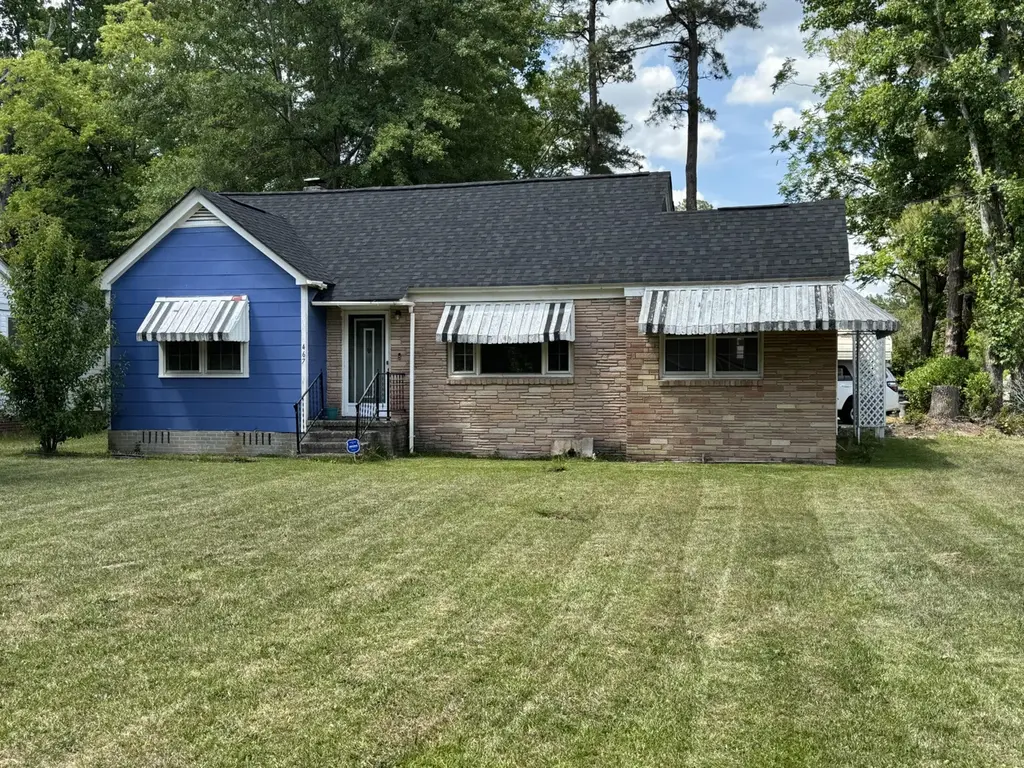
467 Robney Dr · Sumter, SC
Flood risk 3/10 · Minor
- FEMA flood zone
- AE
- Chance of flooding over 30 yrs
- 0.2%
- Est. flood insurance / yr
- $1,737 – $8,500
Fire risk 3/10 · Minor
- Est. fire insurance / yr
- $783 – $1,453
Heat risk 7/10 · Major
- Hot days now (above 108°F)
- 7 days/yr
- Hot days in 30 yrs
- 16 days/yr
Wind risk 8/10 · Major
- Chance of severe wind over 30 yrs
- 80.0%
Air-quality risk 2/10 · Minimal
- Unhealthy air days now
- 2 days/yr
- Unhealthy air days in 30 yrs
- 2 days/yr
Risk factors via First Street. Map © Google.
Why this score? — see what drove the B+ grade
The composite is a weighted blend of 9 inputs, each scored 0–100. Each bar is that input's sub-score; the figure is the points it added to the 100-point composite (weight × sub-score).
- Cash flow +30.0/30.0
- ARV discount +15.0/15.0
- 1% rule +10.0/10.0
- DSCR +10.0/10.0
- Rent growth +3.1/5.0
- Livability +3.0/5.0
- Condition / age +2.5/5.0
- Schools +1.9/10.0
- Appreciation +0.0/10.0
$82,500
🖨 Deal sheet (PDF) 📄 Offer letter ✓ Due diligence
Listing remarks MLS
Must See!!! This Cute Bungalow has real potential !! Great investor opportunity! With nice hardwood floors, 3bd , 1bath located on a corner lot. Offering a home warranty!
Key facts
- Covered parking
- Open flow
- Corner lot
Tags
Property features AI
Exterior
- Utilities: Public water; Public sewer; Electricity available; Natural gas available
- Home design: Single-family house; One story
- Construction: Built with asbestos and brick veneer; Crawl space foundation
- Exterior features: No notable exterior features listed; Shed(s)
Interior
- Kitchen: Dishwasher; Range
- Flooring: Carpet; Laminate; Linoleum
- Bathrooms: 1 full bathroom
- Heating & cooling: Heat pump; Natural gas heating; Has cooling
- Interior features: Eat-in kitchen; Blinds
- Laundry & utility: Washer hookup; Electric dryer hookup
Neighborhood map
What this means for you Summary
Snapshot
- This is a 3-bed/1.0-bath single-family listed at $82k.
Deal economics
- At list price, monthly cash flow is $247 ($3k/yr) — positive.
- The deal already cash-flows at list — no discount required.
- Meets the 1% rule at list price ($1k rent vs $82k).
- Recommended offer: $81k (1.5% below list) — sets the bar for market timing.
- Cap rate 16.1% vs local median 3.4% in Sumter — top-decile yield for the area; either an underpriced asset or a hidden risk that comps aren't pricing in. Stress-test before assuming the spread holds.
Location & tenants
- Location reads 59/100 on livability (#235 in SC) — a working-class tenant base; expect higher turnover. Strengths: cost of living A+, health & safety A+, housing A-; Watch: crime F, amenities F, commute F.
- Sumter 01 (urban): math 18% / reading 28% proficiency, ranked #64 of 80 in SC (top 80%) — low school quality limits family demand, transient renter base, plan for 1-2y turnover; 64% free/reduced lunch — lower-income household profile, screen leases tightly.
- Zoned schools: Crosswell Drive Elementary (math 8% / reading 12%, grade F, #587 of 597 statewide, top 99%, 460 students, 100% FRL); Chestnut Oaks Middle (math 3% / reading 17%, grade F, #221 of 229 statewide, top 97%, 396 students, 100% FRL); Sumter High School (math 22% / reading 67%, grade F, #166 of 196 statewide, top 87%, 2,289 students, 100% FRL) — zoned schools average 100% FRL vs 64% district-wide (36 pts higher); higher-poverty schools than district average — tighter screening recommended.
- Market conditions: Rents rising (+2.5%/yr); 376 active listings in the ZIP; 386 units permitted in Sumter County in 2024 (0 in 5+ unit buildings).
Forward outlook
- Local home prices are declining (-3.0%/yr); year-one equity from $570 of loan paydown is wiped out by about $2k of value loss. Plan a longer hold.
- Sumter County population projected at -14% by 2050 — secular population decline; favor cash flow + early exit over multi-decade hold.
- At projected returns (-3.0% appreciation + 2.5% rent growth), your $23k cash investment doubles in ~10 years — after that, you're playing with house money.
Negotiation context
- It's been on market 23 days — a 2% lower offer ($81k) is reasonable based on typical stale-listing flexibility.
- 2 sale attempts since 8y ago; this cycle's ask has dropped $7k (8%) from the opening price — seller is motivated, your offer sets the floor, not the list.
- Current owner paid $36k; list at $82k implies a 126% gain — meaningful room to come down on a strong offer.
Risks & watch-outs
- Watch-outs: flood insurance adds $427/mo; built in 1951 — expect roof / HVAC / electrical / plumbing capex.
- Climate carrying-cost: in FEMA flood zone AE (mandatory federal flood insurance); severe wind risk, 80% chance of damaging wind over 30y; extreme-heat days projected 7→16/yr by 2055 (HVAC capex compounding) — expect insurance premiums to compound above CPI over the hold.
Questions for the listing agent
- Built in 1951 — when were the roof, HVAC, electrical panel, plumbing, and water heater last replaced?
- What's the actual annual flood-insurance premium (NFIP or private), and is the property in a SFHA with mandatory coverage?
- Is there a deadline driving the sale (1031 exchange, divorce, estate, relocation)? That informs how much negotiation room exists.
- Schools are D-rated, which usually means shorter tenancies and higher turnover. Who's the typical renter profile here, and what's been the actual vacancy rate?
- Crime grade is F in this area — have there been break-ins, vandalism, or insurance claims at this property in the last 3 years? What carrier currently insures it and at what premium?
- What's the average days-on-market for RENTAL listings here right now (not sales)? A rising rental-DOM trend means longer vacancies and softer asking-rent achievability than the comps imply.
- What's the recent tenant-quality profile in this submarket — average credit score on applications, eviction rate, late-payment / NSF rate, and stable-employment percentage? A property-management company in the area should have these aggregated.
- How much new for-sale + rental construction is in the pipeline within 1–3 miles? Heavy new supply typically softens prices + rents 12–24 months out; constrained supply supports both.
Investment metrics
- 1% rule
- 1.79% ✓
- Cap rate
- 16.09%
- Cash-on-cash
- 34.98%
- DSCR
- 2.56
- GRM
- 4.7
CMA / ARV
- ARV (on-the-fly)
- $114,042
- Comps found
- 12
Show comp detail 12 sales within ~0.75 mi
| Address | Dist | Beds/Ba | Sqft | Sold | Price | $/sf | Match |
|---|---|---|---|---|---|---|---|
| 701 Wen Le Dr | 0.33mi | 3/1.5 | 1,465 (+7%) | 5mo | $125,000 | $85 | 68 |
| 606 E Charlotte Ave | 0.24mi | 3/1.0 | 1,250 (-9%) | 11mo | $109,000 | $87 | 65 |
| 108 Emily Dr | 0.21mi | 3/1.0 | 1,271 (-8%) | 16mo | $87,000 | $68 | 65 |
| 401 Bagnal Dr | 0.16mi | 3/1.0 | 1,237 (-10%) | 15mo | $82,680 | $67 | 63 |
| 110 Phifer St | 0.62mi | 3/1.5 | 1,427 (+4%) | 1mo | $140,000 | $98 | 61 |
| 107 Emily Dr | 0.23mi | 3/1.0 | 1,237 (-10%) | 15mo | $79,500 | $64 | 60 |
| 526 E Charlotte Ave | 0.22mi | 3/1.0 | 1,198 (-13%) | 13mo | $160,000 | $134 | 58 |
| 609 E Charlotte Ave | 0.27mi | 3/1.0 | 1,203 (-12%) | 11mo | $144,000 | $120 | 58 |
| 16 Wilson St | 0.66mi | 3/1.0 | 1,310 (-5%) | 6mo | $49,000 | $37 | 56 |
| 525 Carrol Dr | 0.23mi | 3/1.0 | 1,175 (-14%) | 16mo | $47,500 | $40 | 51 |
| 313 Pinckney St | 0.72mi | 3/1.5 | 1,450 (+6%) | 7mo | $120,000 | $83 | 49 |
| 206 Crosswell Dr | 0.61mi | 3/2.0 | 1,579 (+15%) | 3mo | $110,000 | $70 | 40 |
Match score weights: distance 35% · size 25% · config 20% · recency 20%. Top-matched comps best support the ARV.
Projected returns pro-forma
-3.0% appreciation · 2.55% rent growth · sell at horizon
- IRR
- 2.2%
- Equity multiple
- 1.08×
- Total profit
- $1,929
- Equity at exit
- $12,301
- IRR
- 11.4%
- Equity multiple
- 1.87×
- Total profit
- $20,187
- Equity at exit
- $7,133
Cash invested: $23,100 (down + closing). Projections, not guarantees.
Landlord ↔ Tenant lean methodology
- Overall (STATE)
- 90 Strongly Landlord-Friendly
- State South Carolina
- 90 Strongly Landlord-Friendly · R+6
- County
- — inherits STATE
- City
- — inherits STATE
ZIP-level market 29150
- Rents YoY
- 2.5%
- Active inventory
- 376
- Price-to-rent
- 4.7×
Monthly cashflow live
- Estimated rent
- $1,478 medium interval (Pro) →
- Mortgage (P&I)
- −$433
- Tax from tax record
- −$27 /mo · $322/yr
- Insurance
- −$34
- Flood insurance flood zone
- −$427 /mo · $5,118/yr
- HOA
- −$0
- Vacancy / Maint / Mgmt
- −$310
- Net cashflow
- $247
Break-even live
Sensitivity live
| Price | -10% $294 | -5% $270 | +0% $247 | +5% $224 | +10% $200 |
|---|---|---|---|---|---|
| Rent | -10% $130 | -5% $189 | +0% $247 | +5% $305 | +10% $364 |
| Rate | -1.0pp $288 | -0.5pp $268 | base $247 | +0.5pp $226 | +1.0pp $204 |
UW: 25.0% down · 7.5% · 30yr · 1.5% tax · 5.0% vac · 8.0% maint · 8.0% mgmt
Financing live
Cash to close
- Down payment
- $20,625
- Closing costs
- $2,475
- Reserves months
- —
- Total cash needed
- —
Loan-product check · same deal, 3 products live
Conventional
25% down · 7.5% · 30yr
- Down + closing
- —
- Monthly P&I
- —
- Monthly cashflow
- —
- DSCR
- —
- Eligible?
- —
Personal DTI + credit; lowest rate.
DSCR
20% down · 8.5% · 30yr
- Down + closing
- —
- Monthly P&I
- —
- Monthly cashflow
- —
- DSCR
- —
- Eligible?
- —
No personal income docs; deal must DSCR.
Hard money
10% down · 12.0% · 12mo
- Down + closing
- —
- Monthly P&I
- —
- Monthly cashflow
- —
- DSCR
- —
- Eligible?
- —
Short-term bridge; refi at stabilization.
Listing history 15 events
-
2026-06-15status $82,500 Pending 23 DOM
-
2026-06-15days on market $82,500 Active 23 DOM
-
2026-06-14days on market $82,500 Active 21 DOM
-
2026-06-13days on market $82,500 Active 20 DOM
-
2026-06-10days on market $82,500 Active 18 DOM
-
2026-06-09days on market $82,500 Active 17 DOM
-
2026-06-08days on market $82,500 Active 16 DOM
-
2026-06-07pricedays on market $82,500 Active 15 DOM
-
2026-06-02days on market $89,500 Active 10 DOM
-
2026-06-01days on market $89,500 Active 9 DOM
-
2026-05-31days on market $89,500 Active 8 DOM
-
2026-05-30days on market $89,500 Active 7 DOM
-
2026-05-23$89,500 Active
-
2018-11-30soldstatus $36,500 171-char remark
Show marketing remark (171 chars)
Must See!!! This Cute Bungalow has real potential !! Great investor opportunity! With nice hardwood floors, 3bd , 1bath located on a corner lot. Offering a home warranty!
-
2018-11-07$38,500 171-char remark
Show marketing remark (171 chars)
Must See!!! This Cute Bungalow has real potential !! Great investor opportunity! With nice hardwood floors, 3bd , 1bath located on a corner lot. Offering a home warranty!
ⓘ Source: listings_history table (triggers on properties + properties_extension) + one-shot
backfill from property_details.listing_events for pre-trigger history.
Tax reassessment forecast SC · Resets to sale price
- Current annual tax
- $322 · $27/mo
- Projected year-2 tax
- $470 · $39/mo
- Expected delta
- +$148/yr (+$12/mo · 45.8%)
ⓘ Screening estimate from a state-policy table — verify with the county assessor before closing.
Climate risk First Street
- Flood 3/10 Moderate FEMA zone AE · 20% chance over 30 yrs
- Wildfire 3/10 Moderate
- Heat 7/10 Severe 7 d/yr ≥108°F today · 16 d/yr by 30 yrs out
- Wind 8/10 Severe 80% chance of damaging wind over 30 yrs
- Air quality 2/10 Low 2 unhealthy d/yr today · 2 by 30 yrs out
Nearby sold comps map
Loading sold comps map…
Walkable amenities ~0.75 mi
Loading nearby amenities…
Taxation est. · year 1
- Rental income
- $17,732
- − Mortgage interest
- −$4,621
- − Property taxes
- −$322
- − Insurance
- −$5,531
- − Repairs & maintenance
- −$1,419
- − Management
- −$1,419
- − Depreciation
- −$2,400
- Taxable income
- $2,020
- Est. tax owed @ 24.0%
- −$485
- After-tax cash flow
- $2,478/yr
For passive investors: Depreciation is non-cash, so a rental often shows a tax loss while cash-flowing — sheltering income. Rental losses are passive: they offset passive income freely, and up to $25,000/yr can offset ordinary (W-2) income if you actively participate and your MAGI is under $100k (phasing out to $0 by $150k); unused losses carry forward. On sale, claimed depreciation is recaptured at up to 25%, and gains may owe capital-gains tax (a 1031 exchange can defer both). Figures are a year-1 estimate at your 24.0% rate — not tax advice; consult a CPA.
Schools (NCES district)
- District
- Sumter 01
- NCES district ID
- 4503902
- Math proficiency
- 18% ▼ -13.00%
- Reading proficiency
- 28% ▼ -6.00%
- Median HH income
- $40,423
- Composite
- 19.45/100
- National rank
- #8775
- State rank
- #64 of 80 in SC
Livability — Sumter
- Score
- 59/100
- State rank
- #235
- US rank
- #19754
Category grades
Schools grade is shown separately in the Schools card above.
Census & demographics
- Census place
- Sumter, SC
- County
- Sumter County · 76,912 people
- City population
- 67,992
- Metro
- Sumter, SC
- Population (ZIP)
- 38,538
- Household income
- $50,965
- Rent vs Own
- Severe rent burden
- 1136.0
Population outlook (Sumter County) Hauer SSP2
- Today (2025)
- 104,585 people
- By 2030
- 102,282 · -2.2%
- By 2040
- 96,258 · -8.0%
- By 2050
- 89,592 · -14.3%
- By 2075
- 74,715 · -28.6%
- By 2100
- 60,235 · -42.4%
Race, ethnicity, and origin ACS 2023
- Neighborhood character
- Diverse neighborhood (Simpson 0.60)
- Race & ethnicity
- Black 50% White 39% Hispanic / Latino 5% Two or more races 4% Asian 2%
- Hispanic origin (detail)
- Mexican 3% Puerto Rican 1%
- Common ancestry
- Slovak 2% Lithuanian 1% Italian 1%
- Foreign-born
- 4% · Canada, China, Vietnam
- Languages at home
- 93% English-only · Spanish 4% Other Indo-European 1% German/W. Germanic 1%
Political lean MEDSL · Sumter
- 2024 margin
- Toss-up / Even · D 51.9% · R 47.0% · Other 1.2%
- 2008→2024 swing
- -10.6pp toward R · 2008: 15.4pp · 2024: 4.9pp
- All cycles
- 2024: D+4.9 2020: D+13.0 2016: D+12.0 2012: D+17.5 2008: D+15.4
Not yet ingested
- Civics
- —
Market trends
- HPI YoY
- ▼ -100.16%
- Current HPI
- 129.032
- Rent YoY
- ▲ 2.55%
- Metro
- Sumter, SC
- State GDP YoY
- ▲ 4.51%
- F500 in state
- 2
Industry mix (Fortune 500 HQ in SC)
| Industry | F500 HQs | Revenue |
|---|---|---|
| Packaging | 1 | $7B |
|
||
Price history
+132.5% since first listed3 events — show timeline
- 2026-05-23 Listed $89,500 SBOR
- 2018-11-30 Sold (MLS) $36,500 SBOR
- 2018-11-07 Listed $38,500 SBOR
Property tax history
+19.6%/yrLatest (2025): $322 · +1.9% YoY. Source: county tax records.
Cash-flow waterfall
monthlySold comps — $/sqft
last 12 mo · ≤1 miLoading sold comps…