 🏗️ New Construction
3229 Bolt Rope Dr · Texas City, TX
Flood risk 3/10 · Minor
- FEMA flood zone
- X (unshaded)
- Chance of flooding over 30 yrs
- 0.2%
- Est. flood insurance / yr
- $507 – $1,088
Fire risk 4/10 · Minor
- Est. fire insurance / yr
- $1,222 – $2,270
Heat risk 10/10 · Severe
- Hot days now (above 109°F)
- 7 days/yr
- Hot days in 30 yrs
- 26 days/yr
Wind risk 9/10 · Severe
- Chance of severe wind over 30 yrs
- 99.0%
Air-quality risk 2/10 · Minimal
- Unhealthy air days now
- 1 days/yr
- Unhealthy air days in 30 yrs
- 1 days/yr
Risk factors via First Street. Map © Google.
Why this score? — see what drove the D grade
The composite is a weighted blend of 9 inputs, each scored 0–100. Each bar is that input's sub-score; the figure is the points it added to the 100-point composite (weight × sub-score).
- Cash flow +12.5/30.0
- ARV discount +7.5/15.0
- 1% rule +4.0/10.0
- Condition / age +4.0/5.0
- DSCR +3.7/10.0
- Schools +3.5/10.0
- Livability +3.1/5.0
- Rent growth +2.5/5.0
- Appreciation +0.0/10.0
$341,990
🖨 Deal sheet (PDF) 📄 Offer letter ✓ Due diligence
Listing remarks
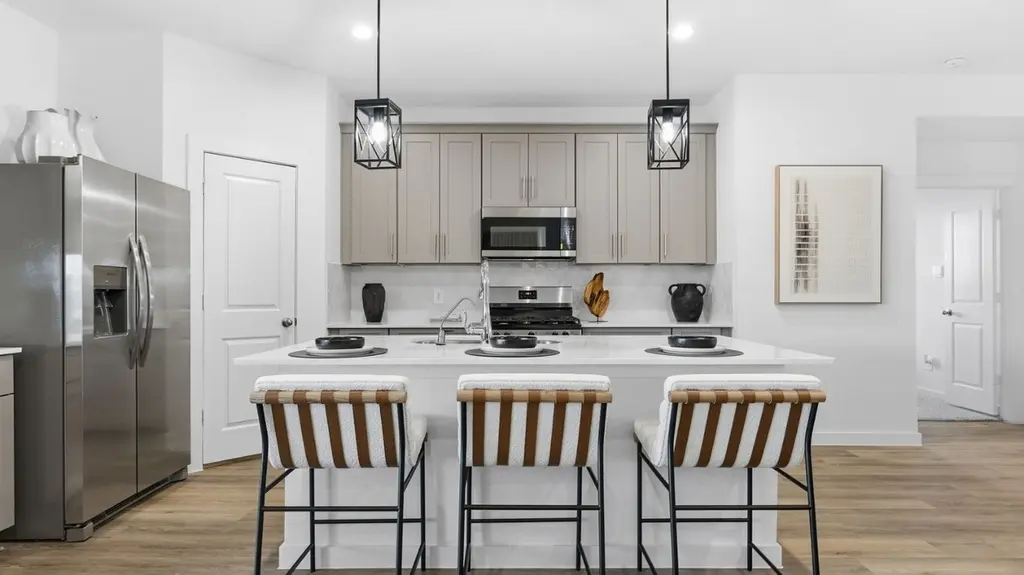
Welcome to the Burnet plan in the Lago Mar community! This single-story home spans 2,199sq ft and includes 4 bedrooms, 3 bathrooms, a private study, and a 2-car garage. As you enter, the long foyer with vinyl flooring leads to 2 secondary bedrooms and a secondary bathroom on one side, and a 3rd bedroom, secondary bathroom, and utility room on the other. The bedrooms have carpet, a tall closet, and a bright window, while the bathrooms feature vinyl flooring and a tub/shower combo. At the end of the foyer, you'll find the family room, breakfast room, and L-shaped kitchen. The kitchen includes a tall pantry and kitchen island. The private study is perfect for an office, library, or secondary b
Key facts
- Private study
- Kitchen island
- Tall pantry
Tags
Neighborhood map
What this means for you Summary
Snapshot
- This is a 4-bed/3.0-bath single-family listed at $342k. Condition is rated good.
Deal economics
- At list price, monthly cash flow is $-51 ($-616/yr) — negative.
- The deal already cash-flows at list — no discount required.
- To meet the 1% rule (rent ≥ 1% of price), the offer needs to be $316k (7.5% below list).
- Recommended offer: $316k (7.5% below list) — sets the bar for 1% rule.
- Cap rate 6.1% vs local median 4.3% in Texas City — top-decile yield for the area; either an underpriced asset or a hidden risk that comps aren't pricing in. Stress-test before assuming the spread holds.
Location & tenants
- Location reads 62/100 on livability (#907 in TX) — a middle-class / working-renter tenant base. Strengths: cost of living A+, housing A+; Watch: crime D+, amenities F, commute F.
- Dickinson ISD (suburban): math 39% / reading 40% proficiency, ranked #366 of 826 in TX (top 44%) — families likely to look elsewhere, expect single-tenant / working-renter base with shorter leases; 60% free/reduced lunch — lower-income household profile, screen leases tightly.
- Zoned schools: Hughes Road El (math 36% / reading 31%, grade F, #2,174 of 4,322 statewide, top 51%, 707 students, 67% FRL); Elva C Lobit Middle (math 31% / reading 27%, grade F, #1,103 of 1,662 statewide, top 67%, 582 students, 52% FRL); Dickinson H S (math 30% / reading 46%, grade F, #880 of 1,632 statewide, top 54%, 3,619 students, 64% FRL) — zoned schools at 61% FRL track the district average.
- Market conditions: Rents soft (-0.1%/yr); 678 active listings in the ZIP; 5 comparable units currently listed for rent nearby; rentals leasing fast (median 14d on market — plan ~1-2 weeks tenant-placement turnaround); solid renter incomes; 3,258 units permitted in Galveston County in 2024 (0 in 5+ unit buildings).
- This rent runs 43% of the median local income ($89k/yr) — at the standard rent-burdened threshold; future hikes will face affordability resistance.
Forward outlook
- Local home prices are declining (-3.0%/yr); year-one equity from $2k of loan paydown is wiped out by about $11k of value loss. Plan a longer hold.
- Galveston County population projected at +43% by 2050 — long-run rental-demand tailwind backs the buy-and-hold thesis.
Negotiation context
- Only 6 days on market — expect competitive offers; lowballing is unlikely to land.
Risks & watch-outs
- Climate carrying-cost: severe wind risk, 99% chance of damaging wind over 30y; extreme-heat days projected 7→26/yr by 2055 (HVAC capex compounding) — expect insurance premiums to compound above CPI over the hold.
Questions for the listing agent
- What do current leases actually rent for vs. the listed asking? Can we see a recent rent roll and the last 12 months of T-12 income?
- What does the HOA fee cover, when was the last increase, and are there any pending special assessments or reserve-fund shortfalls?
- Is there a deadline driving the sale (1031 exchange, divorce, estate, relocation)? That informs how much negotiation room exists.
- Schools are F-rated, which usually means shorter tenancies and higher turnover. Who's the typical renter profile here, and what's been the actual vacancy rate?
- Crime grade is D in this area — have there been break-ins, vandalism, or insurance claims at this property in the last 3 years? What carrier currently insures it and at what premium?
- The area grade is low — what's the realistic commute time and amenity access for the typical tenant pool here? Any planned neighborhood developments (good or bad) we should know about?
- What's the average days-on-market for RENTAL listings here right now (not sales)? A rising rental-DOM trend means longer vacancies and softer asking-rent achievability than the comps imply.
- What's the recent tenant-quality profile in this submarket — average credit score on applications, eviction rate, late-payment / NSF rate, and stable-employment percentage? A property-management company in the area should have these aggregated.
- How much new for-sale + rental construction is in the pipeline within 1–3 miles? Heavy new supply typically softens prices + rents 12–24 months out; constrained supply supports both.
Investment metrics
- 1% rule
- 0.90% ✗
- Cap rate
- 6.12%
- Cash-on-cash
- -0.62%
- DSCR
- 0.97
- GRM
- 9.3
CMA / ARV
- ARV (on-the-fly)
- $351,840
- Comps found
- 12
Show comp detail 12 sales within ~0.75 mi
| Address | Dist | Beds/Ba | Sqft | Sold | Price | $/sf | Match |
|---|---|---|---|---|---|---|---|
| 14121 Baikal Manor Dr | 0.19mi | 4/3.0 | 2,214 (+1%) | 1mo | $349,990 | $158 | 90 |
| 3315 Hidden Mist Dr | 0.16mi | 3/2.5 (-1) | 2,160 (-2%) | 1mo | $344,990 | $160 | 82 |
| 3214 Bolt Rope Dr | 0.04mi | 4/2.5 | 2,452 (+12%) | 1mo | $339,990 | $139 | 76 |
| 14117 Baikal Manor Dr | 0.19mi | 4/2.0 | 2,063 (-6%) | 1mo | $312,990 | $152 | 76 |
| 14006 Baikal Manor Dr | 0.31mi | 4/2.0 | 2,126 (-3%) | 1mo | $325,990 | $153 | 75 |
| 14318 Lunan Dr | 0.48mi | 4/2.5 | 2,280 (+4%) | 1mo | $364,987 | $160 | 69 |
| 13601 Fairway Arbor Dr | 0.27mi | 3/2.5 (-1) | 2,377 (+8%) | 1mo | $394,990 | $166 | 66 |
| 3005 Mariner Island Dr | 0.72mi | 4/3.0 | 2,229 (+1%) | 1mo | $386,990 | $174 | 63 |
| 2921 Mariner Island Dr | 0.73mi | 4/2.0 | 2,081 (-5%) | 1mo | $375,990 | $181 | 52 |
| 13714 Seneca Lake Dr | 0.75mi | 4/2.0 | 2,020 (-8%) | 1mo | $291,400 | $144 | 47 |
| 2917 Mariner Island Dr | 0.73mi | 4/2.0 | 1,922 (-13%) | 1mo | $360,990 | $188 | 40 |
| 13525 Bonita Island Way | 0.66mi | 3/2.0 (-1) | 1,900 (-14%) | 1mo | $288,900 | $152 | 37 |
Match score weights: distance 35% · size 25% · config 20% · recency 20%. Top-matched comps best support the ARV.
Projected returns pro-forma
-3.0% appreciation · 0.0% rent growth · sell at horizon
- IRR
- -20.9%
- Equity multiple
- 0.30×
- Total profit
- $-69,428
- Equity at exit
- $52,460
- IRR
- -23.7%
- Equity multiple
- -0.01×
- Total profit
- $-99,990
- Equity at exit
- $30,421
Cash invested: $98,515 (down + closing). Projections, not guarantees.
Landlord ↔ Tenant lean methodology
- Overall (STATE)
- 87 Strongly Landlord-Friendly
- State Texas
- 87 Strongly Landlord-Friendly · R+5
- County
- — inherits STATE
- City
- — inherits STATE
ZIP-level market 77539
- Home prices YoY
- -29.8%
- Rents YoY
- -0.1%
- Active inventory
- 678
- Price-to-rent
- 9.0×
Monthly cashflow live
- Estimated rent
- $3,162 high interval (Pro) →
- Mortgage (P&I)
- −$1,845
- Tax est. 1.5%
- −$440 /mo · $5,278/yr
- Insurance
- −$147
- HOA
- −$118
- Vacancy / Maint / Mgmt
- −$664
- Net cashflow
- $-51
Break-even live
Sensitivity live
| Price | -10% $192 | -5% $70 | +0% $-51 | +5% $-173 | +10% $-294 |
|---|---|---|---|---|---|
| Rent | -10% $-301 | -5% $-176 | +0% $-51 | +5% $74 | +10% $199 |
| Rate | -1.0pp $126 | -0.5pp $38 | base $-51 | +0.5pp $-142 | +1.0pp $-235 |
UW: 25.0% down · 7.5% · 30yr · 1.5% tax · 5.0% vac · 8.0% maint · 8.0% mgmt
Financing live
Cash to close
- Down payment
- $87,960
- Closing costs
- $10,555
- Reserves months
- —
- Total cash needed
- —
Loan-product check · same deal, 3 products live
Conventional
25% down · 7.5% · 30yr
- Down + closing
- —
- Monthly P&I
- —
- Monthly cashflow
- —
- DSCR
- —
- Eligible?
- —
Personal DTI + credit; lowest rate.
DSCR
20% down · 8.5% · 30yr
- Down + closing
- —
- Monthly P&I
- —
- Monthly cashflow
- —
- DSCR
- —
- Eligible?
- —
No personal income docs; deal must DSCR.
Hard money
10% down · 12.0% · 12mo
- Down + closing
- —
- Monthly P&I
- —
- Monthly cashflow
- —
- DSCR
- —
- Eligible?
- —
Short-term bridge; refi at stabilization.
Rent comps 5 comps
| Address | Beds | Baths | Sqft | Rent | $/sqft | DOM | Units | Dist |
|---|---|---|---|---|---|---|---|---|
| 13817 Starboard Reach Dr Santa Fe, TX | 3.0–4.0 | 2.0–3.5 | 2268 | $3,630 | $1.60 | 0d | 1 | 0.01mi |
| 6136 Lago Mar Blvd Dickinson, TX | 3.0 | 2.0 | 1417 | $1,900 | $1.34 | 45d | 1 | 1.07mi |
| 6130 Lago Mar Blvd Texas City, TX | 1.0–3.0 | 1.0–2.0 | 1066 | $2,199 | $2.06 | 5d | 2 | 1.22mi |
| 12524 Jetty Cv Santa Fe, TX | 3.0 | 2.0 | 1803 | $2,506 | $1.39 | 23d | 1 | 1.43mi |
| 640 Totem Trail Dr La Marque, TX | 4.0 | 2.5 | 2134 | $2,309 | $1.08 | 13d | 1 | 1.45mi |
HOA detail
- Monthly dues
- $118 · $1,416/yr
Listing history 2 events
-
2026-04-07status Pending
-
2026-04-01$341,990 Active
ⓘ Source: listings_history table (triggers on properties + properties_extension) + one-shot
backfill from property_details.listing_events for pre-trigger history.
Climate risk First Street
- Flood 3/10 Moderate FEMA zone X (unshaded) · 20% chance over 30 yrs
- Wildfire 4/10 Moderate
- Heat 10/10 Extreme 7 d/yr ≥109°F today · 26 d/yr by 30 yrs out
- Wind 9/10 Extreme 99% chance of damaging wind over 30 yrs
- Air quality 2/10 Low 1 unhealthy d/yr today · 1 by 30 yrs out
Nearby sold comps map
Loading sold comps map…
Walkable amenities ~0.75 mi
Loading nearby amenities…
Taxation est. · year 1
- Rental income
- $37,947
- − Mortgage interest
- −$19,709
- − Property taxes
- −$5,278
- − Insurance
- −$1,759
- − Repairs & maintenance
- −$3,036
- − Management
- −$3,036
- − HOA
- −$1,416
- − Depreciation
- −$10,235
- Taxable loss
- −$6,521
- Est. tax savings @ 24.0%
- +$1,565
- After-tax cash flow
- $949/yr
For passive investors: Depreciation is non-cash, so a rental often shows a tax loss while cash-flowing — sheltering income. Rental losses are passive: they offset passive income freely, and up to $25,000/yr can offset ordinary (W-2) income if you actively participate and your MAGI is under $100k (phasing out to $0 by $150k); unused losses carry forward. On sale, claimed depreciation is recaptured at up to 25%, and gains may owe capital-gains tax (a 1031 exchange can defer both). Figures are a year-1 estimate at your 24.0% rate — not tax advice; consult a CPA.
Condition & rehab AI · 13 photos
This single-story home in the Lago Mar community is in good condition with modern finishes and a well-maintained exterior. It is ready for immediate occupancy and would benefit from a fresh coat of paint on the exterior trim to enhance its curb appeal.
Value-add opportunities
- Resale Paint exterior trim — Enhances curb appeal and can increase property value.
- Rental Clean gutters — Keeps property in good condition and reduces maintenance costs for tenants.
Renovation cost estimate screening
Value-add ROI direction
- Resale Paint exterior trim — Enhances curb appeal and can increase property value. ↑
- Rental Clean gutters — Keeps property in good condition and reduces maintenance costs for tenants. ↑
ⓘ Cost ranges are severity-bucket heuristics (US national rule-of-thumb). Get contractor quotes + a written scope before underwriting a rehab budget.
Schools (NCES district)
- District
- Dickinson ISD
- NCES district ID
- 4817070
- Math proficiency
- 39% ▼ -11.00%
- Reading proficiency
- 40% ▼ -2.00%
- Median HH income
- $61,318
- Composite
- 35.16/100
- National rank
- #5005
- State rank
- #366 of 826 in TX
Livability — Texas City
- Score
- 62/100
- State rank
- #907
- US rank
- #16268
Category grades
Schools grade is shown separately in the Schools card above.
Census & demographics
- Census place
- Texas City, TX
- County
- Galveston County · 357,330 people
- City population
- 49,936
- Metro
- Houston-The Woodlands-Sugar Land, TX
- Population (ZIP)
- 49,375
- Household income
- $89,111
- Rent vs Own
- Severe rent burden
- 869.0
Population outlook (Galveston County) Hauer SSP2
- Today (2025)
- 390,640 people
- By 2030
- 425,226 · +8.9%
- By 2040
- 493,765 · +26.4%
- By 2050
- 559,698 · +43.3%
- By 2075
- 719,260 · +84.1%
- By 2100
- 819,628 · +109.8%
Race, ethnicity, and origin ACS 2023
- Neighborhood character
- Diverse neighborhood (Simpson 0.64)
- Race & ethnicity
- White 47% Hispanic / Latino 37% Two or more races 19% Black 10% Asian 3%
- Hispanic origin (detail)
- Mexican 29% Puerto Rican 2%
- Common ancestry
- Italian 3% Romanian 2% Lithuanian 1%
- Foreign-born
- 13% · Canada, Vietnam
- Languages at home
- 73% English-only · Spanish 24% Vietnamese 1% Other Indo-European 1%
Political lean MEDSL · Galveston
- 2024 margin
- Strong R (+27.4) · D 35.7% · R 63.1% · Other 1.2%
- 2008→2024 swing
- -7.9pp toward R · 2008: -19.5pp · 2024: -27.4pp
- All cycles
- 2024: R+27.4 2020: R+22.6 2016: R+22.6 2012: R+26.9 2008: R+19.5
Not yet ingested
- Civics
- —
Market trends
- HPI YoY
- ▼ -109.46%
- Current HPI
- 258.0104
- Rent YoY
- ▼ -0.12%
- Metro
- Houston-The Woodlands-Sugar Land, TX
- State GDP YoY
- ▲ 3.95%
- F500 in state
- 110
Industry mix (Fortune 500 HQ in TX)
| Industry | F500 HQs | Revenue |
|---|---|---|
| Energy | 16 | $1,198B |
|
||
| Technology | 5 | $198B |
|
||
| Engineering / Construction | 4 | $72B |
|
||
| Energy Services | 3 | $60B |
|
||
| Utilities | 3 | $41B |
|
||
| Healthcare | 2 | $330B |
|
||
Price history
2 events — show timeline
- 2026-04-07 Pending — HARMLS
- 2026-04-01 Listed $341,990 HARMLS
Cash-flow waterfall
monthlySold comps — $/sqft
last 12 mo · ≤1 miLoading sold comps…