700 S Hollybrook Dr #304 · Pembroke Pines, FL
Flood risk 1/10 · Minimal
- FEMA flood zone
- X (shaded)
- Chance of flooding over 30 yrs
- 0.0%
- Est. flood insurance / yr
- $507 – $1,088
Fire risk 1/10 · Minimal
- Est. fire insurance / yr
- $947 – $1,759
Heat risk 9/10 · Severe
- Hot days now (above 105°F)
- 5 days/yr
- Hot days in 30 yrs
- 20 days/yr
Wind risk 10/10 · Severe
- Chance of severe wind over 30 yrs
- 99.0%
Air-quality risk 2/10 · Minimal
- Unhealthy air days now
- 2 days/yr
- Unhealthy air days in 30 yrs
- 2 days/yr
Risk factors via First Street. Map © Google.
Why this score? — see what drove the D grade
The composite is a weighted blend of 9 inputs, each scored 0–100. Each bar is that input's sub-score; the figure is the points it added to the 100-point composite (weight × sub-score).
- Cash flow +12.0/30.0
- ARV discount +7.5/15.0
- 1% rule +7.1/10.0
- Livability +4.2/5.0
- Schools +4.1/10.0
- DSCR +3.5/10.0
- Condition / age +2.5/5.0
- Rent growth +2.3/5.0
- Appreciation +0.0/10.0
$185,000
🖨 Deal sheet (PDF) 📄 Offer letter ✓ Due diligence
Listing remarks
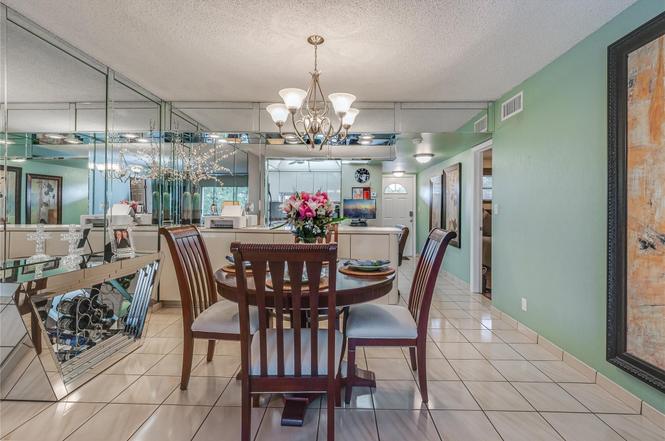
AMAZING! PRIDE OF OWNERSHIP IN EVERY DETAIL! 2BR/2BA, tranquil golf, lake & running creek views. Open kitchen w/ easy maintenance metal cabinetry & full backsplash. Extra counter space. QUALITY FULLY FURNISHED! 24 hr guard gated. Recreation Lease PAID IN FULL! Across from Pool & Par 3 Golf Views in back. 100% waterproof flooring throughout. Bathrooms updated. FREE golf (except cart fees) on two 18 hole courses (PGA & Par3); Amenities include Restaurant, Billiard Room, Bbq/Picnic Area, Clubhouse, Courtesy Bus, Exercise Room, Heated Pool, Library, Putting Green, Sauna, Shuffleboard, Tennis, Pickle Ball, Vehicle Wash Area, Electric Car Charging Station. Close to shoppin
Key facts
- Golf views
- Full backsplash
- Lake views
Tags
Property features AI
Finance
- Other: Senior community; Pets allowed with number and size limits
- HOA & community: Has association; Quarterly HOA dues (amount listed separately); Association amenities include: billiard room, car wash area, fitness center, picnic area, sauna, shuffleboard court, bocce ball, cafe/restaurant, courtesy bus, internet included, library, pickleball courts, putting green, security; HOA covers grounds and structure maintenance, sewer, trash, water, elevator, golf, reserve funds, roof repairs, recreation facility, pool service
Exterior
- Parking: Assigned parking; Guest parking
- Security: Security guard; Security fence; Security patrol
- Utilities: Cable available
- Home design: Condominium; 3-story building; Resale property; Faces west
- Construction: CBS construction
- Exterior features: Screened porch; Fenced; On golf course; Waterfront (no specific waterfront features listed)
Interior
- Kitchen: Disposal; Dishwasher; Electric range; Microwave; Refrigerator
- Bedrooms: 2 bedrooms on the main level
- Flooring: Ceramic tile; Laminate
- Bathrooms: 2 full bathrooms on the main level
- Heating & cooling: Central heating; Central air conditioning
- Interior features: Entrance foyer; Walk-in closet(s); Split bedroom layout; Furnished
Neighborhood map
What this means for you Summary
Snapshot
- This is a 2-bed/2.0-bath condo listed at $185k.
Deal economics
- At list price, monthly cash flow is $-44 ($-524/yr) — negative.
- To cash-flow at today's rent, offer at most $177k (4.2% below list).
- Meets the 1% rule at list price ($2k rent vs $185k).
- Recommended offer: $168k (9.0% below list) — sets the bar for market timing.
- Cap rate 6.0% vs local median 4.0% in Pembroke Pines — top-decile yield for the area; either an underpriced asset or a hidden risk that comps aren't pricing in. Stress-test before assuming the spread holds.
Location & tenants
- Location reads 83/100 on livability (#54 in FL, #933 nationally) — a professional / high-income tenant draw. Strengths: housing A+, health & safety A+, crime A-; Watch: amenities D+, cost of living D+.
- Broward (suburban): math 42% / reading 53% proficiency, ranked #46 of 73 in FL (top 63%) — families likely to look elsewhere, expect single-tenant / working-renter base with shorter leases.
- Zoned schools: Palm Cove Elementary School (math 25% / reading 46%, grade F, #1,684 of 2,144 statewide, top 79%, 438 students, 64% FRL); Pines Middle School (math 20% / reading 37%, grade F, #482 of 571 statewide, top 85%, 597 students, 67% FRL); Charles W Flanagan High School (math 29% / reading 50%, grade F, #304 of 667 statewide, top 47%, 2,475 students, 57% FRL).
- Zoned-school proficiency averages 34% at this address vs 48% district-wide (-13 pts) — the specific schools serving this property underperform the Broward average; the district grade overstates school quality for this exact location.
- Market conditions: Rents soft (-0.9%/yr); 446 active listings in the ZIP; 40 comparable units currently listed for rent nearby; rentals at typical pace (median 26d on market — plan ~3-4 weeks tenant-placement turnaround); 2,111 units permitted in Broward County in 2024 (1,265 in 5+ unit buildings).
- This rent runs 39% of the median local income ($69k/yr) — at the standard rent-burdened threshold; future hikes will face affordability resistance.
Forward outlook
- Local home prices are declining (-3.0%/yr); year-one equity from $1k of loan paydown is wiped out by about $6k of value loss. Plan a longer hold.
- Broward County population projected at +34% by 2050 — long-run rental-demand tailwind backs the buy-and-hold thesis.
Negotiation context
- It's been on market 102 days — a 9% lower offer ($168k) is reasonable based on typical stale-listing flexibility.
- Current owner paid $59k; list at $185k implies a 214% gain — meaningful room to come down on a strong offer.
Risks & watch-outs
- Watch-outs: HOA is 31% of rent.
- Climate carrying-cost: severe wind risk, 99% chance of damaging wind over 30y; extreme-heat days projected 5→20/yr by 2055 (HVAC capex compounding) — expect insurance premiums to compound above CPI over the hold.
Questions for the listing agent
- What do current leases actually rent for vs. the listed asking? Can we see a recent rent roll and the last 12 months of T-12 income?
- It's been on market 102 days. Have you received any prior offers? Is the seller open to a 9% concession, seller financing, or rate buy-down credit?
- Built in 1974 — when were the roof, HVAC, electrical panel, plumbing, and water heater last replaced?
- What does the HOA fee cover, when was the last increase, and are there any pending special assessments or reserve-fund shortfalls?
- Any open or pending special assessments — roof, HVAC, plumbing, elevator, façade? What's the per-unit balance and payoff schedule, and is the seller paying it off at close or rolling it to the buyer?
- Why hasn't it sold? Are there any deal-killer items the seller is aware of (foundation, flood, title, zoning, code violations)?
- Is there a deadline driving the sale (1031 exchange, divorce, estate, relocation)? That informs how much negotiation room exists.
- Schools are A-rated — typically a magnet for longer-tenancy family renters. What's the average tenant stay here, and is there a school-zone premium baked into asking?
- The area grade is low — what's the realistic commute time and amenity access for the typical tenant pool here? Any planned neighborhood developments (good or bad) we should know about?
- What's the average days-on-market for RENTAL listings here right now (not sales)? A rising rental-DOM trend means longer vacancies and softer asking-rent achievability than the comps imply.
- What's the recent tenant-quality profile in this submarket — average credit score on applications, eviction rate, late-payment / NSF rate, and stable-employment percentage? A property-management company in the area should have these aggregated.
- How much new apartment / multifamily construction is in the pipeline within 1–3 miles? Heavy new supply (>2% of stock underway) typically softens rents 12–24 months out; light construction supports rent growth.
Investment metrics
- 1% rule
- 1.21% ✓
- Cap rate
- 6.01%
- Cash-on-cash
- -1.01%
- DSCR
- 0.95
- GRM
- 6.9
CMA / ARV
No comps found within radius.
Projected returns pro-forma
-3.0% appreciation · 0.0% rent growth · sell at horizon
- IRR
- -22.7%
- Equity multiple
- 0.25×
- Total profit
- $-38,979
- Equity at exit
- $27,584
- IRR
- -35.2%
- Equity multiple
- -0.19×
- Total profit
- $-61,482
- Equity at exit
- $15,995
Cash invested: $51,800 (down + closing). Projections, not guarantees.
Landlord ↔ Tenant lean methodology
- Overall (STATE)
- 87 Strongly Landlord-Friendly
- State Florida
- 87 Strongly Landlord-Friendly · R+3
- County
- — inherits STATE
- City
- — inherits STATE
ZIP-level market 33025
- Rents YoY
- -0.9%
- Active inventory
- 446
- Price-to-rent
- 6.9×
Monthly cashflow live
- Estimated rent
- $2,246 high interval (Pro) →
- Mortgage (P&I)
- −$970
- Tax from tax record
- −$64 /mo · $769/yr
- Insurance
- −$77
- HOA
- −$707
- Vacancy / Maint / Mgmt
- −$472
- Net cashflow
- $-44
Break-even live
Sensitivity live
| Price | -10% $61 | -5% $9 | +0% $-44 | +5% $-96 | +10% $-148 |
|---|---|---|---|---|---|
| Rent | -10% $-221 | -5% $-132 | +0% $-44 | +5% $45 | +10% $134 |
| Rate | -1.0pp $49 | -0.5pp $3 | base $-44 | +0.5pp $-92 | +1.0pp $-140 |
UW: 25.0% down · 7.5% · 30yr · 1.5% tax · 5.0% vac · 8.0% maint · 8.0% mgmt
Financing live
Cash to close
- Down payment
- $46,250
- Closing costs
- $5,550
- Reserves months
- —
- Total cash needed
- —
Loan-product check · same deal, 3 products live
Conventional
25% down · 7.5% · 30yr
- Down + closing
- —
- Monthly P&I
- —
- Monthly cashflow
- —
- DSCR
- —
- Eligible?
- —
Personal DTI + credit; lowest rate.
DSCR
20% down · 8.5% · 30yr
- Down + closing
- —
- Monthly P&I
- —
- Monthly cashflow
- —
- DSCR
- —
- Eligible?
- —
No personal income docs; deal must DSCR.
Hard money
10% down · 12.0% · 12mo
- Down + closing
- —
- Monthly P&I
- —
- Monthly cashflow
- —
- DSCR
- —
- Eligible?
- —
Short-term bridge; refi at stabilization.
Rent comps 40 comps
| Address | Beds | Baths | Sqft | Rent | $/sqft | DOM | Units | Dist |
|---|---|---|---|---|---|---|---|---|
| 671 S Hollybrook Dr #209 Pembroke Pines, FL | 2.0 | 2.0 | 1170 | $1,900 | $1.62 | 26d | 1 | 0.05mi |
| 811 S Hollybrook Dr #208 Pembroke Pines, FL | 2.0 | 2.0 | 1170 | $2,500 | $2.14 | 26d | 1 | 0.07mi |
| 681 S Hollybrook Dr #305 Pembroke Pines, FL | 2.0 | 2.0 | 1050 | $1,995 | $1.90 | 26d | 1 | 0.08mi |
| 820 S Hollybrook Dr #209 Pembroke Pines, FL | 2.0 | 2.0 | 1170 | $2,900 | $2.48 | 26d | 1 | 0.09mi |
| 8960 S Hollybrook Blvd #301 Pembroke Pines, FL | 2.0 | 2.0 | 1170 | $2,800 | $2.39 | 6d | 1 | 0.10mi |
| 8940 S Hollybrook Blvd Pembroke Pines, FL | 2.0 | 2.0 | 1170 | $1,725 | $1.47 | 23d | 2 | 0.10mi |
| 8941 S Hollybrook Blvd #203 Pembroke Pines, FL | 2.0 | 2.0 | 1170 | $2,200 | $1.88 | 9d | 1 | 0.12mi |
| 8941 S Hollybrook Blvd #203 Pembroke Pines, FL | 2.0 | 2.0 | 1170 | $2,200 | $1.88 | 26d | 1 | 0.12mi |
| 830 S Hollybrook Dr #204 Pembroke Pines, FL | 2.0 | 2.0 | 1170 | $1,700 | $1.45 | 7d | 1 | 0.13mi |
| 830 S Hollybrook Dr #204 Pembroke Pines, FL | 2.0 | 2.0 | 1170 | $1,700 | $1.45 | 26d | 1 | 0.13mi |
| 8990 S Hollybrook Blvd Pembroke Pines, FL | 1.0–2.0 | 1.5–2.0 | 1035 | $2,000 | $1.93 | 6d | 2 | 0.16mi |
| 8900 Washington Blvd #410 Pembroke Pines, FL | 1.0 | 1.5 | 800 | $3,100 | $3.88 | 3d | 1 | 0.16mi |
| 8900 Washington Blvd #410 Pembroke Pines, FL | 1.0 | 1.5 | 800 | $3,100 | $3.88 | 26d | 1 | 0.16mi |
| 381 S Hollybrook Dr #106 Pembroke Pines, FL | 1.0 | 1.5 | 900 | $1,700 | $1.89 | 26d | 1 | 0.19mi |
| 400 S Hollybrook Dr #202 Pembroke Pines, FL | 2.0 | 2.0 | 1170 | $1,900 | $1.62 | 26d | 1 | 0.19mi |
| 320 Palm Cir E #320 Pembroke Pines, FL | 2.0 | 2.5 | 1113 | $2,500 | $2.25 | 26d | 1 | 0.29mi |
| 8886 SW 3rd St #204 Pembroke Pines, FL | 2.0 | 2.0 | 985 | $2,200 | $2.23 | 23d | 1 | 0.29mi |
| 8886 SW 3rd St #204 Pembroke Pines, FL | 2.0 | 2.0 | 985 | $2,200 | $2.23 | 5d | 1 | 0.29mi |
| 306 Palm Cir E Pembroke Pines, FL | 2.0 | 2.0 | 1016 | $2,250 | $2.21 | 5d | 1 | 0.31mi |
| 351 Palm Way Pembroke Pines, FL | 1.0–2.0 | 1.0–2.0 | 787 | $2,095 | $2.66 | 7d | 2 | 0.34mi |
| 8657 SW 5th St Pembroke Pines, FL | 2.0 | 1.0–2.0 | 877 | $2,125 | $2.42 | 23d | 2 | 0.34mi |
| 9475 Palm Cir N Unit 9475 Pembroke Pines, FL | 2.0 | 2.5 | 1113 | $2,300 | $2.07 | 5d | 1 | 0.35mi |
| 9475 Palm Cir N Unit 9475 Pembroke Pines, FL | 2.0 | 2.5 | 1113 | $2,400 | $2.16 | 26d | 1 | 0.35mi |
| 8657 SW 5th St #205 Pembroke Pines, FL | 2.0 | 2.0 | 985 | $2,350 | $2.39 | 20d | 1 | 0.35mi |
| 8710 SW 3rd St #201 Pembroke Pines, FL | 1.0 | 2.0 | 805 | $1,800 | $2.24 | 26d | 1 | 0.35mi |
| 9800 N Hollybrook Lake Dr Unit 9-303 Pembroke Pines, FL | 2.0 | 2.0 | 1170 | $1,700 | $1.45 | 26d | 1 | 0.35mi |
| 301 Palm Cir W Unit 301 Pembroke Pines, FL | 2.0 | 2.0 | 1016 | $2,100 | $2.07 | 0d | 1 | 0.38mi |
| 251 Palm Cir W #206 Pembroke Pines, FL | 2.0 | 2.0 | 1016 | $2,300 | $2.26 | 26d | 1 | 0.38mi |
| 306 Palm Cir W Unit 306 Pembroke Pines, FL | 2.0 | 2.0 | 1016 | $2,350 | $2.31 | 26d | 1 | 0.39mi |
| 203 Palm Cir W Unit 203 Pembroke Pines, FL | 2.0 | 2.0 | 1016 | $2,200 | $2.17 | 14d | 1 | 0.40mi |
| 300 Palm Cir W Unit 305 Pembroke Pines, FL | 1.0 | 1.0 | 739 | $1,700 | $2.30 | 13d | 1 | 0.40mi |
| 107 Palm Cir W Unit 107 Pembroke Pines, FL | 2.0 | 1.0 | 881 | $2,100 | $2.38 | 26d | 1 | 0.41mi |
| 250 Palm Cir W #204 Pembroke Pines, FL | 1.0 | 1.0 | 739 | $1,700 | $2.30 | 26d | 1 | 0.43mi |
| 417 Palm Cir #417 Pembroke Pines, FL | 2.0 | 2.5 | 1113 | $2,275 | $2.04 | 7d | 1 | 0.46mi |
| 301 SW 86th Ave #204 Pembroke Pines, FL | 2.0 | 2.0 | 985 | $2,300 | $2.34 | 6d | 1 | 0.46mi |
| 433 SW 86th Ave #108 Pembroke Pines, FL | 2.0 | 1.0 | 770 | $2,000 | $2.60 | 26d | 1 | 0.47mi |
| 9423 S Hollybrook Lake Dr #203 Pembroke Pines, FL | 2.0 | 2.0 | 1170 | $2,000 | $1.71 | 26d | 1 | 0.47mi |
| 142 NW 91st Ave #104 Pembroke Pines, FL | 2.0 | 2.0 | 787 | $2,050 | $2.60 | 26d | 1 | 0.48mi |
| 9117 NW 1st Ct #105 Pembroke Pines, FL | 2.0 | 2.0 | 787 | $1,990 | $2.53 | 16d | 1 | 0.48mi |
| 9220 NW 1st St #101 Pembroke Pines, FL | 2.0 | 2.0 | 787 | $2,300 | $2.92 | 0d | 1 | 0.48mi |
HOA detail condo
- Monthly dues
- $707 · $8,484/yr
- Likely covers
- waterelectricpoolsecurity
- Assessments
- None detected in remarks — confirm with the listing agent.
Listing history 19 events
-
2026-06-21days on market $185,000 Active 102 DOM
-
2026-06-18days on market $185,000 Active 99 DOM
-
2026-06-17days on market $185,000 Active 98 DOM
-
2026-06-16days on market $185,000 Active 97 DOM
-
2026-06-15days on market $185,000 Active 96 DOM
-
2026-06-13days on market $185,000 Active 94 DOM
-
2026-06-09days on market $185,000 Active 90 DOM
-
2026-06-08days on market $185,000 Active 89 DOM
-
2026-06-07days on market $185,000 Active 88 DOM
-
2026-06-04days on market $185,000 Active 85 DOM
-
2026-06-03days on market $185,000 Active 84 DOM
-
2026-06-02days on market $185,000 Active 83 DOM
-
2026-06-01days on market $185,000 Active 82 DOM
-
2026-05-31days on market $185,000 Active 81 DOM
-
2026-03-01$185,000 Active
-
2013-06-03soldstatus $59,000
-
2006-04-26soldstatus $135,000
-
2002-10-22soldstatus $78,900
-
1974-12-01soldstatus $30,800
ⓘ Source: listings_history table (triggers on properties + properties_extension) + one-shot
backfill from property_details.listing_events for pre-trigger history.
Tax reassessment forecast FL · Resets to sale price
- Current annual tax
- $769 · $64/mo
- Projected year-2 tax
- $1,536 · $128/mo
- Expected delta
- +$766/yr (+$64/mo · 99.6%)
ⓘ Screening estimate from a state-policy table — verify with the county assessor before closing.
Climate risk First Street
- Flood 1/10 Low FEMA zone X (shaded) · 0% chance over 30 yrs
- Wildfire 1/10 Low
- Heat 9/10 Extreme 5 d/yr ≥105°F today · 20 d/yr by 30 yrs out
- Wind 10/10 Extreme 99% chance of damaging wind over 30 yrs
- Air quality 2/10 Low 2 unhealthy d/yr today · 2 by 30 yrs out
Nearby sold comps map
Loading sold comps map…
Walkable amenities ~0.75 mi
Loading nearby amenities…
Taxation est. · year 1
- Rental income
- $26,957
- − Mortgage interest
- −$10,363
- − Property taxes
- −$769
- − Insurance
- −$925
- − Repairs & maintenance
- −$2,157
- − Management
- −$2,157
- − HOA
- −$8,484
- − Depreciation
- −$5,382
- Taxable loss
- −$3,279
- Est. tax savings @ 24.0%
- +$787
- After-tax cash flow
- $263/yr
For passive investors: Depreciation is non-cash, so a rental often shows a tax loss while cash-flowing — sheltering income. Rental losses are passive: they offset passive income freely, and up to $25,000/yr can offset ordinary (W-2) income if you actively participate and your MAGI is under $100k (phasing out to $0 by $150k); unused losses carry forward. On sale, claimed depreciation is recaptured at up to 25%, and gains may owe capital-gains tax (a 1031 exchange can defer both). Figures are a year-1 estimate at your 24.0% rate — not tax advice; consult a CPA.
Schools (NCES district)
- District
- Broward
- NCES district ID
- 1200180
- Math proficiency
- 42% ▼ -18.00%
- Reading proficiency
- 53% ▼ -5.00%
- Median HH income
- $52,139
- Composite
- 40.88/100
- National rank
- #3621
- State rank
- #46 of 73 in FL
Livability — Pembroke Pines
- Score
- 83/100
- State rank
- #54
- US rank
- #933
Category grades
Schools grade is shown separately in the Schools card above.
Census & demographics
- Census place
- Pembroke Pines, FL
- County
- Broward County · 1,963,430 people
- City population
- 180,224
- Metro
- Miami-Fort Lauderdale-Pompano Beach, FL
- Population (ZIP)
- 76,967
- Household income
- $68,743
- Rent vs Own
- Severe rent burden
- 4834.0
Population outlook (Broward County) Hauer SSP2
- Today (2025)
- 2,207,033 people
- By 2030
- 2,360,704 · +7.0%
- By 2040
- 2,661,208 · +20.6%
- By 2050
- 2,946,698 · +33.5%
- By 2075
- 3,602,273 · +63.2%
- By 2100
- 3,970,984 · +79.9%
Race, ethnicity, and origin ACS 2023
- Neighborhood character
- Diverse neighborhood (Simpson 0.64)
- Race & ethnicity
- Black 44% Hispanic / Latino 39% Two or more races 18% White 11% Asian 3%
- Hispanic origin (detail)
- Puerto Rican 4% Cuban 11% Dominican 3% Salvadoran 1%
- Common ancestry
- Hispanic 8% Italian 1%
- Foreign-born
- 38% · Canada, Jamaica, Dominican Republic
- Languages at home
- 54% English-only · Spanish 35% French/Haitian/Cajun 7% Other Indo-European 1%
Political lean MEDSL · Broward
- 2024 margin
- D (+17.0) · D 58.0% · R 41.0%
- 2008→2024 swing
- -17.8pp toward R · 2008: 34.7pp · 2024: 17.0pp
- All cycles
- 2024: D+17.0 2020: D+29.8 2016: D+35.0 2012: D+34.9 2008: D+34.7
Not yet ingested
- Civics
- —
Market trends
- HPI YoY
- ▼ -246.93%
- Current HPI
- 416.2123
- Rent YoY
- ▼ -0.92%
- Metro
- Miami-Fort Lauderdale-Pompano Beach, FL
- State GDP YoY
- ▲ 3.28%
- F500 in state
- 36
Industry mix (Fortune 500 HQ in FL)
| Industry | F500 HQs | Revenue |
|---|---|---|
| Industrial Technology | 2 | $29B |
|
||
| Insurance | 2 | $17B |
|
||
| Retail | 1 | $60B |
|
||
| Technology Distribution | 1 | $58B |
|
||
| Homebuilding | 1 | $35B |
|
||
| Technology Manufacturing | 1 | $35B |
|
||
Price history
+500.6% since first listed5 events — show timeline
- 2026-03-01 Listed $185,000 Beaches MLS
- 2013-06-03 Sold (Public Records) $59,000 Public Records
- 2006-04-26 Sold (Public Records) $135,000 Public Records
- 2002-10-22 Sold (Public Records) $78,900 Public Records
- 1974-12-01 Sold (Public Records) $30,800 Public Records
Property tax history
-4.4%/yrLatest (2025): $769 · +2.0% YoY. Source: county tax records.
Cash-flow waterfall
monthlySold comps — $/sqft
last 12 mo · ≤1 miLoading sold comps…