3450 Howard Rd #188 · Wanakah, NY
Flood risk 1/10 · Minimal
- FEMA flood zone
- X (unshaded)
- Chance of flooding over 30 yrs
- 0.0%
- Est. flood insurance / yr
- $507 – $1,088
Fire risk 1/10 · Minimal
- Est. fire insurance / yr
- $691 – $1,283
Heat risk 2/10 · Minimal
- Hot days now (above 93°F)
- 7 days/yr
- Hot days in 30 yrs
- 15 days/yr
Wind risk 1/10 · Minimal
- Chance of severe wind over 30 yrs
- —
Air-quality risk 4/10 · Minor
- Unhealthy air days now
- 4 days/yr
- Unhealthy air days in 30 yrs
- 9 days/yr
Risk factors via First Street. Map © Google.
Why this score? — see what drove the C+ grade
The composite is a weighted blend of 9 inputs, each scored 0–100. Each bar is that input's sub-score; the figure is the points it added to the 100-point composite (weight × sub-score).
- Cash flow +26.8/30.0
- DSCR +9.2/10.0
- ARV discount +7.5/15.0
- 1% rule +5.9/10.0
- Schools +4.7/10.0
- Rent growth +3.8/5.0
- Livability +3.5/5.0
- Condition / age +2.5/5.0
- Appreciation +0.0/10.0
$160,300
🖨 Deal sheet (PDF) 📄 Offer letter ✓ Due diligence
Listing remarks MLS
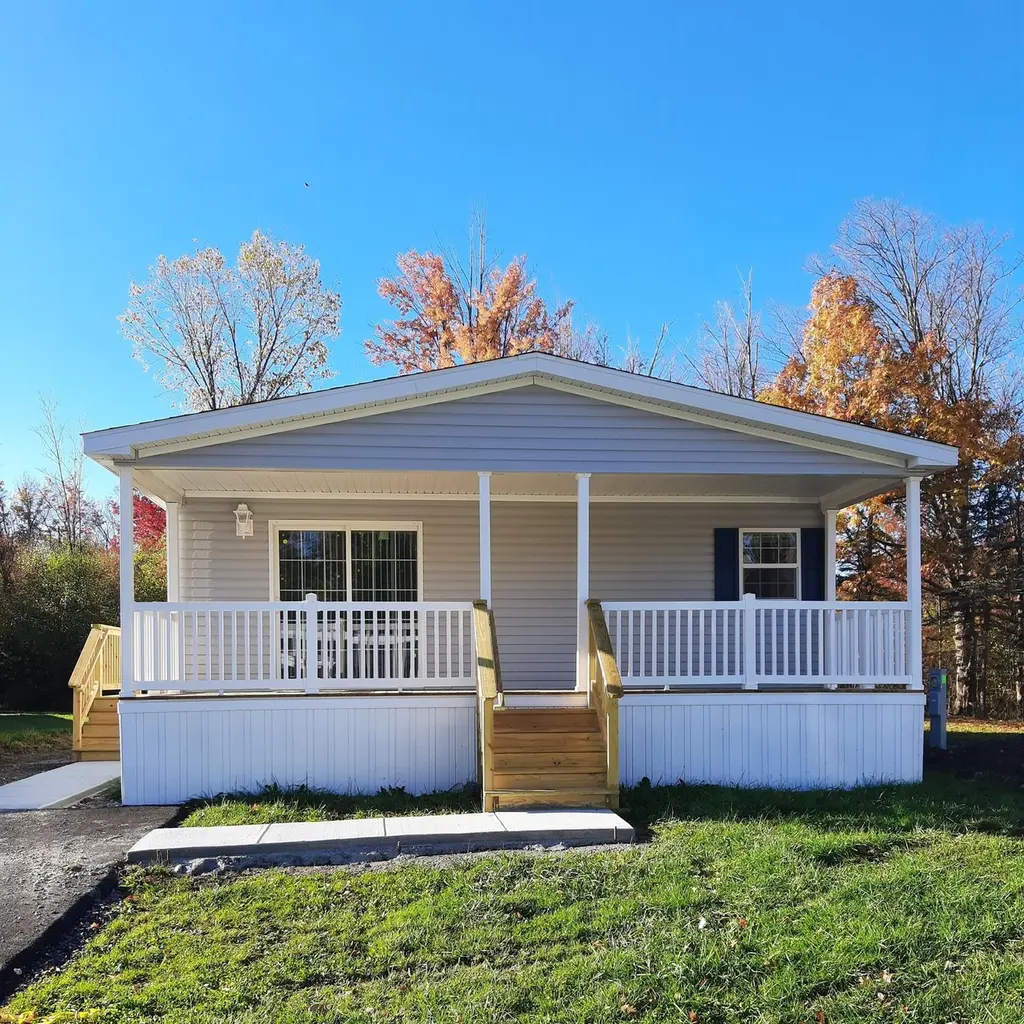
Beautiful front covered porch with sliding glass doors. 3 bedrooms 2 bathroom Coming soon
Key facts
- Front covered porch
- Sliding glass doors
- Built 2025
Tags
Neighborhood map
What this means for you Summary
Snapshot
- This is a 3-bed/2.0-bath land listed at $160k.
Deal economics
- At list price, monthly cash flow is $439 ($5k/yr) — positive.
- The deal already cash-flows at list — no discount required.
- Meets the 1% rule at list price ($2k rent vs $160k).
- Recommended offer: $141k (12.0% below list) — sets the bar for market timing.
- Cap rate 9.6% vs local median 3.1% in Wanakah — top-decile yield for the area; either an underpriced asset or a hidden risk that comps aren't pricing in. Stress-test before assuming the spread holds.
Location & tenants
- Location reads 69/100 on livability (#508 in NY) — a middle-class / working-renter tenant base. Strengths: employment A+, housing A+, crime B+; Watch: amenities F, commute F, health & safety F.
- Frontier Central School District (suburban): math 54% / reading 55% proficiency, ranked #301 of 590 in NY (top 51%) — acceptable for families but not a draw, mixed tenant base, ~2y average lease; only 20% free/reduced lunch — higher-income household profile.
- Market conditions: Rents rising fast (+5.2%/yr); 262 active listings in the ZIP; 2 comparable units currently listed for rent nearby; solid renter incomes; 1,244 units permitted in Erie County in 2024 (563 in 5+ unit buildings).
Forward outlook
- Local home prices are declining (-3.0%/yr); year-one equity from $1k of loan paydown is wiped out by about $5k of value loss. Plan a longer hold.
- At projected returns (-3.0% appreciation + 5.2% rent growth), your $45k cash investment doubles in ~8 years — after that, you're playing with house money.
Negotiation context
- It's been on market 170 days — a 12% lower offer ($141k) is reasonable based on typical stale-listing flexibility.
Questions for the listing agent
- It's been on market 170 days. Have you received any prior offers? Is the seller open to a 12% concession, seller financing, or rate buy-down credit?
- Why hasn't it sold? Are there any deal-killer items the seller is aware of (foundation, flood, title, zoning, code violations)?
- Is there a deadline driving the sale (1031 exchange, divorce, estate, relocation)? That informs how much negotiation room exists.
- What's the average days-on-market for RENTAL listings here right now (not sales)? A rising rental-DOM trend means longer vacancies and softer asking-rent achievability than the comps imply.
- What's the recent tenant-quality profile in this submarket — average credit score on applications, eviction rate, late-payment / NSF rate, and stable-employment percentage? A property-management company in the area should have these aggregated.
- How much new for-sale + rental construction is in the pipeline within 1–3 miles? Heavy new supply typically softens prices + rents 12–24 months out; constrained supply supports both.
Investment metrics
- 1% rule
- 1.09% ✓
- Cap rate
- 9.58%
- Cash-on-cash
- 11.74%
- DSCR
- 1.52
- GRM
- 7.6
CMA / ARV
- ARV (median comp)
- $79,478
- List price
- $160,300
- Delta
- 101.69%
- Verdict
- OVERPRICED
- Comps
- 10 within 1.0 mi
Projected returns pro-forma
-3.0% appreciation · 5.21% rent growth · sell at horizon
- IRR
- 3.3%
- Equity multiple
- 1.13×
- Total profit
- $5,902
- Equity at exit
- $23,901
- IRR
- 14.7%
- Equity multiple
- 2.29×
- Total profit
- $57,945
- Equity at exit
- $13,860
Cash invested: $44,884 (down + closing). Projections, not guarantees.
Landlord ↔ Tenant lean methodology
- Overall (STATE)
- 15 Strongly Tenant-Friendly
- State New York
- 15 Strongly Tenant-Friendly · D+10
- County
- — inherits STATE
- City
- — inherits STATE
ZIP-level market 14075
- Rents YoY
- 5.2%
- Active inventory
- 262
- Price-to-rent
- 7.6×
Monthly cashflow live
- Estimated rent
- $1,751 medium interval (Pro) →
- Mortgage (P&I)
- −$841
- Tax from tax record
- −$37 /mo · $443/yr
- Insurance
- −$67
- HOA
- −$0
- Vacancy / Maint / Mgmt
- −$368
- Net cashflow
- $439
Break-even live
Sensitivity live
| Price | -10% $530 | -5% $485 | +0% $439 | +5% $394 | +10% $348 |
|---|---|---|---|---|---|
| Rent | -10% $301 | -5% $370 | +0% $439 | +5% $508 | +10% $578 |
| Rate | -1.0pp $520 | -0.5pp $480 | base $439 | +0.5pp $398 | +1.0pp $355 |
UW: 25.0% down · 7.5% · 30yr · 1.5% tax · 5.0% vac · 8.0% maint · 8.0% mgmt
Financing live
Cash to close
- Down payment
- $40,075
- Closing costs
- $4,809
- Reserves months
- —
- Total cash needed
- —
Loan-product check · same deal, 3 products live
Conventional
25% down · 7.5% · 30yr
- Down + closing
- —
- Monthly P&I
- —
- Monthly cashflow
- —
- DSCR
- —
- Eligible?
- —
Personal DTI + credit; lowest rate.
DSCR
20% down · 8.5% · 30yr
- Down + closing
- —
- Monthly P&I
- —
- Monthly cashflow
- —
- DSCR
- —
- Eligible?
- —
No personal income docs; deal must DSCR.
Hard money
10% down · 12.0% · 12mo
- Down + closing
- —
- Monthly P&I
- —
- Monthly cashflow
- —
- DSCR
- —
- Eligible?
- —
Short-term bridge; refi at stabilization.
Rent comps 2 comps
| Address | Beds | Baths | Sqft | Rent | $/sqft | DOM | Units | Dist |
|---|---|---|---|---|---|---|---|---|
| 4819 Southwestern Blvd Hamburg, NY | 2.0 | 2.0 | 1170 | $2,055 | $1.76 | 2d | 1 | 0.93mi |
| 4591 Southwestern Blvd Hamburg, NY | 1.0–2.0 | 1.0 | 737 | $1,415 | $1.92 | 2d | 12 | 1.44mi |
Listing history 15 events
-
2026-06-18days on market $160,300 Active 170 DOM
-
2026-06-17days on market $160,300 Active 169 DOM
-
2026-06-16days on market $160,300 Active 168 DOM
-
2026-06-15days on market $160,300 Active 167 DOM
-
2026-06-13days on market $160,300 Active 165 DOM
-
2026-06-10days on market $160,300 Active 162 DOM
-
2026-06-09days on market $160,300 Active 161 DOM
-
2026-06-08days on market $160,300 Active 160 DOM
-
2026-06-07days on market $160,300 Active 159 DOM
-
2026-06-05days on market $160,300 Active 156 DOM
-
2026-06-03days on market $160,300 Active 155 DOM
-
2026-06-02days on market $160,300 Active 154 DOM
-
2026-06-01days on market $160,300 Active 153 DOM
-
2026-05-31days on market $160,300 Active 152 DOM
-
2025-12-30$160,300 Active 89-char remark
Show marketing remark (89 chars)
Beautiful front covered porch with sliding glass doors. 3 bedrooms 2 bathroom Coming soon
ⓘ Source: listings_history table (triggers on properties + properties_extension) + one-shot
backfill from property_details.listing_events for pre-trigger history.
Tax reassessment forecast NY · Partial reset (capped growth)
- Current annual tax
- $443 · $37/mo
- Projected year-2 tax
- $1,576 · $131/mo
- Expected delta
- +$1,133/yr (+$94/mo · 255.4%)
ⓘ Screening estimate from a state-policy table — verify with the county assessor before closing.
Climate risk First Street
- Flood 1/10 Low FEMA zone X (unshaded) · 0% chance over 30 yrs
- Wildfire 1/10 Low
- Heat 2/10 Low 7 d/yr ≥93°F today · 15 d/yr by 30 yrs out
- Wind 1/10 Low
- Air quality 4/10 Moderate 4 unhealthy d/yr today · 9 by 30 yrs out
Nearby sold comps map
Loading sold comps map…
Walkable amenities ~0.75 mi
Loading nearby amenities…
Taxation est. · year 1
- Rental income
- $21,016
- − Mortgage interest
- −$8,979
- − Property taxes
- −$443
- − Insurance
- −$802
- − Repairs & maintenance
- −$1,681
- − Management
- −$1,681
- − Depreciation
- −$4,663
- Taxable income
- $2,766
- Est. tax owed @ 24.0%
- −$664
- After-tax cash flow
- $4,606/yr
For passive investors: Depreciation is non-cash, so a rental often shows a tax loss while cash-flowing — sheltering income. Rental losses are passive: they offset passive income freely, and up to $25,000/yr can offset ordinary (W-2) income if you actively participate and your MAGI is under $100k (phasing out to $0 by $150k); unused losses carry forward. On sale, claimed depreciation is recaptured at up to 25%, and gains may owe capital-gains tax (a 1031 exchange can defer both). Figures are a year-1 estimate at your 24.0% rate — not tax advice; consult a CPA.
Schools (NCES district)
- District
- Frontier Central School District
- NCES district ID
- 3611670
- Math proficiency
- 54% ▼ -16.00%
- Reading proficiency
- 55% ▼ -10.00%
- Median HH income
- $58,807
- Composite
- 47.36/100
- National rank
- #2291
- State rank
- #301 of 590 in NY
Livability — Wanakah
- Score
- 69/100
- State rank
- #508
- US rank
- #8972
Category grades
Schools grade is shown separately in the Schools card above.
Census & demographics
- County
- Erie County · 714,559 people
- Metro
- Buffalo-Cheektowaga, NY
- Population (ZIP)
- 44,520
- Household income
- $83,383
- Rent vs Own
- Severe rent burden
- 824.0
Population outlook (Erie County) Hauer SSP2
- Today (2025)
- 933,037 people
- By 2030
- 935,181 · +0.2%
- By 2040
- 928,531 · -0.5%
- By 2050
- 905,725 · -2.9%
- By 2075
- 834,037 · -10.6%
- By 2100
- 708,033 · -24.1%
Race, ethnicity, and origin ACS 2023
- Neighborhood character
- Predominantly White (92%)
- Race & ethnicity
- White 92% Two or more races 4% Hispanic / Latino 3% Black 1%
- Common ancestry
- Romanian 20% Lithuanian 2% Slovak 2%
- Foreign-born
- 2% · Canada
- Languages at home
- 97% English-only · Spanish 1% Other Indo-European 1%
Political lean MEDSL · Erie
- 2024 margin
- Lean D (+9.7) · D 54.8% · R 45.2%
- 2008→2024 swing
- -7.9pp toward R · 2008: 17.5pp · 2024: 9.7pp
- All cycles
- 2024: D+9.7 2020: D+14.7 2016: D+4.8 2012: D+15.6 2008: D+17.5
Not yet ingested
- Civics
- —
Market trends
- HPI YoY
- ▼ -261.10%
- Current HPI
- 300.2852
- Rent YoY
- ▲ 5.21%
- Metro
- Buffalo-Cheektowaga, NY
- State GDP YoY
- ▲ 2.60%
- F500 in state
- 92
Industry mix (Fortune 500 HQ in NY)
| Industry | F500 HQs | Revenue |
|---|---|---|
| Financial Services | 10 | $950B |
|
||
| Consumer Goods | 9 | $162B |
|
||
| Insurance | 4 | $225B |
|
||
| Telecommunications | 2 | $144B |
|
||
| Pharmaceuticals | 2 | $112B |
|
||
| Media / Entertainment | 2 | $69B |
|
||
Price history
1 event — show timeline
- 2025-12-30 Listed $160,300 Zillow
Property tax history
-6.1%/yrLatest (2021): $443 · +0.0% YoY. Source: county tax records.
Cash-flow waterfall
monthlySold comps — $/sqft
last 12 mo · ≤1 miLoading sold comps…