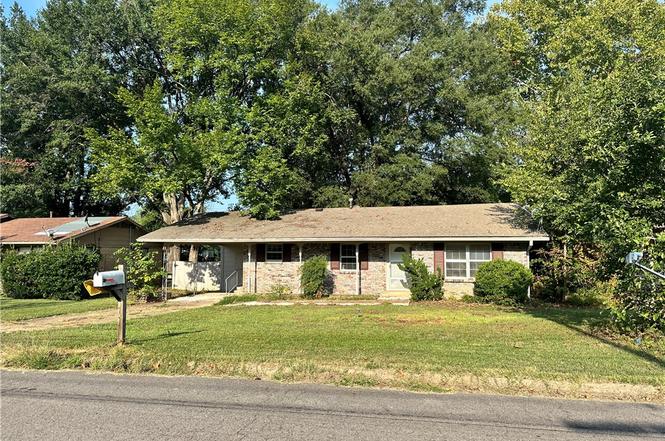
305 N Vancouver Ave · Russellville, AR
Flood risk 1/10 · Minimal
- FEMA flood zone
- X (unshaded)
- Chance of flooding over 30 yrs
- 0.0%
- Est. flood insurance / yr
- $507 – $1,088
Fire risk 4/10 · Minor
- Est. fire insurance / yr
- $1,499 – $2,785
Heat risk 7/10 · Major
- Hot days now (above 112°F)
- 7 days/yr
- Hot days in 30 yrs
- 19 days/yr
Wind risk 2/10 · Minimal
- Chance of severe wind over 30 yrs
- 2.0%
Air-quality risk 1/10 · Minimal
- Unhealthy air days now
- 0 days/yr
- Unhealthy air days in 30 yrs
- 0 days/yr
Risk factors via First Street. Map © Google.
Why this score? — see what drove the D+ grade
The composite is a weighted blend of 9 inputs, each scored 0–100. Each bar is that input's sub-score; the figure is the points it added to the 100-point composite (weight × sub-score).
- ARV discount +14.9/15.0
- Cash flow +13.5/30.0
- DSCR +4.1/10.0
- Rent growth +4.0/5.0
- Livability +3.9/5.0
- Schools +3.8/10.0
- 1% rule +2.9/10.0
- Condition / age +2.5/5.0
- Appreciation +0.0/10.0
$145,000
🖨 Deal sheet (PDF) 📄 Offer letter ✓ Due diligence
Listing remarks
Investors take a look! Huge Price Reduction Selling property As Is, Where Is Welcome to 305 N Vancouver in Russellville — a great opportunity for first-time homebuyers or investors. This 3-bedroom, 2-bathroom home offers a practical layout with a spacious living area, a functional kitchen with plenty of storage, and comfortable bedrooms filled with natural light. The property features a generous backyard, providing space for outdoor activities, gardening, or future improvements. Conveniently located near schools, shopping, and local amenities, this home combines everyday convenience with long-term potential. Whether you are searching for an affordable first home or a property to add
Key facts
- Functional kitchen
- Spacious living area
- Natural light
Tags
Property features AI
Finance
- HOA & community: Monthly association fee (frequency listed); Near hospital, park, and shopping
Exterior
- Parking: Attached carport; 1 covered parking space
- Utilities: Electricity available; Natural gas available; Public water; Sewer available
- Home design: Single-story; Brick construction; Architectural shingle roof; Crawlspace foundation
- Construction: Brick exterior; Architectural shingle roof; Crawlspace foundation
- Exterior features: Concrete driveway; Partial fencing; Storage structure on property; Cleared city lot near a park; Public road frontage
Interior
- Kitchen: Electric range
- Flooring: Laminate flooring
- Bathrooms: 2 full bathrooms
- Heating & cooling: Central heating (gas); Central air conditioning
- Interior features: Fireplace with insert; Crawl space basement
- Laundry & utility: Electric water heater
Neighborhood map
What this means for you Summary
Snapshot
- This is a 3-bed/2.0-bath single-family listed at $145k.
Deal economics
- At list price, monthly cash flow is $6 ($68/yr) — positive.
- The deal already cash-flows at list — no discount required.
- To meet the 1% rule (rent ≥ 1% of price), the offer needs to be $115k (20.8% below list).
- Recommended offer: $115k (20.8% below list) — sets the bar for 1% rule.
- Cap rate 6.3% vs local median 3.5% in Russellville — top-decile yield for the area; either an underpriced asset or a hidden risk that comps aren't pricing in. Stress-test before assuming the spread holds.
Location & tenants
- Location reads 77/100 on livability (#10 in AR, #3,049 nationally) — a middle-class / working-renter tenant base. Strengths: amenities A+, cost of living A+, health & safety A+; Watch: commute F, employment F.
- Russellville School District (town): math 46% / reading 45% proficiency, ranked #38 of 238 in AR (top 16%) — families likely to look elsewhere, expect single-tenant / working-renter base with shorter leases.
- Zoned schools: Dwight Elementary School (math 47% / reading 37%, grade F, #173 of 454 statewide, top 43%, 213 students, 62% FRL); Russellville Middle School (math 49% / reading 46%, grade C-, #42 of 201 statewide, top 22%, 813 students, 53% FRL); Russellville High School (math 28% / reading 43%, grade F, #85 of 292 statewide, top 30%, 1,227 students, 37% FRL) — zoned schools at 51% FRL track the district average.
- Market conditions: Rents rising fast (+6.1%/yr); 94 active listings in the ZIP; 55 units permitted in Pope County in 2024 (0 in 5+ unit buildings).
Forward outlook
- Local home prices are declining (-3.0%/yr); year-one equity from $1k of loan paydown is wiped out by about $4k of value loss. Plan a longer hold.
- Pope County population projected at +9% by 2050 — modest demand growth; plan on rents tracking national, not racing it.
Negotiation context
- It's been on market 161 days — a 12% lower offer ($128k) is reasonable based on typical stale-listing flexibility.
- 5 sale attempts since 8y ago; this cycle's ask has dropped $24k (14%) from the opening price — seller is motivated, your offer sets the floor, not the list.
- Current owner paid $97k; 49% above their basis — modest negotiation headroom, anchor on the comps not their cost.
Risks & watch-outs
- Climate carrying-cost: extreme-heat days projected 7→19/yr by 2055 (HVAC capex compounding) — expect insurance premiums to compound above CPI over the hold.
Questions for the listing agent
- It's been on market 161 days. Have you received any prior offers? Is the seller open to a 21% concession, seller financing, or rate buy-down credit?
- Built in 1972 — when were the roof, HVAC, electrical panel, plumbing, and water heater last replaced?
- Why hasn't it sold? Are there any deal-killer items the seller is aware of (foundation, flood, title, zoning, code violations)?
- Is there a deadline driving the sale (1031 exchange, divorce, estate, relocation)? That informs how much negotiation room exists.
- Schools are B-rated — typically a magnet for longer-tenancy family renters. What's the average tenant stay here, and is there a school-zone premium baked into asking?
- The area grade is low — what's the realistic commute time and amenity access for the typical tenant pool here? Any planned neighborhood developments (good or bad) we should know about?
- What's the average days-on-market for RENTAL listings here right now (not sales)? A rising rental-DOM trend means longer vacancies and softer asking-rent achievability than the comps imply.
- What's the recent tenant-quality profile in this submarket — average credit score on applications, eviction rate, late-payment / NSF rate, and stable-employment percentage? A property-management company in the area should have these aggregated.
- How much new for-sale + rental construction is in the pipeline within 1–3 miles? Heavy new supply typically softens prices + rents 12–24 months out; constrained supply supports both.
Investment metrics
- 1% rule
- 0.79% ✗
- Cap rate
- 6.34%
- Cash-on-cash
- 0.17%
- DSCR
- 1.01
- GRM
- 10.5
CMA / ARV
- ARV (on-the-fly)
- $173,568
- Comps found
- 12
Show comp detail 12 sales within ~0.75 mi
| Address | Dist | Beds/Ba | Sqft | Sold | Price | $/sf | Match |
|---|---|---|---|---|---|---|---|
| 305 N Vancouver Ave | 0.00mi | 3/2.0 | 1,356 (0%) | 0mo | $120,000 | $88 | 100 |
| 211 S Cumberland Ave | 0.38mi | 3/2.0 | 1,280 (-6%) | 3mo | $194,000 | $152 | 70 |
| 2502 W 2nd St | 0.27mi | 3/1.5 | 1,240 (-9%) | 8mo | $165,000 | $133 | 64 |
| 216 S Phoenix Ave | 0.52mi | 3/1.0 | 1,344 (-1%) | 11mo | $85,000 | $63 | 61 |
| 213 S Phoenix | 0.51mi | 3/1.5 | 1,303 (-4%) | 8mo | $148,500 | $114 | 61 |
| 231 S Inglewood Ave | 0.66mi | 3/2.0 | 1,292 (-5%) | 3mo | $165,000 | $128 | 59 |
| 232 S Fairbanks Ave | 0.54mi | 3/2.0 | 1,288 (-5%) | 9mo | $81,000 | $63 | 59 |
| 235 S Galveston | 0.57mi | 2/1.0 (-1) | 1,392 (+3%) | 2mo | $146,000 | $105 | 59 |
| 100 N Fairbanks Ave | 0.48mi | 3/2.0 | 1,512 (+12%) | 2mo | $199,000 | $132 | 57 |
| 413 N Fairbanks Ave | 0.55mi | 3/1.0 | 1,280 (-6%) | 6mo | $163,450 | $128 | 56 |
| 200 S Muskogee | 0.60mi | 3/2.0 | 1,232 (-9%) | 2mo | $173,500 | $141 | 55 |
| 400 N Fairbanks | 0.49mi | 3/2.0 | 1,500 (+11%) | 8mo | $190,000 | $127 | 53 |
Match score weights: distance 35% · size 25% · config 20% · recency 20%. Top-matched comps best support the ARV.
Projected returns pro-forma
-3.0% appreciation · 6.13% rent growth · sell at horizon
- IRR
- -13.0%
- Equity multiple
- 0.52×
- Total profit
- $-19,452
- Equity at exit
- $21,620
- IRR
- -0.1%
- Equity multiple
- 0.99×
- Total profit
- $-339
- Equity at exit
- $12,537
Cash invested: $40,600 (down + closing). Projections, not guarantees.
Landlord ↔ Tenant lean methodology
- Overall (STATE)
- 92 Strongly Landlord-Friendly
- State Arkansas
- 92 Strongly Landlord-Friendly · R+14
- County
- — inherits STATE
- City
- — inherits STATE
ZIP-level market 72801
- Home prices YoY
- -24.5%
- Rents YoY
- 6.1%
- Active inventory
- 94
- Price-to-rent
- 10.5×
Monthly cashflow live
- Estimated rent
- $1,148 medium interval (Pro) →
- Mortgage (P&I)
- −$760
- Tax from tax record
- −$80 /mo · $964/yr
- Insurance
- −$60
- HOA
- −$0
- Lot rent
- −$0
- Vacancy / Maint / Mgmt
- −$241
- Net cashflow
- $6
Break-even live
Sensitivity live
| Price | -10% $88 | -5% $47 | +0% $6 | +5% $-35 | +10% $-76 |
|---|---|---|---|---|---|
| Rent | -10% $-85 | -5% $-40 | +0% $6 | +5% $51 | +10% $96 |
| Rate | -1.0pp $79 | -0.5pp $43 | base $6 | +0.5pp $-32 | +1.0pp $-70 |
UW: 25.0% down · 7.5% · 30yr · 1.5% tax · 5.0% vac · 8.0% maint · 8.0% mgmt
Financing live
Cash to close
- Down payment
- $36,250
- Closing costs
- $4,350
- Reserves months
- —
- Total cash needed
- —
Loan-product check · same deal, 3 products live
Conventional
25% down · 7.5% · 30yr
- Down + closing
- —
- Monthly P&I
- —
- Monthly cashflow
- —
- DSCR
- —
- Eligible?
- —
Personal DTI + credit; lowest rate.
DSCR
20% down · 8.5% · 30yr
- Down + closing
- —
- Monthly P&I
- —
- Monthly cashflow
- —
- DSCR
- —
- Eligible?
- —
No personal income docs; deal must DSCR.
Hard money
10% down · 12.0% · 12mo
- Down + closing
- —
- Monthly P&I
- —
- Monthly cashflow
- —
- DSCR
- —
- Eligible?
- —
Short-term bridge; refi at stabilization.
Listing history 14 events
-
2026-04-30status Pending
-
2026-04-08price $145,000
-
2026-04-08status Active
-
2026-03-19historical
-
2026-03-15status Active
-
2026-02-12status Pending
-
2025-12-26status Active
-
2025-12-15status Pending
-
2025-11-03price $159,000
-
2025-09-18$169,000 Active
-
2018-10-24soldstatus $97,000
-
2018-10-24$97,000
-
2006-06-16soldstatus $81,000
-
2003-04-18soldstatus $55,000
ⓘ Source: listings_history table (triggers on properties + properties_extension) + one-shot
backfill from property_details.listing_events for pre-trigger history.
Tax reassessment forecast AR · Resets to sale price
- Current annual tax
- $964 · $80/mo
- Projected year-2 tax
- $964 · $80/mo
- Expected delta
- $0/yr ($0/mo · 0.0%)
ⓘ Screening estimate from a state-policy table — verify with the county assessor before closing.
Climate risk First Street
- Flood 1/10 Low FEMA zone X (unshaded) · 0% chance over 30 yrs
- Wildfire 4/10 Moderate
- Heat 7/10 Severe 7 d/yr ≥112°F today · 19 d/yr by 30 yrs out
- Wind 2/10 Low 2% chance of damaging wind over 30 yrs
- Air quality 1/10 Low 0 unhealthy d/yr today · 0 by 30 yrs out
Nearby sold comps map
Loading sold comps map…
Walkable amenities ~0.75 mi
Loading nearby amenities…
Taxation est. · year 1
- Rental income
- $13,774
- − Mortgage interest
- −$8,122
- − Property taxes
- −$964
- − Insurance
- −$725
- − Repairs & maintenance
- −$1,102
- − Management
- −$1,102
- − Depreciation
- −$4,218
- Taxable loss
- −$2,459
- Est. tax savings @ 24.0%
- +$590
- After-tax cash flow
- $658/yr
For passive investors: Depreciation is non-cash, so a rental often shows a tax loss while cash-flowing — sheltering income. Rental losses are passive: they offset passive income freely, and up to $25,000/yr can offset ordinary (W-2) income if you actively participate and your MAGI is under $100k (phasing out to $0 by $150k); unused losses carry forward. On sale, claimed depreciation is recaptured at up to 25%, and gains may owe capital-gains tax (a 1031 exchange can defer both). Figures are a year-1 estimate at your 24.0% rate — not tax advice; consult a CPA.
Schools (NCES district)
- District
- Russellville School District
- NCES district ID
- 0512060
- Math proficiency
- 46% ▼ -10.00%
- Reading proficiency
- 45% ▼ -9.00%
- Median HH income
- $38,619
- Composite
- 37.98/100
- National rank
- #4293
- State rank
- #38 of 238 in AR
Livability — Russellville
- Score
- 77/100
- State rank
- #10
- US rank
- #3049
Category grades
Schools grade is shown separately in the Schools card above.
Census & demographics
- Census place
- Russellville, AR
- County
- Pope County · 42,302 people
- City population
- 42,302
- Metro
- Russellville, AR
- Population (ZIP)
- 19,019
- Household income
- $47,830
- Rent vs Own
- Severe rent burden
- 665.0
Population outlook (Pope County) Hauer SSP2
- Today (2025)
- 66,303 people
- By 2030
- 67,635 · +2.0%
- By 2040
- 70,046 · +5.6%
- By 2050
- 72,107 · +8.8%
- By 2075
- 78,042 · +17.7%
- By 2100
- 82,343 · +24.2%
Race, ethnicity, and origin ACS 2023
- Neighborhood character
- Predominantly White (68%)
- Race & ethnicity
- White 68% Hispanic / Latino 18% Two or more races 10% Black 4% Native American 3% Asian 3%
- Hispanic origin (detail)
- Mexican 11%
- Common ancestry
- Slovak 2% Lithuanian 1% Serbian 1%
- Foreign-born
- 10% · Canada, China, Vietnam
- Languages at home
- 84% English-only · Spanish 13% Chinese 1% Vietnamese 1%
Political lean MEDSL · Pope
- 2024 margin
- Solid R (+52.2) · D 22.7% · R 74.9% · Other 2.4%
- 2008→2024 swing
- -8.9pp toward R · 2008: -43.3pp · 2024: -52.2pp
- All cycles
- 2024: R+52.2 2020: R+50.4 2016: R+50.5 2012: R+47.2 2008: R+43.3
Not yet ingested
- Civics
- —
Market trends
- HPI YoY
- ▼ -72.65%
- Current HPI
- 223.7613
- Rent YoY
- ▲ 6.13%
- Metro
- Russellville, AR
- State GDP YoY
- ▲ 3.80%
- F500 in state
- 10
Industry mix (Fortune 500 HQ in AR)
| Industry | F500 HQs | Revenue |
|---|---|---|
| Retail | 1 | $681B |
|
||
| Food / Agriculture | 1 | $53B |
|
||
| Retail / Energy | 1 | $22B |
|
||
| Transportation / Logistics | 1 | $12B |
|
||
| Energy | 1 | $4B |
|
||
Price history
+163.6% since first listed14 events — show timeline
- 2026-04-30 Pending — NWARMLS
- 2026-04-08 Price Changed $145,000 NWARMLS
- 2026-04-08 Relisted — NWARMLS
- 2026-03-19 Delisted — NWARMLS
- 2026-03-15 Relisted — NWARMLS
- 2026-02-12 Pending — NWARMLS
- 2025-12-26 Relisted — NWARMLS
- 2025-12-15 Pending — NWARMLS
- 2025-11-03 Price Changed $159,000 NWARMLS
- 2025-09-18 Listed $169,000 NWARMLS
- 2018-10-24 Listed $97,000 NWARMLS
- 2018-10-24 Sold (MLS) $97,000 NWARMLS
- 2006-06-16 Sold (Public Records) $81,000 Public Records
- 2003-04-18 Sold (Public Records) $55,000 Public Records
Property tax history
+6.5%/yrLatest (2025): $964 · +0.0% YoY. Source: county tax records.
Cash-flow waterfall
monthlySold comps — $/sqft
last 12 mo · ≤1 miLoading sold comps…