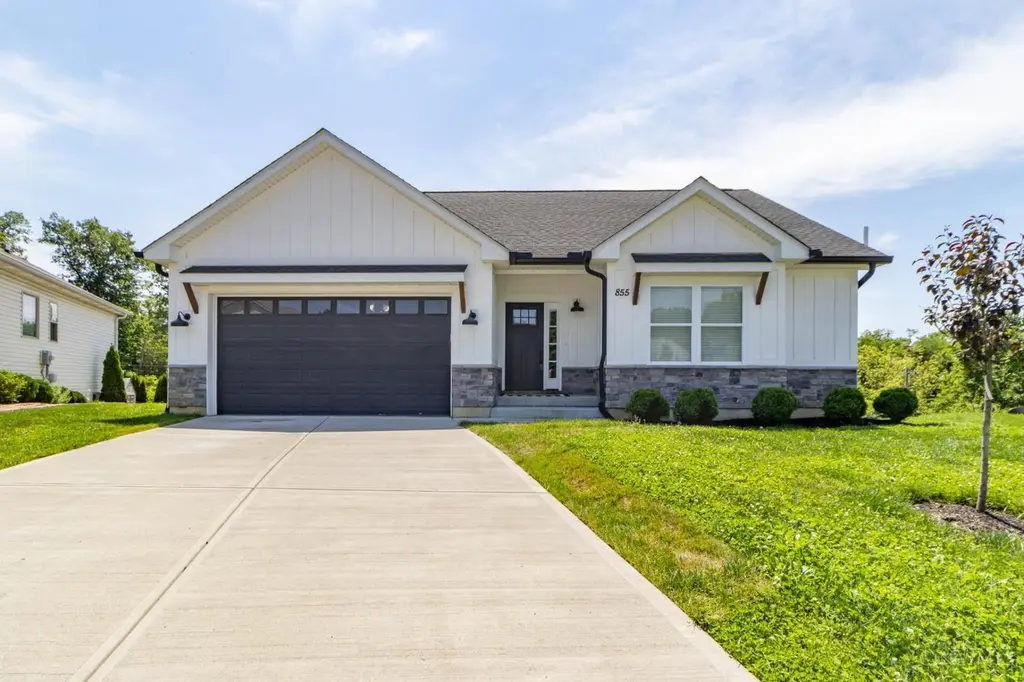
855 Sunrise Ridge Ct · South Lebanon, OH
Flood risk 1/10 · Minimal
- FEMA flood zone
- X (unshaded)
- Chance of flooding over 30 yrs
- 0.0%
- Est. flood insurance / yr
- $507 – $1,088
Fire risk 1/10 · Minimal
- Est. fire insurance / yr
- $713 – $1,323
Heat risk 4/10 · Minor
- Hot days now (above 102°F)
- 7 days/yr
- Hot days in 30 yrs
- 19 days/yr
Wind risk 2/10 · Minimal
- Chance of severe wind over 30 yrs
- 1.0%
Air-quality risk 4/10 · Minor
- Unhealthy air days now
- 4 days/yr
- Unhealthy air days in 30 yrs
- 6 days/yr
Risk factors via First Street. Map © Google.
Why this score? — see what drove the F grade
The composite is a weighted blend of 9 inputs, each scored 0–100. Each bar is that input's sub-score; the figure is the points it added to the 100-point composite (weight × sub-score).
- Appreciation +10.0/10.0
- Schools +6.1/10.0
- Cash flow +5.5/30.0
- Rent growth +4.4/5.0
- Livability +3.7/5.0
- Condition / age +2.5/5.0
- ARV discount +1.4/15.0
- 1% rule +0.8/10.0
- DSCR +0.0/10.0
$500,000
🖨 Deal sheet (PDF) 📄 Offer letter ✓ Due diligence
Listing remarks MLS
Modern farmhouse ranch at the end of a quiet cul-de-sac! just two years old, offering a perfect blend of contemporary style and comfortable open living space. Step inside to find 2774 square feet of thoughtfully designed living space, with an open layout that seamlessly connects the kitchen, great room, and outdoor deck. The kitchen features white wood cabinets, granite countertops, a pantry, island, and stainless steel appliances perfect setup for entertaining and gathering with loved ones. The primary suite boasts an adjoining bath and walk-in closet, while two more bedrooms and 1.5 baths on the main floor provide space for guests and family. A conveniently located laundry room adds practicality.
Key facts
- 8,708 sq ft lot
- 2 garage spots
- Built 2021
Property features AI
Finance
- Other: Zoned residential; Lot size approximately 0.20 acres (less than 0.5 acre)
- HOA & community: Homeowners association with annual fee of $275; HOA dues include association dues and community landscaping
Exterior
- Parking: Attached front-entry garage with 2 garage spaces; Driveway parking; On-street parking
- Security: Garage door opener
- Utilities: Public water; Public sewer; Natural gas; Gas water heating
- Home design: Ranch-style single family home; One level with lower level (walkout basement)
- Construction: Stone and vinyl siding exterior; Shingle roof; Poured foundation; Built as a single-family dwelling; Levels: One
- Exterior features: Located on a cul-de-sac; Deck; Electric fireplace; Garage door opener; Radon system
Interior
- Kitchen: Pantry; Eat-in kitchen with island; Vinyl flooring; Wood cabinets; Marble/granite/stone countertops
- Bedrooms: Primary bedroom on level 1 (15 x 13); Bedroom 2 on level 1 (14 x 10); Bedroom 3 on lower level (12 x 10); Bedroom 4 on lower level (11 x 11)
- Flooring: Vinyl flooring in kitchen and foyer; Wall-to-wall carpet in finished basement
- Bathrooms: Three full bathrooms; One half bathroom; Primary bathroom includes a shower
- Appliances: Dishwasher; Garbage disposal; Oven/Range
- Heating & cooling: Forced air gas heating (high-efficiency gas furnace); Central air conditioning (ENERGY STAR)
- Interior features: 9-foot (or higher) ceilings; Crown molding; Multi-panel doors; Open foyer with vinyl flooring; Finished walkout basement with wall-to-wall carpet and finished space; Recessed lighting; 220 volt outlet
- Laundry & utility: Main-level laundry room (10 x 4)
Neighborhood map
What this means for you Summary
Snapshot
- This is a 5-bed/4.5-bath single-family listed at $500k.
Deal economics
- At list price, monthly cash flow is $-1k ($-13k/yr) — negative.
- To cash-flow at today's rent, offer at most $311k (37.8% below list).
- To meet the 1% rule (rent ≥ 1% of price), the offer needs to be $289k (42.1% below list).
- Recommended offer: $289k (42.1% below list) — sets the bar for 1% rule.
Location & tenants
- Location reads 74/100 on livability (#279 in OH, #4,589 nationally) — a middle-class / working-renter tenant base. Strengths: crime A+, employment A+, cost of living A+; Watch: amenities F, commute F, health & safety F.
- Little Miami Local (rural): math 67% / reading 70% proficiency, ranked #140 of 656 in OH (top 21%) — acceptable for families but not a draw, mixed tenant base, ~2y average lease; only 17% free/reduced lunch — higher-income household profile.
- Zoned schools: Little Miami Primary School (math 76% / reading 65%, grade A-, #376 of 1,584 statewide, top 24%, 855 students, 18% FRL); Little Miami Middle School (math 67% / reading 72%, grade A, #143 of 654 statewide, top 23%, 1,279 students, 16% FRL); Little Miami High School (math 52% / reading 81%, grade B, #150 of 781 statewide, top 20%, 1,445 students, 14% FRL) — zoned schools at 16% FRL track the district average.
- Market conditions: Rents rising fast (+7.4%/yr); 130 active listings in the ZIP; solid renter incomes; 1,224 units permitted in Warren County in 2024 (474 in 5+ unit buildings).
- This rent runs 32% of the median local income ($109k/yr) — at the standard rent-burdened threshold; future hikes will face affordability resistance.
Forward outlook
- In year one you build about $53k of equity ($3k loan paydown + $50k appreciation (10.0% local appreciation)).
- Warren County population projected at +16% by 2050 — long-run rental-demand tailwind backs the buy-and-hold thesis.
- By year 2, paydown + projected appreciation supports a ~$86k cash-out refi (75% LTV) — recoverable capital for the next deal without selling this one.
Negotiation context
- It's been on market 23 days — a 2% lower offer ($492k) is reasonable based on typical stale-listing flexibility.
- 5 sale attempts since 5y ago with the ask held roughly flat each time — persistent listings suggest the price (not the market) is what's stuck; bring a comps-based counter.
Questions for the listing agent
- What do current leases actually rent for vs. the listed asking? Can we see a recent rent roll and the last 12 months of T-12 income?
- What does the HOA fee cover, when was the last increase, and are there any pending special assessments or reserve-fund shortfalls?
- Is there a deadline driving the sale (1031 exchange, divorce, estate, relocation)? That informs how much negotiation room exists.
- Schools are F-rated, which usually means shorter tenancies and higher turnover. Who's the typical renter profile here, and what's been the actual vacancy rate?
- The area grade is low — what's the realistic commute time and amenity access for the typical tenant pool here? Any planned neighborhood developments (good or bad) we should know about?
- What's the average days-on-market for RENTAL listings here right now (not sales)? A rising rental-DOM trend means longer vacancies and softer asking-rent achievability than the comps imply.
- What's the recent tenant-quality profile in this submarket — average credit score on applications, eviction rate, late-payment / NSF rate, and stable-employment percentage? A property-management company in the area should have these aggregated.
- How much new for-sale + rental construction is in the pipeline within 1–3 miles? Heavy new supply typically softens prices + rents 12–24 months out; constrained supply supports both.
Investment metrics
- 1% rule
- 0.58% ✗
- Cap rate
- 3.72%
- Cash-on-cash
- -9.17%
- DSCR
- 0.59
- GRM
- 14.4
CMA / ARV
- ARV (on-the-fly)
- $440,496
- Comps found
- 12
Show comp detail 12 sales within ~0.75 mi
| Address | Dist | Beds/Ba | Sqft | Sold | Price | $/sf | Match |
|---|---|---|---|---|---|---|---|
| 1742 Amberwood Way | 0.33mi | 4/3.5 (-1) | 2,632 (+2%) | 8mo | $460,000 | $175 | 65 |
| 398 Wyndham Dr | 0.53mi | 4/3.5 (-1) | 2,480 (-4%) | 4mo | $410,000 | $165 | 57 |
| 6804 Mossy Rock Ct | 0.43mi | 4/2.5 (-1) | 2,375 (-8%) | 2mo | $415,000 | $175 | 52 |
| 1430 Tecumseh Dr | 0.50mi | 4/2.5 (-1) | 2,776 (+8%) | 2mo | $552,000 | $199 | 49 |
| 1068 Beacon Way Ct | 0.29mi | 4/2.5 (-1) | 2,200 (-15%) | 2mo | $415,000 | $189 | 47 |
| 1790 Amberwood Way | 0.41mi | 4/3.0 (-1) | 2,916 (+13%) | 2mo | $565,000 | $194 | 46 |
| 7336 Welbeck Dr | 0.72mi | 4/3.0 (-1) | 2,732 (+6%) | 4mo | $427,000 | $156 | 42 |
| 601 Eagles Nest Ct | 0.42mi | 4/2.5 (-1) | 2,876 (+12%) | 7mo | $365,000 | $127 | 42 |
| 7182 Wethersfield Dr | 0.73mi | 4/2.5 (-1) | 2,490 (-3%) | 7mo | $425,000 | $171 | 41 |
| 959 Weeping Willow Ln | 0.67mi | 4/2.5 (-1) | 2,305 (-10%) | 4mo | $352,000 | $153 | 35 |
| 227 Wyndham Dr | 0.71mi | 4/3.5 (-1) | 2,830 (+10%) | 9mo | $438,500 | $155 | 34 |
| 268 Delaware Dr | 0.69mi | 4/3.5 (-1) | 2,928 (+14%) | 8mo | $409,900 | $140 | 29 |
Match score weights: distance 35% · size 25% · config 20% · recency 20%. Top-matched comps best support the ARV.
Projected returns pro-forma
10.0% appreciation · 7.42% rent growth · sell at horizon
- IRR
- 18.9%
- Equity multiple
- 2.55×
- Total profit
- $217,565
- Equity at exit
- $450,440
- IRR
- 18.3%
- Equity multiple
- 6.19×
- Total profit
- $726,825
- Equity at exit
- $971,390
Cash invested: $140,000 (down + closing). Projections, not guarantees.
Landlord ↔ Tenant lean methodology
- Overall (STATE)
- 73 Landlord-Friendly
- State Ohio
- 73 Landlord-Friendly · R+6
- County
- — inherits STATE
- City
- — inherits STATE
ZIP-level market 45039
- Home prices YoY
- 7.3%
- Rents YoY
- 7.4%
- Active inventory
- 130
- Price-to-rent
- 14.4×
Monthly cashflow live
- Estimated rent
- $2,894 medium interval (Pro) →
- Mortgage (P&I)
- −$2,622
- Tax from tax record
- −$503 /mo · $6,036/yr
- Insurance
- −$208
- HOA
- −$23
- Vacancy / Maint / Mgmt
- −$608
- Net cashflow
- $-1,070
Break-even live
Sensitivity live
| Price | -10% $-787 | -5% $-929 | +0% $-1,070 | +5% $-1,212 | +10% $-1,353 |
|---|---|---|---|---|---|
| Rent | -10% $-1,299 | -5% $-1,185 | +0% $-1,070 | +5% $-956 | +10% $-842 |
| Rate | -1.0pp $-819 | -0.5pp $-943 | base $-1,070 | +0.5pp $-1,200 | +1.0pp $-1,332 |
UW: 25.0% down · 7.5% · 30yr · 1.5% tax · 5.0% vac · 8.0% maint · 8.0% mgmt
Financing live
Cash to close
- Down payment
- $125,000
- Closing costs
- $15,000
- Reserves months
- —
- Total cash needed
- —
Loan-product check · same deal, 3 products live
Conventional
25% down · 7.5% · 30yr
- Down + closing
- —
- Monthly P&I
- —
- Monthly cashflow
- —
- DSCR
- —
- Eligible?
- —
Personal DTI + credit; lowest rate.
DSCR
20% down · 8.5% · 30yr
- Down + closing
- —
- Monthly P&I
- —
- Monthly cashflow
- —
- DSCR
- —
- Eligible?
- —
No personal income docs; deal must DSCR.
Hard money
10% down · 12.0% · 12mo
- Down + closing
- —
- Monthly P&I
- —
- Monthly cashflow
- —
- DSCR
- —
- Eligible?
- —
Short-term bridge; refi at stabilization.
HOA detail
- Monthly dues
- $23 · $276/yr
Listing history 13 events
-
2026-06-21days on market $500,000 Active 23 DOM
-
2026-06-18days on market $500,000 Active 20 DOM
-
2026-06-17days on market $500,000 Active 19 DOM
-
2026-06-16days on market $500,000 Active 18 DOM
-
2026-06-15days on market $500,000 Active 17 DOM
-
2026-06-13days on market $500,000 Active 15 DOM
-
2026-06-09days on market $500,000 Active 11 DOM
-
2026-06-08days on market $500,000 Active 10 DOM
-
2026-06-07days on market $500,000 Active 9 DOM
-
2026-06-03days on market $500,000 Active 5 DOM
-
2026-06-02days on market $500,000 Active 4 DOM
-
2026-06-01days on market $500,000 Active 3 DOM
-
2026-05-31days on market $500,000 Active 2 DOM
ⓘ Source: listings_history table (triggers on properties + properties_extension) + one-shot
backfill from property_details.listing_events for pre-trigger history.
Tax reassessment forecast OH · Partial reset (capped growth)
- Current annual tax
- $6,036 · $503/mo
- Projected year-2 tax
- $6,918 · $576/mo
- Expected delta
- +$882/yr (+$74/mo · 14.6%)
ⓘ Screening estimate from a state-policy table — verify with the county assessor before closing.
Climate risk First Street
- Flood 1/10 Low FEMA zone X (unshaded) · 0% chance over 30 yrs
- Wildfire 1/10 Low
- Heat 4/10 Moderate 7 d/yr ≥102°F today · 19 d/yr by 30 yrs out
- Wind 2/10 Low 100% chance of damaging wind over 30 yrs
- Air quality 4/10 Moderate 4 unhealthy d/yr today · 6 by 30 yrs out
Nearby sold comps map
Loading sold comps map…
Walkable amenities ~0.75 mi
Loading nearby amenities…
Taxation est. · year 1
- Rental income
- $34,724
- − Mortgage interest
- −$28,008
- − Property taxes
- −$6,036
- − Insurance
- −$2,500
- − Repairs & maintenance
- −$2,778
- − Management
- −$2,778
- − HOA
- −$276
- − Depreciation
- −$14,545
- Taxable loss
- −$22,197
- Est. tax savings @ 24.0%
- +$5,327
- After-tax cash flow
- $-7,517/yr
For passive investors: Depreciation is non-cash, so a rental often shows a tax loss while cash-flowing — sheltering income. Rental losses are passive: they offset passive income freely, and up to $25,000/yr can offset ordinary (W-2) income if you actively participate and your MAGI is under $100k (phasing out to $0 by $150k); unused losses carry forward. On sale, claimed depreciation is recaptured at up to 25%, and gains may owe capital-gains tax (a 1031 exchange can defer both). Figures are a year-1 estimate at your 24.0% rate — not tax advice; consult a CPA.
Schools (NCES district)
- District
- Little Miami Local
- NCES district ID
- 3905044
- Math proficiency
- 67% ▼ -11.00%
- Reading proficiency
- 70% ▼ -6.00%
- Median HH income
- $74,949
- Composite
- 60.5/100
- National rank
- #844
- State rank
- #140 of 656 in OH
Livability — South Lebanon
- Score
- 74/100
- State rank
- #279
- US rank
- #4589
Category grades
Schools grade is shown separately in the Schools card above.
Census & demographics
- County
- Warren County · 196,906 people
- City population
- 7,053
- Metro
- Cincinnati, OH-KY-IN
- Population (ZIP)
- 28,335
- Household income
- $108,794
- Rent vs Own
- Severe rent burden
- 307.0
Population outlook (Warren County) Hauer SSP2
- Today (2025)
- 248,603 people
- By 2030
- 259,345 · +4.3%
- By 2040
- 277,666 · +11.7%
- By 2050
- 289,599 · +16.5%
- By 2075
- 311,681 · +25.4%
- By 2100
- 302,738 · +21.8%
Race, ethnicity, and origin ACS 2023
- Neighborhood character
- Predominantly White (88%)
- Race & ethnicity
- White 88% Hispanic / Latino 5% Two or more races 5% Asian 3% Black 2%
- Common ancestry
- Romanian 2% Scotch-Irish 2% Lithuanian 2%
- Foreign-born
- 8% · Canada, Jamaica
- Languages at home
- 92% English-only · Spanish 3% Russian/Polish/Slavic 2% Other Indo-European 1%
Political lean MEDSL · Warren
- 2024 margin
- Solid R (+31.5) · D 33.8% · R 65.3%
- 2008→2024 swing
- +4.5pp toward D · 2008: -36.1pp · 2024: -31.5pp
- All cycles
- 2024: R+31.5 2020: R+30.8 2016: R+37.6 2012: R+39.5 2008: R+36.1
Not yet ingested
- Civics
- —
Market trends
- HPI YoY
- ▲ 38.63%
- Current HPI
- 568.09
- Rent YoY
- ▲ 7.42%
- Metro
- Cincinnati, OH-KY-IN
- State GDP YoY
- ▲ 1.98%
- F500 in state
- 48
Industry mix (Fortune 500 HQ in OH)
| Industry | F500 HQs | Revenue |
|---|---|---|
| Insurance | 3 | $145B |
|
||
| Industrial Machinery | 3 | $49B |
|
||
| Financial Services | 3 | $24B |
|
||
| Consumer Goods | 2 | $93B |
|
||
| Aerospace / Defense | 2 | $47B |
|
||
| Utilities | 2 | $33B |
|
||
Price history
+900.0% since first listed15 events — show timeline
- 2026-05-30 Listed $500,000 Cincy MLS
- 2024-07-16 Sold (Public Records) $445,000 Public Records
- 2024-07-10 Sold (MLS) $445,000 Cincy MLS
- 2024-05-22 Contingent — Cincy MLS
- 2024-05-17 Listed $445,000 Cincy MLS
- 2023-01-05 Listing Removed — Cincy MLS
- 2023-01-05 Price Changed $468,000 Cincy MLS
- 2022-11-29 Price Changed $450,000 Cincy MLS
- 2022-11-07 Listed $468,000 Cincy MLS
- 2022-08-31 Listing Removed — Cincy MLS
- 2022-04-27 Listed $499,900 Cincy MLS
- 2021-10-18 Sold (MLS) $25,000 Cincy MLS
- 2021-09-25 Contingent — Cincy MLS
- 2021-08-17 Listed $30,000 Cincy MLS
- 2011-11-22 Sold (Public Records) $50,000 Public Records
Property tax history
+21.9%/yrLatest (2025): $6,036 · -2.6% YoY. Source: county tax records.
Cash-flow waterfall
monthlySold comps — $/sqft
last 12 mo · ≤1 miLoading sold comps…