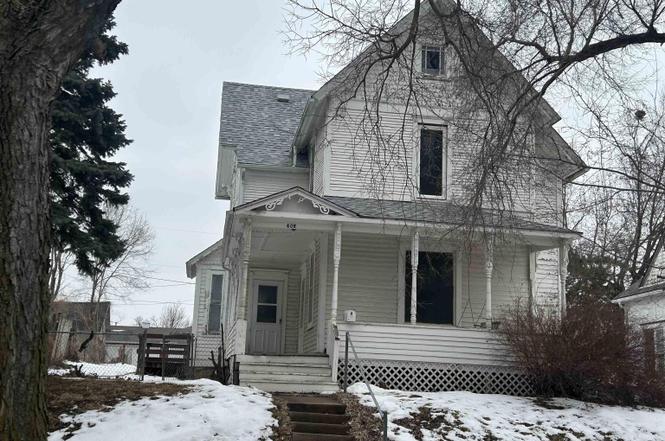
406 N 1st Ave · Marshalltown, IA
Flood risk 1/10 · Minimal
- FEMA flood zone
- X (unshaded)
- Chance of flooding over 30 yrs
- 0.0%
- Est. flood insurance / yr
- $473 – $860
Fire risk 4/10 · Minor
- Est. fire insurance / yr
- $902 – $1,676
Heat risk 3/10 · Minor
- Hot days now (above 102°F)
- 7 days/yr
- Hot days in 30 yrs
- 15 days/yr
Wind risk 2/10 · Minimal
- Chance of severe wind over 30 yrs
- —
Air-quality risk 1/10 · Minimal
- Unhealthy air days now
- 0 days/yr
- Unhealthy air days in 30 yrs
- 0 days/yr
Risk factors via First Street. Map © Google.
Why this score? — see what drove the B+ grade
The composite is a weighted blend of 9 inputs, each scored 0–100. Each bar is that input's sub-score; the figure is the points it added to the 100-point composite (weight × sub-score).
- Cash flow +30.0/30.0
- ARV discount +15.0/15.0
- 1% rule +10.0/10.0
- DSCR +10.0/10.0
- Schools +4.3/10.0
- Livability +3.9/5.0
- Rent growth +2.5/5.0
- Condition / age +2.5/5.0
- Appreciation +0.0/10.0
$79,900
🖨 Deal sheet (PDF) 📄 Offer letter ✓ Due diligence
Listing remarks
Affordable 4 bedroom home with tons of room!! Main floor bedroom and 3 upstairs. Newer flooring. Nice wood staircase plus a back staircase. Newer flooring. Newer shingles. Spacious open floor plan. Detached double garage. Seller is selling property as is.
Key facts
- Newer shingles
- Wood staircase
- Main floor bedroom
Tags
Neighborhood map
What this means for you Summary
Snapshot
- This is a 4-bed/1.0-bath single-family listed at $80k.
Deal economics
- At list price, monthly cash flow is $539 ($6k/yr) — positive.
- The deal already cash-flows at list — no discount required.
- Meets the 1% rule at list price ($1k rent vs $80k).
- Recommended offer: $79k (1.5% below list) — sets the bar for market timing.
- Cap rate 14.4% vs local median 4.5% in Marshalltown — top-decile yield for the area; either an underpriced asset or a hidden risk that comps aren't pricing in. Stress-test before assuming the spread holds.
Location & tenants
- Location reads 78/100 on livability (#133 in IA, #2,464 nationally) — a middle-class / working-renter tenant base. Strengths: commute A+, cost of living A+, housing A+; Watch: employment C-, amenities F.
- Marshalltown Community School District (town): math 50% / reading 52% proficiency, ranked #278 of 289 in IA (top 96%) — acceptable for families but not a draw, mixed tenant base, ~2y average lease; 60% free/reduced lunch — lower-income household profile, screen leases tightly.
- Market conditions: 161 active listings in the ZIP; 1 comparable units currently listed for rent nearby; 35 units permitted in Marshall County in 2024 (0 in 5+ unit buildings).
Forward outlook
- Local home prices are declining (-3.0%/yr); year-one equity from $552 of loan paydown is wiped out by about $2k of value loss. Plan a longer hold.
- Marshall County population projected at +8% by 2050 — modest demand growth; plan on rents tracking national, not racing it.
- At projected returns (-3.0% appreciation + 3.0% rent growth), your $22k cash investment doubles in ~5 years — after that, you're playing with house money.
Negotiation context
- It's been on market 17 days — a 2% lower offer ($79k) is reasonable based on typical stale-listing flexibility.
- 2 sale attempts since 3y ago with the ask held roughly flat each time — persistent listings suggest the price (not the market) is what's stuck; bring a comps-based counter.
Risks & watch-outs
- Watch-outs: built in 1900 — expect roof / HVAC / electrical / plumbing capex.
Questions for the listing agent
- Built in 1900 — when were the roof, HVAC, electrical panel, plumbing, and water heater last replaced?
- Is there a deadline driving the sale (1031 exchange, divorce, estate, relocation)? That informs how much negotiation room exists.
- What's the average days-on-market for RENTAL listings here right now (not sales)? A rising rental-DOM trend means longer vacancies and softer asking-rent achievability than the comps imply.
- What's the recent tenant-quality profile in this submarket — average credit score on applications, eviction rate, late-payment / NSF rate, and stable-employment percentage? A property-management company in the area should have these aggregated.
- How much new for-sale + rental construction is in the pipeline within 1–3 miles? Heavy new supply typically softens prices + rents 12–24 months out; constrained supply supports both.
Investment metrics
- 1% rule
- 1.70% ✓
- Cap rate
- 14.38%
- Cash-on-cash
- 28.89%
- DSCR
- 2.29
- GRM
- 4.9
CMA / ARV
- ARV (on-the-fly)
- $156,996
- Comps found
- 12
Show comp detail 12 sales within ~0.75 mi
| Address | Dist | Beds/Ba | Sqft | Sold | Price | $/sf | Match |
|---|---|---|---|---|---|---|---|
| 406 N 1st Ave | 0.00mi | 4/1.0 | 1,764 (0%) | 0mo | $76,000 | $43 | 100 |
| 208 N Center St | 0.16mi | 4/2.0 | 1,799 (+2%) | 6mo | $129,000 | $72 | 80 |
| 411 Park St | 0.48mi | 4/2.0 | 1,880 (+7%) | 1mo | $193,900 | $103 | 62 |
| 208 1/2 N 3rd Ave | 0.24mi | 4/1.5 | 1,560 (-12%) | 9mo | $85,000 | $54 | 60 |
| 9 S 4th St | 0.62mi | 4/1.5 | 1,680 (-5%) | 4mo | $133,000 | $79 | 58 |
| 511 Woodbury St | 0.45mi | 5/2.0 (+1) | 1,724 (-2%) | 11mo | $153,500 | $89 | 58 |
| 305 N 2nd St | 0.24mi | 4/2.0 | 1,520 (-14%) | 6mo | $159,900 | $105 | 56 |
| 209 N 5th Ave | 0.40mi | 3/1.0 (-1) | 1,614 (-8%) | 8mo | $124,900 | $77 | 56 |
| 603 Jerome St | 0.56mi | 3/2.5 (-1) | 1,750 (-1%) | 12mo | $180,000 | $103 | 52 |
| 309 W State St | 0.47mi | 3/2.0 (-1) | 1,570 (-11%) | 2mo | $160,000 | $102 | 49 |
| 608 W State St | 0.66mi | 4/2.5 | 1,906 (+8%) | 10mo | $240,000 | $126 | 41 |
| 618 Fremont St | 0.67mi | 4/2.0 | 1,600 (-9%) | 17mo | $72,000 | $45 | 35 |
Match score weights: distance 35% · size 25% · config 20% · recency 20%. Top-matched comps best support the ARV.
Projected returns pro-forma
-3.0% appreciation · 3.0% rent growth · sell at horizon
- IRR
- 23.2%
- Equity multiple
- 1.96×
- Total profit
- $21,366
- Equity at exit
- $11,913
- IRR
- 31.2%
- Equity multiple
- 3.81×
- Total profit
- $62,811
- Equity at exit
- $6,908
Cash invested: $22,372 (down + closing). Projections, not guarantees.
Landlord ↔ Tenant lean methodology
- Overall (STATE)
- 83 Strongly Landlord-Friendly
- State Iowa
- 83 Strongly Landlord-Friendly · R+6
- County
- — inherits STATE
- City
- — inherits STATE
ZIP-level market 50158
- Active inventory
- 161
- Price-to-rent
- 4.9×
Monthly cashflow live
- Estimated rent
- $1,355 medium interval (Pro) →
- Mortgage (P&I)
- −$419
- Tax from tax record
- −$80 /mo · $954/yr
- Insurance
- −$33
- HOA
- −$0
- Vacancy / Maint / Mgmt
- −$285
- Net cashflow
- $539
Break-even live
Sensitivity live
| Price | -10% $584 | -5% $561 | +0% $539 | +5% $516 | +10% $493 |
|---|---|---|---|---|---|
| Rent | -10% $432 | -5% $485 | +0% $539 | +5% $592 | +10% $646 |
| Rate | -1.0pp $579 | -0.5pp $559 | base $539 | +0.5pp $518 | +1.0pp $497 |
UW: 25.0% down · 7.5% · 30yr · 1.5% tax · 5.0% vac · 8.0% maint · 8.0% mgmt
Financing live
Cash to close
- Down payment
- $19,975
- Closing costs
- $2,397
- Reserves months
- —
- Total cash needed
- —
Loan-product check · same deal, 3 products live
Conventional
25% down · 7.5% · 30yr
- Down + closing
- —
- Monthly P&I
- —
- Monthly cashflow
- —
- DSCR
- —
- Eligible?
- —
Personal DTI + credit; lowest rate.
DSCR
20% down · 8.5% · 30yr
- Down + closing
- —
- Monthly P&I
- —
- Monthly cashflow
- —
- DSCR
- —
- Eligible?
- —
No personal income docs; deal must DSCR.
Hard money
10% down · 12.0% · 12mo
- Down + closing
- —
- Monthly P&I
- —
- Monthly cashflow
- —
- DSCR
- —
- Eligible?
- —
Short-term bridge; refi at stabilization.
Rent comps 1 comps
| Address | Beds | Baths | Sqft | Rent | $/sqft | DOM | Units | Dist |
|---|---|---|---|---|---|---|---|---|
| 511 W State St Unit 3 Marshalltown, IA | 4.0 | 2.0 | 1580 | $1,150 | $0.73 | 44d | 1 | 0.58mi |
Listing history 3 events
-
2026-03-20status Pending
-
2026-03-03$79,900 Active
-
2023-03-24$64,900 Active
ⓘ Source: listings_history table (triggers on properties + properties_extension) + one-shot
backfill from property_details.listing_events for pre-trigger history.
Tax reassessment forecast IA · Partial reset (capped growth)
- Current annual tax
- $954 · $80/mo
- Projected year-2 tax
- $1,104 · $92/mo
- Expected delta
- +$150/yr (+$13/mo · 15.7%)
ⓘ Screening estimate from a state-policy table — verify with the county assessor before closing.
Climate risk First Street
- Flood 1/10 Low FEMA zone X (unshaded) · 0% chance over 30 yrs
- Wildfire 4/10 Moderate
- Heat 3/10 Moderate 7 d/yr ≥102°F today · 15 d/yr by 30 yrs out
- Wind 2/10 Low
- Air quality 1/10 Low 0 unhealthy d/yr today · 0 by 30 yrs out
Nearby sold comps map
Loading sold comps map…
Walkable amenities ~0.75 mi
Loading nearby amenities…
Taxation est. · year 1
- Rental income
- $16,260
- − Mortgage interest
- −$4,476
- − Property taxes
- −$954
- − Insurance
- −$400
- − Repairs & maintenance
- −$1,301
- − Management
- −$1,301
- − Depreciation
- −$2,324
- Taxable income
- $5,504
- Est. tax owed @ 24.0%
- −$1,321
- After-tax cash flow
- $5,142/yr
For passive investors: Depreciation is non-cash, so a rental often shows a tax loss while cash-flowing — sheltering income. Rental losses are passive: they offset passive income freely, and up to $25,000/yr can offset ordinary (W-2) income if you actively participate and your MAGI is under $100k (phasing out to $0 by $150k); unused losses carry forward. On sale, claimed depreciation is recaptured at up to 25%, and gains may owe capital-gains tax (a 1031 exchange can defer both). Figures are a year-1 estimate at your 24.0% rate — not tax advice; consult a CPA.
Schools (NCES district)
- District
- Marshalltown Community School District
- NCES district ID
- 1918720
- Math proficiency
- 50% ▼ -8.00%
- Reading proficiency
- 52% ▬ 0.00%
- Median HH income
- $47,877
- Composite
- 43.41/100
- National rank
- #3015
- State rank
- #278 of 289 in IA
Livability — Marshalltown
- Score
- 78/100
- State rank
- #133
- US rank
- #2464
Category grades
Schools grade is shown separately in the Schools card above.
Census & demographics
- Census place
- Marshalltown, IA
- County
- Marshall County · 31,396 people
- City population
- 31,396
- Metro
- Marshalltown, IA
- Population (ZIP)
- 31,396
- Household income
- $70,367
- Rent vs Own
- Severe rent burden
- 369.0
Population outlook (Marshall County) Hauer SSP2
- Today (2025)
- 41,166 people
- By 2030
- 41,477 · +0.8%
- By 2040
- 42,548 · +3.4%
- By 2050
- 44,472 · +8.0%
- By 2075
- 52,719 · +28.1%
- By 2100
- 60,912 · +48.0%
Race, ethnicity, and origin ACS 2023
- Neighborhood character
- Majority White (60%)
- Race & ethnicity
- White 60% Hispanic / Latino 30% Two or more races 14% Asian 5% Black 2% Native American 1%
- Hispanic origin (detail)
- Mexican 25%
- Common ancestry
- Portuguese 3% Italian 2% Iranian 1%
- Foreign-born
- 17% · Canada, Philippines, China
- Languages at home
- 71% English-only · Spanish 24% Other Asian/Pacific 4% French/Haitian/Cajun 1%
Political lean MEDSL · Marshall
- 2024 margin
- R (+15.6) · D 41.4% · R 57.0% · Other 1.6%
- 2008→2024 swing
- -24.9pp toward R · 2008: 9.3pp · 2024: -15.6pp
- All cycles
- 2024: R+15.6 2020: R+7.7 2016: R+8.5 2012: D+8.9 2008: D+9.3
Not yet ingested
- Civics
- —
Market trends
- HPI YoY
- ▼ -161.80%
- Current HPI
- 177.4692
- Rent YoY
- —
- Metro
- Marshalltown, IA
- State GDP YoY
- ▲ 2.48%
- F500 in state
- 4
Industry mix (Fortune 500 HQ in IA)
| Industry | F500 HQs | Revenue |
|---|---|---|
| Financial Services | 1 | $16B |
|
||
| Retail / Convenience | 1 | $15B |
|
||
Price history
+23.1% since first listed3 events — show timeline
- 2026-03-20 Pending — IAR
- 2026-03-03 Listed $79,900 IAR
- 2023-03-24 Listed $64,900 IAR
Property tax history
+0.5%/yrLatest (2025): $954 · +34.4% YoY. Source: county tax records.
Cash-flow waterfall
monthlySold comps — $/sqft
last 12 mo · ≤1 miLoading sold comps…