3013 NW Comanche Dr · La Veta, CO
Flood risk 1/10 · Minimal
- FEMA flood zone
- X
- Chance of flooding over 30 yrs
- 0.0%
- Est. flood insurance / yr
- $507 – $1,088
Fire risk 5/10 · Moderate
- Est. fire insurance / yr
- $939 – $1,743
Heat risk 2/10 · Minimal
- Hot days now (above 88°F)
- 7 days/yr
- Hot days in 30 yrs
- 19 days/yr
Wind risk 1/10 · Minimal
- Chance of severe wind over 30 yrs
- —
Air-quality risk 3/10 · Minor
- Unhealthy air days now
- 3 days/yr
- Unhealthy air days in 30 yrs
- 3 days/yr
Risk factors via First Street. Map © Google.
Why this score? — see what drove the C grade
The composite is a weighted blend of 9 inputs, each scored 0–100. Each bar is that input's sub-score; the figure is the points it added to the 100-point composite (weight × sub-score).
- Cash flow +24.8/30.0
- DSCR +8.1/10.0
- ARV discount +7.5/15.0
- 1% rule +5.9/10.0
- Livability +3.1/5.0
- Rent growth +2.5/5.0
- Condition / age +2.5/5.0
- Appreciation +2.2/10.0
- Schools +1.7/10.0
$109,900
🖨 Deal sheet (PDF) 📄 Offer letter ✓ Due diligence
Listing remarks
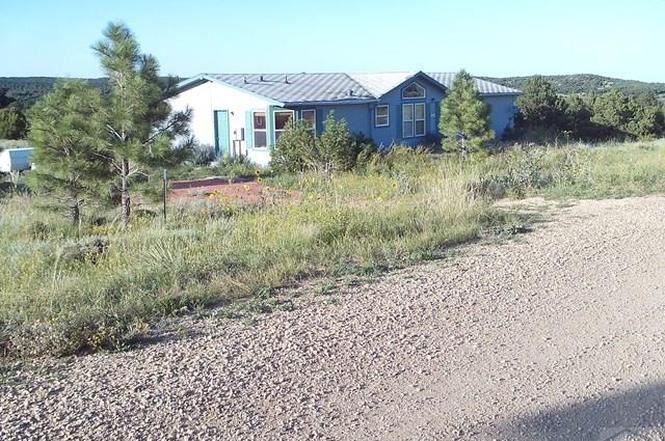
This is well maintained modular home setting on 3.02 acres with great views. It is located in a country subdivision with some covenants and a central water system. There is a 14ft X 15ft deck on the north side of the home with a hot tub. The interior of this home is sheet rocked, taped and textured with 2x6 walls. The property has a nice storage shed or it could be used for a work shop for the handy man guy. There are no close neighbors on either side and it sets right on a county road. For a factory build home this one is very spacious and it has a good floor plan. If you are looking for country living with all the comforts of the city than you must see this one. Give me a call and we woul
Key facts
- 3.02 acre lot
- Built 1998
Neighborhood map
What this means for you Summary
Snapshot
- This is a 3-bed/2.0-bath single-family listed at $110k.
Deal economics
- At list price, monthly cash flow is $234 ($3k/yr) — positive.
- The deal already cash-flows at list — no discount required.
- Meets the 1% rule at list price ($1k rent vs $110k).
- Cap rate 8.8% vs local median 1.9% in La Veta — top-decile yield for the area; either an underpriced asset or a hidden risk that comps aren't pricing in. Stress-test before assuming the spread holds.
Location & tenants
- Location reads 62/100 on livability (#198 in CO) — a middle-class / working-renter tenant base. Strengths: health & safety A+; Watch: employment C-, amenities D, crime F.
- Huerfano School District Re-1 (town): math 9% / reading 24% proficiency, ranked #163 of 176 in CO (top 93%) — low school quality limits family demand, transient renter base, plan for 1-2y turnover; 69% free/reduced lunch — lower-income household profile, screen leases tightly.
- Zoned schools: Peakview School (math 5% / reading 17%, grade F, #879 of 966 statewide, top 94%, 244 students, 84% FRL); John Mall Jr/Sr High School (math 24% / reading 24%, grade F, #266 of 381 statewide, top 79%, 171 students, 81% FRL).
- Market conditions: 360 active listings in the ZIP; 51 units permitted in Huerfano County in 2024 (0 in 5+ unit buildings).
Forward outlook
- Local home prices are declining (-3.0%/yr); year-one equity from $760 of loan paydown is wiped out by about $3k of value loss. Plan a longer hold.
- Huerfano County population projected at -36% by 2050 — secular population decline; favor cash flow + early exit over multi-decade hold.
Negotiation context
- Only 0 days on market — expect competitive offers; lowballing is unlikely to land.
Risks & watch-outs
- Climate carrying-cost: moderate wildfire risk — expect insurance premiums to compound above CPI over the hold.
Questions for the listing agent
- Is there a deadline driving the sale (1031 exchange, divorce, estate, relocation)? That informs how much negotiation room exists.
- Schools are D-rated, which usually means shorter tenancies and higher turnover. Who's the typical renter profile here, and what's been the actual vacancy rate?
- Crime grade is F in this area — have there been break-ins, vandalism, or insurance claims at this property in the last 3 years? What carrier currently insures it and at what premium?
- What's the average days-on-market for RENTAL listings here right now (not sales)? A rising rental-DOM trend means longer vacancies and softer asking-rent achievability than the comps imply.
- What's the recent tenant-quality profile in this submarket — average credit score on applications, eviction rate, late-payment / NSF rate, and stable-employment percentage? A property-management company in the area should have these aggregated.
- How much new for-sale + rental construction is in the pipeline within 1–3 miles? Heavy new supply typically softens prices + rents 12–24 months out; constrained supply supports both.
Investment metrics
- 1% rule
- 1.09% ✓
- Cap rate
- 8.84%
- Cash-on-cash
- 9.11%
- DSCR
- 1.41
- GRM
- 7.7
CMA / ARV
No comps found within radius.
Projected returns pro-forma
-3.0% appreciation · 3.0% rent growth · sell at horizon
- IRR
- -2.5%
- Equity multiple
- 0.90×
- Total profit
- $-2,936
- Equity at exit
- $16,386
- IRR
- 7.1%
- Equity multiple
- 1.54×
- Total profit
- $16,557
- Equity at exit
- $9,502
Cash invested: $30,772 (down + closing). Projections, not guarantees.
Landlord ↔ Tenant lean methodology
- Overall (STATE)
- 38 Tenant-Leaning
- State Colorado
- 38 Tenant-Leaning · D+4
- County
- — inherits STATE
- City
- — inherits STATE
ZIP-level market 81089
- Home prices YoY
- -2.4%
- Active inventory
- 360
- Price-to-rent
- 7.7×
Monthly cashflow live
- Estimated rent
- $1,193 medium interval (Pro) →
- Mortgage (P&I)
- −$576
- Tax from tax record
- −$87 /mo · $1,044/yr
- Insurance
- −$46
- HOA
- −$0
- Vacancy / Maint / Mgmt
- −$251
- Net cashflow
- $234
Break-even live
Sensitivity live
| Price | -10% $296 | -5% $265 | +0% $234 | +5% $203 | +10% $171 |
|---|---|---|---|---|---|
| Rent | -10% $139 | -5% $187 | +0% $234 | +5% $281 | +10% $328 |
| Rate | -1.0pp $289 | -0.5pp $262 | base $234 | +0.5pp $205 | +1.0pp $176 |
UW: 25.0% down · 7.5% · 30yr · 1.5% tax · 5.0% vac · 8.0% maint · 8.0% mgmt
Financing live
Cash to close
- Down payment
- $27,475
- Closing costs
- $3,297
- Reserves months
- —
- Total cash needed
- —
Loan-product check · same deal, 3 products live
Conventional
25% down · 7.5% · 30yr
- Down + closing
- —
- Monthly P&I
- —
- Monthly cashflow
- —
- DSCR
- —
- Eligible?
- —
Personal DTI + credit; lowest rate.
DSCR
20% down · 8.5% · 30yr
- Down + closing
- —
- Monthly P&I
- —
- Monthly cashflow
- —
- DSCR
- —
- Eligible?
- —
No personal income docs; deal must DSCR.
Hard money
10% down · 12.0% · 12mo
- Down + closing
- —
- Monthly P&I
- —
- Monthly cashflow
- —
- DSCR
- —
- Eligible?
- —
Short-term bridge; refi at stabilization.
Listing history 7 events
-
2023-08-26status Pending
-
2023-08-11historical
-
2022-06-21historical
-
2017-11-14soldstatus $109,900
-
2017-07-10$109,900
-
1998-03-19soldstatus $7,500
-
1987-05-14soldstatus $6,300
ⓘ Source: listings_history table (triggers on properties + properties_extension) + one-shot
backfill from property_details.listing_events for pre-trigger history.
Tax reassessment forecast CO · Resets to sale price
- Current annual tax
- $1,044 · $87/mo
- Projected year-2 tax
- $1,044 · $87/mo
- Expected delta
- $0/yr ($0/mo · 0.0%)
ⓘ Screening estimate from a state-policy table — verify with the county assessor before closing.
Climate risk First Street
- Flood 1/10 Low FEMA zone X · 0% chance over 30 yrs
- Wildfire 5/10 Major
- Heat 2/10 Low 7 d/yr ≥88°F today · 19 d/yr by 30 yrs out
- Wind 1/10 Low
- Air quality 3/10 Moderate 3 unhealthy d/yr today · 3 by 30 yrs out
Nearby sold comps map
Loading sold comps map…
Walkable amenities ~0.75 mi
Loading nearby amenities…
Taxation est. · year 1
- Rental income
- $14,321
- − Mortgage interest
- −$6,156
- − Property taxes
- −$1,044
- − Insurance
- −$550
- − Repairs & maintenance
- −$1,146
- − Management
- −$1,146
- − Depreciation
- −$3,197
- Taxable income
- $1,083
- Est. tax owed @ 24.0%
- −$260
- After-tax cash flow
- $2,545/yr
For passive investors: Depreciation is non-cash, so a rental often shows a tax loss while cash-flowing — sheltering income. Rental losses are passive: they offset passive income freely, and up to $25,000/yr can offset ordinary (W-2) income if you actively participate and your MAGI is under $100k (phasing out to $0 by $150k); unused losses carry forward. On sale, claimed depreciation is recaptured at up to 25%, and gains may owe capital-gains tax (a 1031 exchange can defer both). Figures are a year-1 estimate at your 24.0% rate — not tax advice; consult a CPA.
Schools (NCES district)
- District
- Huerfano School District Re-1
- NCES district ID
- 0807080
- Math proficiency
- 9% ▼ -3.00%
- Reading proficiency
- 24% ▼ -4.00%
- Median HH income
- $31,069
- Composite
- 16.56/100
- National rank
- #14243
- State rank
- #163 of 176 in CO
Livability — La Veta
- Score
- 62/100
- State rank
- #198
- US rank
- #16099
Category grades
Schools grade is shown separately in the Schools card above.
Census & demographics
- Population (ZIP)
- 4,810
Population outlook (Huerfano County) Hauer SSP2
- Today (2025)
- 5,963 people
- By 2030
- 5,550 · -6.9%
- By 2040
- 4,598 · -22.9%
- By 2050
- 3,849 · -35.5%
- By 2075
- 2,906 · -51.3%
- By 2100
- 2,156 · -63.8%
Race, ethnicity, and origin ACS 2023
- Neighborhood character
- Diverse neighborhood (Simpson 0.55)
- Race & ethnicity
- White 56% Hispanic / Latino 36% Two or more races 9% Native American 3%
- Hispanic origin (detail)
- Mexican 17%
- Common ancestry
- Scottish 2% Serbian 1% Romanian 1%
- Foreign-born
- 0% · Canada
- Languages at home
- 93% English-only · Spanish 6%
Political lean MEDSL · Huerfano
- 2024 margin
- Lean R (+8.6) · D 44.3% · R 52.9% · Other 2.9%
- 2008→2024 swing
- -19.8pp toward R · 2008: 11.2pp · 2024: -8.6pp
- All cycles
- 2024: R+8.6 2020: R+2.9 2016: R+6.5 2012: D+7.8 2008: D+11.2
Not yet ingested
- Civics
- —
Market trends
- HPI YoY
- ▼ -5.61%
- Current HPI
- 227.112
- Rent YoY
- —
- Metro
- —
- State GDP YoY
- ▲ 1.95%
- F500 in state
- 14
Industry mix (Fortune 500 HQ in CO)
| Industry | F500 HQs | Revenue |
|---|---|---|
| Technology Distribution | 1 | $31B |
|
||
| Food / Agriculture | 1 | $18B |
|
||
| Packaging | 1 | $14B |
|
||
| Healthcare | 1 | $13B |
|
||
| Energy | 1 | $10B |
|
||
| Technology | 1 | $4B |
|
||
Price history
+1644.4% since first listed7 events — show timeline
- 2023-08-26 Pending — PARMLS
- 2023-08-11 Delisted — PARMLS
- 2022-06-21 Delisted — PARMLS
- 2017-11-14 Sold (Public Records) $109,900 Public Records
- 2017-07-10 Listed $109,900 PARMLS
- 1998-03-19 Sold (Public Records) $7,500 Public Records
- 1987-05-14 Sold (Public Records) $6,300 Public Records
Property tax history
+24.5%/yrLatest (2025): $1,044 · +55.4% YoY. Source: county tax records.
Cash-flow waterfall
monthlySold comps — $/sqft
last 12 mo · ≤1 miLoading sold comps…