517 S Lamont · Aransas Pass, TX
Flood risk 4/10 · Minor
- FEMA flood zone
- X (unshaded)
- Chance of flooding over 30 yrs
- 0.21%
- Est. flood insurance / yr
- $507 – $1,088
Fire risk 2/10 · Minimal
- Est. fire insurance / yr
- $1,222 – $2,270
Heat risk 10/10 · Severe
- Hot days now (above 106°F)
- 7 days/yr
- Hot days in 30 yrs
- 29 days/yr
Wind risk 9/10 · Severe
- Chance of severe wind over 30 yrs
- 99.0%
Air-quality risk 1/10 · Minimal
- Unhealthy air days now
- 0 days/yr
- Unhealthy air days in 30 yrs
- 0 days/yr
Risk factors via First Street. Map © Google.
Why this score? — see what drove the B+ grade
The composite is a weighted blend of 9 inputs, each scored 0–100. Each bar is that input's sub-score; the figure is the points it added to the 100-point composite (weight × sub-score).
- Cash flow +30.0/30.0
- ARV discount +15.0/15.0
- 1% rule +10.0/10.0
- DSCR +10.0/10.0
- Livability +3.6/5.0
- Condition / age +2.8/5.0
- Schools +2.7/10.0
- Rent growth +2.5/5.0
- Appreciation +0.0/10.0
$139,000
🖨 Deal sheet 📄 Offer letter ✓ Due diligence
Listing remarks
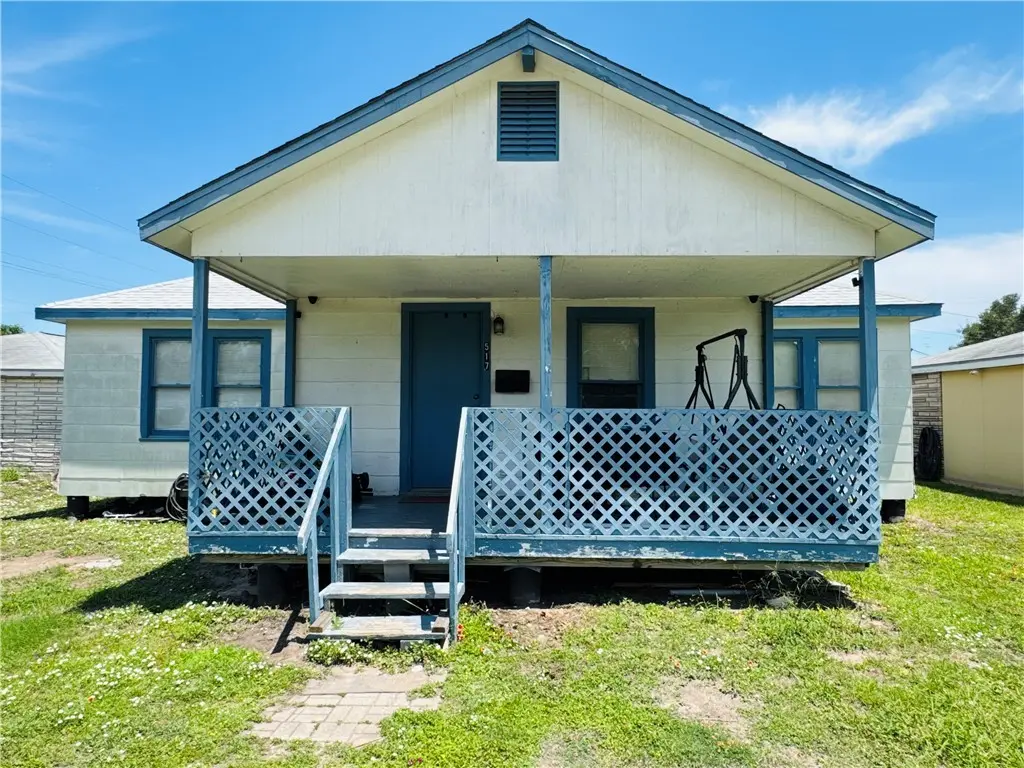
3-bedroom, 2-bath home on a 5,000 sq ft lot in Aransas Pass. Features hardwood floors throughout living areas and bedrooms, arched doorway between living and dining rooms, white kitchen with tile floor, and a covered front porch.
Key facts
- Covered front porch
- Arched doorway
- Hardwood floors
Tags
Property features AI
Finance
- Other: Lot size approximately 0.11 acres
- Financial info: No financial details provided
- HOA & community: Short-term rentals allowed
Exterior
- Parking: Front entry parking
- Security: No security features specified
- Utilities: Public water available; Public sewer available; Utilities available
- Home design: Single-story home; Shingle roof; Built with HardiPlank and wood siding; Pillar/post/pier foundation; Located on an interior lot with city street frontage
- Construction: HardiPlank and wood siding construction; Shingle roof; Pillar/Post/Pier foundation; 1 story
- Exterior features: No additional exterior features specified; Wood fencing
Interior
- Kitchen: Electric oven; Electric range
- Bedrooms: Bedroom details not provided
- Flooring: Hardwood flooring; Tile flooring
- Bathrooms: 2 full bathrooms
- Heating & cooling: Central heating (electric); Central air conditioning
- Interior features: No additional interior features specified
- Laundry & utility: Washer hookup; Dryer hookup
Neighborhood map
What this means for you Summary
Snapshot
- This is a 3-bed/2.0-bath single-family listed at $139k. Condition is rated average.
Deal economics
- At list price, monthly cash flow is $875 ($10k/yr) — positive.
- The deal already cash-flows at list — no discount required.
- Meets the 1% rule at list price ($2k rent vs $139k).
- Recommended offer: $135k (3.0% below list) — sets the bar for market timing.
- Cap rate 13.8% vs local median 4.6% in Aransas Pass — top-decile yield for the area; either an underpriced asset or a hidden risk that comps aren't pricing in. Stress-test before assuming the spread holds.
Location & tenants
- Location reads 72/100 on livability (#253 in TX) — a middle-class / working-renter tenant base. Strengths: cost of living A+, housing A+, health & safety A+; Watch: schools D, amenities F, commute F.
- Aransas Pass ISD (town): math 28% / reading 35% proficiency, ranked #597 of 826 in TX (top 72%) — families likely to look elsewhere, expect single-tenant / working-renter base with shorter leases; 64% free/reduced lunch — lower-income household profile, screen leases tightly.
- Market conditions: 275 active listings in the ZIP; 5 comparable units currently listed for rent nearby; rentals at typical pace (median 22d on market — plan ~3-4 weeks tenant-placement turnaround); 40% of comp listings sitting > 30 days — soft ceiling on asking rent; 344 units permitted in San Patricio County in 2024 (0 in 5+ unit buildings).
Forward outlook
- Local home prices are declining (-3.0%/yr); year-one equity from $961 of loan paydown is wiped out by about $4k of value loss. Plan a longer hold.
- San Patricio County population projected at +27% by 2050 — long-run rental-demand tailwind backs the buy-and-hold thesis.
- At projected returns (-3.0% appreciation + 3.0% rent growth), your $39k cash investment doubles in ~5 years — after that, you're playing with house money.
Negotiation context
- It's been on market 56 days — a 3% lower offer ($135k) is reasonable based on typical stale-listing flexibility.
Risks & watch-outs
- Watch-outs: built in 1950 — expect roof / HVAC / electrical / plumbing capex.
- Climate carrying-cost: severe wind risk, 99% chance of damaging wind over 30y; extreme-heat days projected 7→29/yr by 2055 (HVAC capex compounding) — expect insurance premiums to compound above CPI over the hold.
Questions for the listing agent
- It's been on market 56 days. Have you received any prior offers? Is the seller open to a 3% concession, seller financing, or rate buy-down credit?
- Built in 1950 — when were the roof, HVAC, electrical panel, plumbing, and water heater last replaced?
- Is there a deadline driving the sale (1031 exchange, divorce, estate, relocation)? That informs how much negotiation room exists.
- Schools are D-rated, which usually means shorter tenancies and higher turnover. Who's the typical renter profile here, and what's been the actual vacancy rate?
- What's the average days-on-market for RENTAL listings here right now (not sales)? A rising rental-DOM trend means longer vacancies and softer asking-rent achievability than the comps imply.
- What's the recent tenant-quality profile in this submarket — average credit score on applications, eviction rate, late-payment / NSF rate, and stable-employment percentage? A property-management company in the area should have these aggregated.
- How much new for-sale + rental construction is in the pipeline within 1–3 miles? Heavy new supply typically softens prices + rents 12–24 months out; constrained supply supports both.
Investment metrics
- 1% rule
- 1.67% ✓
- Cap rate
- 13.84%
- Cash-on-cash
- 26.97%
- DSCR
- 2.20
- GRM
- 5.0
CMA / ARV
- ARV (median comp)
- $174,523
- List price
- $139,000
- Delta
- -20.35%
- Verdict
- UNDERPRICED
- Comps
- 20 within 1.0 mi
Show comp detail 12 sales within ~0.75 mi
| Address | Dist | Beds/Ba | Sqft | Sold | Price | $/sf | Match |
|---|---|---|---|---|---|---|---|
| 630 S Lamont | 0.12mi | 3/2.0 | 1,269 (+10%) | 1mo | $229,000 | $180 | 76 |
| 348 S Whitney St | 0.15mi | 2/2.5 (-1) | 1,220 (+6%) | 2mo | $199,000 | $163 | 74 |
| 612 S 9th St | 0.39mi | 3/1.0 | 1,131 (-2%) | 7mo | $127,900 | $113 | 69 |
| 921 S Mccampbell | 0.40mi | 3/2.0 | 1,121 (-3%) | 10mo | $199,000 | $178 | 69 |
| 553 S 12th St | 0.57mi | 3/2.0 | 1,108 (-4%) | 6mo | $175,000 | $158 | 62 |
| 114 Spoonbill Ave | 0.67mi | 3/1.5 | 1,120 (-3%) | 4mo | $175,000 | $156 | 59 |
| 101 Saunders Ln | 0.64mi | 3/2.0 | 1,206 (+5%) | 9mo | $220,000 | $182 | 55 |
| 229 S 12th St | 0.63mi | 3/2.0 | 1,264 (+10%) | 0mo | $219,000 | $173 | 54 |
| 1315 W Goodnight Ave | 0.61mi | 3/1.0 | 1,066 (-7%) | 6mo | $82,500 | $77 | 50 |
| 413 S 13th St | 0.64mi | 3/1.0 | 1,040 (-10%) | 10mo | $190,000 | $183 | 42 |
| 1034 S 10th St | 0.66mi | 2/2.0 (-1) | 1,312 (+14%) | 5mo | $179,900 | $137 | 37 |
| 110 Saunders | 0.69mi | 3/2.0 | 978 (-15%) | 10mo | $205,000 | $210 | 34 |
Match score weights: distance 35% · size 25% · config 20% · recency 20%. Top-matched comps best support the ARV.
Projected returns pro-forma
-3.0% appreciation · 3.0% rent growth · sell at horizon
- IRR
- 20.9%
- Equity multiple
- 1.85×
- Total profit
- $33,214
- Equity at exit
- $20,725
- IRR
- 29.1%
- Equity multiple
- 3.59×
- Total profit
- $100,790
- Equity at exit
- $12,018
Cash invested: $38,920 (down + closing). Projections, not guarantees.
Landlord ↔ Tenant lean methodology
- Overall (STATE)
- 87 Strongly Landlord-Friendly
- State Texas
- 87 Strongly Landlord-Friendly · R+5
- County
- — inherits STATE
- City
- — inherits STATE
ZIP-level market 78336
- Home prices YoY
- -29.5%
- Active inventory
- 275
- Price-to-rent
- 5.0×
Monthly cashflow live
- Estimated rent
- $2,323 high interval (Pro) →
- Mortgage (P&I)
- −$729
- Tax est. 1.5%
- −$174 /mo · $2,085/yr
- Insurance
- −$58
- HOA
- −$0
- Vacancy / Maint / Mgmt
- −$488
- Net cashflow
- $875
Break-even live
UW: 25.0% down · 7.5% · 30yr · 1.5% tax · 5.0% vac · 8.0% maint · 8.0% mgmt
Financing live
Cash to close
- Down payment
- $34,750
- Closing costs
- $4,170
- Reserves months
- —
- Total cash needed
- —
Loan-product check · same deal, 3 products live
Conventional
25% down · 7.5% · 30yr
- Down + closing
- —
- Monthly P&I
- —
- Monthly cashflow
- —
- DSCR
- —
- Eligible?
- —
Personal DTI + credit; lowest rate.
DSCR
20% down · 8.5% · 30yr
- Down + closing
- —
- Monthly P&I
- —
- Monthly cashflow
- —
- DSCR
- —
- Eligible?
- —
No personal income docs; deal must DSCR.
Hard money
10% down · 12.0% · 12mo
- Down + closing
- —
- Monthly P&I
- —
- Monthly cashflow
- —
- DSCR
- —
- Eligible?
- —
Short-term bridge; refi at stabilization.
Rent comps 5 comps
| Address | Beds | Baths | Sqft | Rent | $/sqft | DOM | Units | Dist |
|---|---|---|---|---|---|---|---|---|
| 1109 W Nelson Ave Aransas Pass, TX | 2.0 | 2.0 | 1304 | $1,800 | $1.38 | 44d | 1 | 0.46mi |
| 1131 S 8th St Unit 1268400P Aransas Pass, TX | 3.0 | 2.0 | 1280 | $4,105 | $3.21 | 44d | 1 | 0.65mi |
| 633 N Commercial St Aransas Pass, TX | 2.0 | 1.0 | 900 | $1,850 | $2.06 | 21d | 1 | 0.98mi |
| 203 E Ransom Rd Aransas Pass, TX | 2.0 | 1.0 | 625 | $1,145 | $1.83 | 13d | 5 | 0.98mi |
| 2255 McMullen Ln Aransas Pass, TX | 2.0–4.0 | 2.5 | 1581 | $1,569 | $0.99 | 13d | 9 | 1.32mi |
Listing history 18 events
-
2026-06-19days on market $139,000 Active 56 DOM
-
2026-06-18days on market $139,000 Active 55 DOM
-
2026-06-17days on market $139,000 Active 54 DOM
-
2026-06-16days on market $139,000 Active 53 DOM
-
2026-06-15pricedays on market $139,000 Active 52 DOM
-
2026-06-14days on market $144,900 Active 50 DOM
-
2026-06-12days on market $144,900 Active 49 DOM
-
2026-06-09days on market $144,900 Active 46 DOM
-
2026-06-08days on market $144,900 Active 45 DOM
-
2026-06-07days on market $144,900 Active 44 DOM
-
2026-06-07days on market $144,900 Active 43 DOM
-
2026-06-04days on market $144,900 Active 40 DOM
-
2026-06-02days on market $144,900 Active 39 DOM
-
2026-06-01days on market $144,900 Active 38 DOM
-
2026-05-31days on market $144,900 Active 37 DOM
-
2026-05-31days on market $144,900 Active 36 DOM
-
2026-05-06price $149,000 229-char remark
-
2026-04-24$159,000 Active 229-char remark
ⓘ Source: listings_history table (triggers on properties + properties_extension) + one-shot
backfill from property_details.listing_events for pre-trigger history.
Climate risk First Street
- Flood 4/10 Moderate FEMA zone X (unshaded) · 21% chance over 30 yrs
- Wildfire 2/10 Low
- Heat 10/10 Extreme 7 d/yr ≥106°F today · 29 d/yr by 30 yrs out
- Wind 9/10 Extreme 99% chance of damaging wind over 30 yrs
- Air quality 1/10 Low 0 unhealthy d/yr today · 0 by 30 yrs out
Nearby sold comps map
Loading sold comps map…
Walkable amenities ~0.75 mi
Loading nearby amenities…
Taxation est. · year 1
- Rental income
- $27,876
- − Mortgage interest
- −$7,786
- − Property taxes
- −$2,085
- − Insurance
- −$695
- − Repairs & maintenance
- −$2,230
- − Management
- −$2,230
- − Depreciation
- −$4,044
- Taxable income
- $8,806
- Est. tax owed @ 24.0%
- −$2,113
- After-tax cash flow
- $8,381/yr
For passive investors: Depreciation is non-cash, so a rental often shows a tax loss while cash-flowing — sheltering income. Rental losses are passive: they offset passive income freely, and up to $25,000/yr can offset ordinary (W-2) income if you actively participate and your MAGI is under $100k (phasing out to $0 by $150k); unused losses carry forward. On sale, claimed depreciation is recaptured at up to 25%, and gains may owe capital-gains tax (a 1031 exchange can defer both). Figures are a year-1 estimate at your 24.0% rate — not tax advice; consult a CPA.
Condition & rehab AI · 12 photos
A 3-bedroom, 2-bath home with average condition, requiring moderate repairs and maintenance to improve its resale and rental value.
Repairs flagged
- Minor kitchen cabinets — slight wear
- Minor bathroom fixtures — standard fixtures
- Moderate exterior paint — white siding needs touch-up
- Minor interior walls — some wear
- Minor HVAC system — standard ceiling fans
Value-add opportunities
- Resale paint exterior — enhances curb appeal
- Rental replace ceiling fans — modernizes space
- Both update kitchen cabinets — improves functionality and aesthetics
- Both update bathrooms — modernizes and improves functionality
Renovation cost estimate screening
| Repair item | Severity | Est. cost |
|---|---|---|
| kitchen cabinets · slight wear | Minor | $500–3,000 |
| bathroom fixtures · standard fixtures | Minor | $500–3,000 |
| exterior paint · white siding needs touch-up | Moderate | $3,000–15,000 |
| interior walls · some wear | Minor | $500–3,000 |
| HVAC system · standard ceiling fans | Minor | $500–3,000 |
| Total estimated repair cost · 5 items | $5,000–27,000 |
Value-add ROI direction
- Resale paint exterior — enhances curb appeal ↑
- Rental replace ceiling fans — modernizes space ↑
- Both update kitchen cabinets — improves functionality and aesthetics ↑
- Both update bathrooms — modernizes and improves functionality ↑
ⓘ Cost ranges are severity-bucket heuristics (US national rule-of-thumb). Get contractor quotes + a written scope before underwriting a rehab budget.
Schools (NCES district)
- District
- Aransas Pass ISD
- NCES district ID
- 4808580
- Math proficiency
- 28% ▼ -16.00%
- Reading proficiency
- 35% ▼ -4.00%
- Median HH income
- $40,869
- Composite
- 26.55/100
- National rank
- #7191
- State rank
- #597 of 826 in TX
Livability — Aransas Pass
- Score
- 72/100
- State rank
- #253
- US rank
- #5980
Category grades
Schools grade is shown separately in the Schools card above.
Census & demographics
- Census place
- Aransas Pass, TX
- Population (ZIP)
- 12,146
Population outlook (San Patricio County) Hauer SSP2
- Today (2025)
- 75,538 people
- By 2030
- 79,575 · +5.3%
- By 2040
- 87,670 · +16.1%
- By 2050
- 96,107 · +27.2%
- By 2075
- 117,984 · +56.2%
- By 2100
- 130,010 · +72.1%
Race, ethnicity, and origin ACS 2023
- Neighborhood character
- Diverse neighborhood (Simpson 0.58)
- Race & ethnicity
- White 49% Hispanic / Latino 43% Two or more races 21% Asian 2% Native American 2% Black 2%
- Hispanic origin (detail)
- Mexican 36% Puerto Rican 2%
- Common ancestry
- Italian 2% Lithuanian 2% Slovak 1%
- Foreign-born
- 9% · Canada, Jamaica, China
- Languages at home
- 77% English-only · Spanish 21% Tagalog/Filipino 1%
Political lean MEDSL · San Patricio
- 2024 margin
- Solid R (+36.4) · D 31.4% · R 67.8%
- 2008→2024 swing
- -19.8pp toward R · 2008: -16.6pp · 2024: -36.4pp
- All cycles
- 2024: R+36.4 2020: R+29.1 2016: R+24.1 2012: R+20.6 2008: R+16.6
Not yet ingested
- Civics
- —
Market trends
- HPI YoY
- ▼ -78.56%
- Current HPI
- 187.8443
- Rent YoY
- —
- Metro
- —
- State GDP YoY
- ▲ 3.95%
- F500 in state
- 110
Industry mix (Fortune 500 HQ in TX)
| Industry | F500 HQs | Revenue |
|---|---|---|
| Energy | 16 | $1,198B |
|
||
| Technology | 5 | $198B |
|
||
| Engineering / Construction | 4 | $72B |
|
||
| Energy Services | 3 | $60B |
|
||
| Utilities | 3 | $41B |
|
||
| Healthcare | 2 | $330B |
|
||
Price history
-12.6% since first listed4 events — show timeline
- 2026-06-11 Price Changed $139,000 CBMLS
- 2026-05-22 Price Changed $144,900 CBMLS
- 2026-05-06 Price Changed $149,000 CBMLS
- 2026-04-24 Listed $159,000 CBMLS
Cash-flow waterfall
monthlySold comps — $/sqft
last 12 mo · ≤1 miLoading sold comps…