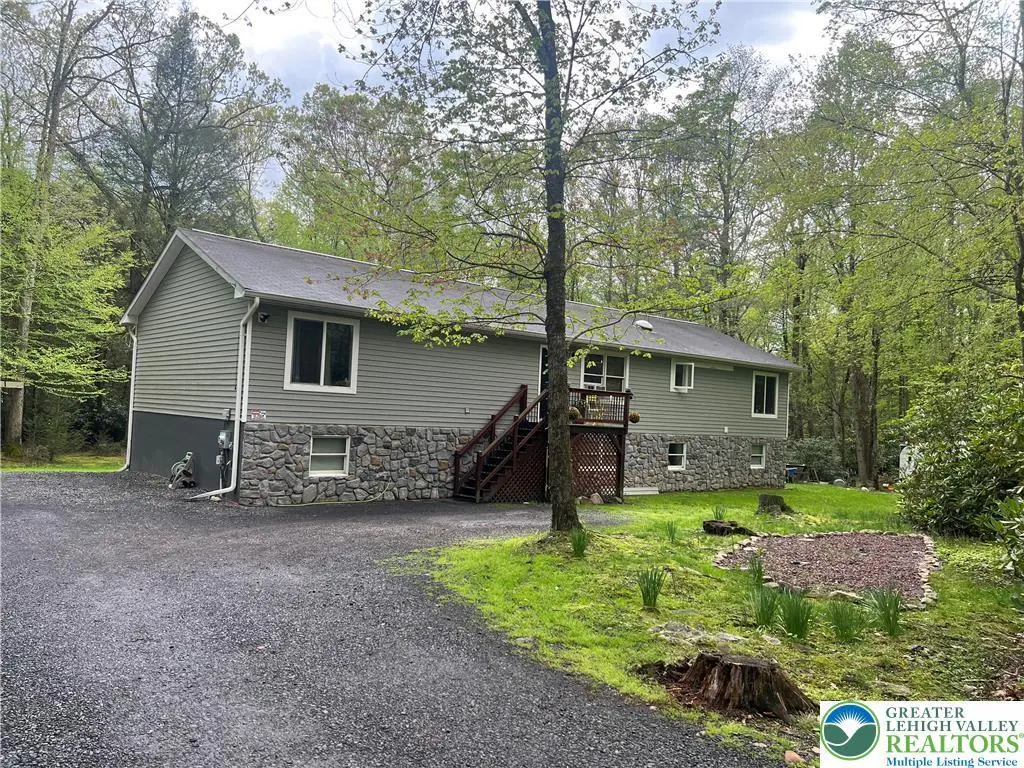
199 Lower Valley Dr · Indian Mountain Lake, PA
Flood risk 1/10 · Minimal
- FEMA flood zone
- X (unshaded)
- Chance of flooding over 30 yrs
- 0.0%
- Est. flood insurance / yr
- $473 – $860
Fire risk 4/10 · Minor
- Est. fire insurance / yr
- $511 – $949
Heat risk 3/10 · Minor
- Hot days now (above 93°F)
- 7 days/yr
- Hot days in 30 yrs
- 16 days/yr
Wind risk 4/10 · Minor
- Chance of severe wind over 30 yrs
- 9.0%
Air-quality risk 3/10 · Minor
- Unhealthy air days now
- 1 days/yr
- Unhealthy air days in 30 yrs
- 4 days/yr
Risk factors via First Street. Map © Google.
Why this score? — see what drove the F grade
The composite is a weighted blend of 9 inputs, each scored 0–100. Each bar is that input's sub-score; the figure is the points it added to the 100-point composite (weight × sub-score).
- ARV discount +8.1/15.0
- Appreciation +8.1/10.0
- Cash flow +4.1/30.0
- Schools +3.7/10.0
- Livability +3.1/5.0
- Rent growth +2.5/5.0
- Condition / age +2.5/5.0
- 1% rule +0.7/10.0
- DSCR +0.0/10.0
$350,000
🖨 Deal sheet (PDF) 📄 Offer letter ✓ Due diligence
Listing remarks
MOTIVATED SELLERS - Beautiful bi-level in the serene setting of Pleasant Valley Estates. You'll be living on vacation! This home has been lovingly updated and maintained. You'll be dazzled by the open concept living room, dining room and kitchen which are flooded with natural light from the wall of windows and a sliding door. Step out for morning coffee on the deck and observe the wooded hills and forest animals. 3 bedrooms, 2 bathrooms and an oversized laundry room complete this level - including a spa like primary bathroom with a soaking tub. The lower level offers 2 additional bedrooms, another full bath and a large family room. A huge storage area - perfect for tools, business supplies
Key facts
- Huge storage area
- Large family room
- Spacious backyard
Tags
Property features AI
Finance
- HOA & community: Annual association fee of $400
Exterior
- Parking: Detached garage; 1 garage space; Carport; Driveway; Off-street parking
- Utilities: Well water; Septic tank and holding tank
- Home design: 2-story home; Basement with exterior entry and walk-out access; Below-grade finished area; Above-grade finished area
- Construction: Stone, stucco and vinyl siding exterior; Asphalt/fiberglass roof; Basement foundation; Built with basement (partially finished)
- Exterior features: Deck; Shed(s); Property has a view
Interior
- Kitchen: Dishwasher; Electric oven; Microwave; Refrigerator; Kitchen island; Eat-in kitchen
- Bedrooms: Bedrooms located on upper level (laundry on upper level)
- Flooring: Carpet; Ceramic tile
- Bathrooms: 3 full bathrooms
- Heating & cooling: Baseboard heating; Coal heating; Electric heating; Ceiling fan(s); Wall unit(s) cooling
- Interior features: Dining area; Eat-in kitchen; Kitchen island; Family room on main level; Skylights; Walk-in closet(s)
- Laundry & utility: Washer included; Laundry on upper level; Electric water heater
Neighborhood map
What this means for you Summary
Snapshot
- This is a 3-bed/2.5-bath single-family listed at $350k.
Deal economics
- At list price, monthly cash flow is $-970 ($-12k/yr) — negative.
- To cash-flow at today's rent, offer at most $179k (48.9% below list).
- To meet the 1% rule (rent ≥ 1% of price), the offer needs to be $198k (43.3% below list).
- Recommended offer: $179k (48.9% below list) — sets the bar for cash-flow.
- Cap rate 3.0% vs local median 5.0% in Indian Mountain Lake — below-typical yield; the buyer is paying a premium for something (appreciation thesis, condition, location) that the cap rate doesn't capture.
Location & tenants
- Location reads 62/100 on livability (#1,349 in PA) — a middle-class / working-renter tenant base. Strengths: cost of living A+, housing A+, crime A; Watch: health & safety D, amenities F, commute F.
- Pleasant Valley SD (rural): math 31% / reading 53% proficiency, ranked #297 of 539 in PA (top 55%) — families likely to look elsewhere, expect single-tenant / working-renter base with shorter leases.
- Zoned schools: Pleasant Valley El Sch (math 39% / reading 51%, grade D-, #809 of 1,518 statewide, top 54%, 899 students, 50% FRL); Pleasant Valley Ms (math 19% / reading 58%, grade F, #275 of 512 statewide, top 55%, 950 students, 50% FRL); Pleasant Valley Hs (math 72% / reading 30%, grade D+, #123 of 437 statewide, top 28%, 1,343 students, 39% FRL).
- Market conditions: 93 active listings in the ZIP; 278 units permitted in Monroe County in 2024 (52 in 5+ unit buildings).
Forward outlook
- In year one you build about $24k of equity ($2k loan paydown + $22k appreciation (6.2% local appreciation)).
- Monroe County population projected at -11% by 2050 — secular population decline; favor cash flow + early exit over multi-decade hold.
- By year 2, paydown + projected appreciation supports a ~$39k cash-out refi (75% LTV) — recoverable capital for the next deal without selling this one.
Negotiation context
- Only 7 days on market — expect competitive offers; lowballing is unlikely to land.
- 5 sale attempts since 5y ago with the ask held roughly flat each time — persistent listings suggest the price (not the market) is what's stuck; bring a comps-based counter.
- Current owner paid $270k; 30% above their basis — modest negotiation headroom, anchor on the comps not their cost.
Questions for the listing agent
- What do current leases actually rent for vs. the listed asking? Can we see a recent rent roll and the last 12 months of T-12 income?
- What does the HOA fee cover, when was the last increase, and are there any pending special assessments or reserve-fund shortfalls?
- Is there a deadline driving the sale (1031 exchange, divorce, estate, relocation)? That informs how much negotiation room exists.
- Schools are D-rated, which usually means shorter tenancies and higher turnover. Who's the typical renter profile here, and what's been the actual vacancy rate?
- The area grade is low — what's the realistic commute time and amenity access for the typical tenant pool here? Any planned neighborhood developments (good or bad) we should know about?
- What's the average days-on-market for RENTAL listings here right now (not sales)? A rising rental-DOM trend means longer vacancies and softer asking-rent achievability than the comps imply.
- What's the recent tenant-quality profile in this submarket — average credit score on applications, eviction rate, late-payment / NSF rate, and stable-employment percentage? A property-management company in the area should have these aggregated.
- How much new for-sale + rental construction is in the pipeline within 1–3 miles? Heavy new supply typically softens prices + rents 12–24 months out; constrained supply supports both.
Investment metrics
- 1% rule
- 0.57% ✗
- Cap rate
- 2.97%
- Cash-on-cash
- -11.87%
- DSCR
- 0.47
- GRM
- 14.7
CMA / ARV
- ARV (median comp)
- $354,400
- List price
- $350,000
- Delta
- 1.30%
- Verdict
- FAIR
- Comps
- 13 within 1.0 mi
Show comp detail 5 sales within ~0.75 mi
| Address | Dist | Beds/Ba | Sqft | Sold | Price | $/sf | Match |
|---|---|---|---|---|---|---|---|
| 671 Dotters Corner Rd | 0.20mi | 3/3.0 | 1,692 (-14%) | 8mo | $265,000 | $157 | 59 |
| 107 Plum Dr | 0.27mi | 3/2.0 | 1,737 (-11%) | 11mo | $340,000 | $196 | 57 |
| 250 Bird Ln | 0.74mi | 3/2.0 | 2,016 (+3%) | 7mo | $355,000 | $176 | 53 |
| 1614 Sugar Ln | 0.61mi | 3/3.0 | 1,788 (-9%) | 9mo | $333,000 | $186 | 47 |
| 113 Acorn Ln 8 | 0.75mi | 3/2.0 | 1,675 (-14%) | 7mo | $290,000 | $173 | 33 |
Match score weights: distance 35% · size 25% · config 20% · recency 20%. Top-matched comps best support the ARV.
Projected returns pro-forma
6.25% appreciation · 3.0% rent growth · sell at horizon
- IRR
- 6.6%
- Equity multiple
- 1.46×
- Total profit
- $44,611
- Equity at exit
- $225,571
- IRR
- 8.6%
- Equity multiple
- 2.82×
- Total profit
- $178,473
- Equity at exit
- $413,937
Cash invested: $98,000 (down + closing). Projections, not guarantees.
Landlord ↔ Tenant lean methodology
- Overall (STATE)
- 62 Landlord-Friendly
- State Pennsylvania
- 62 Landlord-Friendly · EVEN
- County
- — inherits STATE
- City
- — inherits STATE
ZIP-level market 18058
- Home prices YoY
- 3.4%
- Active inventory
- 93
- Price-to-rent
- 14.7×
Monthly cashflow live
- Estimated rent
- $1,984 medium interval (Pro) →
- Mortgage (P&I)
- −$1,835
- Tax from tax record
- −$523 /mo · $6,271/yr
- Insurance
- −$146
- HOA
- −$33
- Vacancy / Maint / Mgmt
- −$417
- Net cashflow
- $-970
Break-even live
Sensitivity live
| Price | -10% $-772 | -5% $-871 | +0% $-970 | +5% $-1,069 | +10% $-1,168 |
|---|---|---|---|---|---|
| Rent | -10% $-1,126 | -5% $-1,048 | +0% $-970 | +5% $-891 | +10% $-813 |
| Rate | -1.0pp $-793 | -0.5pp $-881 | base $-970 | +0.5pp $-1,060 | +1.0pp $-1,153 |
UW: 25.0% down · 7.5% · 30yr · 1.5% tax · 5.0% vac · 8.0% maint · 8.0% mgmt
Financing live
Cash to close
- Down payment
- $87,500
- Closing costs
- $10,500
- Reserves months
- —
- Total cash needed
- —
Loan-product check · same deal, 3 products live
Conventional
25% down · 7.5% · 30yr
- Down + closing
- —
- Monthly P&I
- —
- Monthly cashflow
- —
- DSCR
- —
- Eligible?
- —
Personal DTI + credit; lowest rate.
DSCR
20% down · 8.5% · 30yr
- Down + closing
- —
- Monthly P&I
- —
- Monthly cashflow
- —
- DSCR
- —
- Eligible?
- —
No personal income docs; deal must DSCR.
Hard money
10% down · 12.0% · 12mo
- Down + closing
- —
- Monthly P&I
- —
- Monthly cashflow
- —
- DSCR
- —
- Eligible?
- —
Short-term bridge; refi at stabilization.
HOA detail
- Monthly dues
- $33 · $396/yr
Listing history 14 events
-
2026-06-22days on market $350,000 Active 7 DOM
-
2026-06-19days on market $350,000 Active 4 DOM
-
2026-06-18days on market $350,000 Active 3 DOM
-
2026-06-17days on market $350,000 Active 2 DOM
-
2026-06-15pricestatusdays on market $350,000 Active 1 DOM
-
2026-05-17status Pending 967-char remark
-
2026-04-23$359,000 Active 967-char remark
-
2025-06-12historical
-
2025-05-27price $350,000
-
2025-05-09$400,000 Active
-
2021-10-22soldstatus $270,000
-
2021-10-13soldstatus $270,000
-
2021-08-19$250,000
-
2007-07-12soldstatus $185,000
ⓘ Source: listings_history table (triggers on properties + properties_extension) + one-shot
backfill from property_details.listing_events for pre-trigger history.
Tax reassessment forecast PA · Partial reset (capped growth)
- Current annual tax
- $6,271 · $523/mo
- Projected year-2 tax
- $6,271 · $523/mo
- Expected delta
- $0/yr ($0/mo · 0.0%)
ⓘ Screening estimate from a state-policy table — verify with the county assessor before closing.
Climate risk First Street
- Flood 1/10 Low FEMA zone X (unshaded) · 0% chance over 30 yrs
- Wildfire 4/10 Moderate
- Heat 3/10 Moderate 7 d/yr ≥93°F today · 16 d/yr by 30 yrs out
- Wind 4/10 Moderate 9% chance of damaging wind over 30 yrs
- Air quality 3/10 Moderate 1 unhealthy d/yr today · 4 by 30 yrs out
Nearby sold comps map
Loading sold comps map…
Walkable amenities ~0.75 mi
Loading nearby amenities…
Taxation est. · year 1
- Rental income
- $23,805
- − Mortgage interest
- −$19,605
- − Property taxes
- −$6,271
- − Insurance
- −$1,750
- − Repairs & maintenance
- −$1,904
- − Management
- −$1,904
- − HOA
- −$396
- − Depreciation
- −$10,182
- Taxable loss
- −$18,208
- Est. tax savings @ 24.0%
- +$4,370
- After-tax cash flow
- $-7,266/yr
For passive investors: Depreciation is non-cash, so a rental often shows a tax loss while cash-flowing — sheltering income. Rental losses are passive: they offset passive income freely, and up to $25,000/yr can offset ordinary (W-2) income if you actively participate and your MAGI is under $100k (phasing out to $0 by $150k); unused losses carry forward. On sale, claimed depreciation is recaptured at up to 25%, and gains may owe capital-gains tax (a 1031 exchange can defer both). Figures are a year-1 estimate at your 24.0% rate — not tax advice; consult a CPA.
Schools (NCES district)
- District
- Pleasant Valley SD
- NCES district ID
- 4219290
- Math proficiency
- 31% ▼ -19.00%
- Reading proficiency
- 53% ▼ -15.00%
- Median HH income
- $61,593
- Composite
- 37.18/100
- National rank
- #4476
- State rank
- #297 of 539 in PA
Livability — Indian Mountain Lake
- Score
- 62/100
- State rank
- #1349
- US rank
- #16713
Category grades
Schools grade is shown separately in the Schools card above.
Census & demographics
- Population (ZIP)
- 9,884
Population outlook (Monroe County) Hauer SSP2
- Today (2025)
- 164,099 people
- By 2030
- 161,412 · -1.6%
- By 2040
- 154,616 · -5.8%
- By 2050
- 146,710 · -10.6%
- By 2075
- 140,830 · -14.2%
- By 2100
- 138,472 · -15.6%
Race, ethnicity, and origin ACS 2023
- Neighborhood character
- Predominantly White (81%)
- Race & ethnicity
- White 81% Hispanic / Latino 11% Two or more races 10% Black 2%
- Hispanic origin (detail)
- Mexican 6% Puerto Rican 2%
- Common ancestry
- Romanian 6% Polish 4% Iranian 4%
- Foreign-born
- 6% · Canada
- Languages at home
- 90% English-only · Spanish 5% Other Indo-European 2% Russian/Polish/Slavic 1%
Political lean MEDSL · Monroe
- 2024 margin
- Toss-up / Even · D 49.1% · R 49.9%
- 2008→2024 swing
- -17.1pp toward R · 2008: 16.3pp · 2024: -0.8pp
- All cycles
- 2024: R+0.8 2020: D+6.4 2016: D+0.3 2012: D+14.0 2008: D+16.3
Not yet ingested
- Civics
- —
Market trends
- HPI YoY
- ▲ 6.25%
- Current HPI
- 188.6013
- Rent YoY
- —
- Metro
- —
- State GDP YoY
- ▲ 1.68%
- F500 in state
- 34
Industry mix (Fortune 500 HQ in PA)
| Industry | F500 HQs | Revenue |
|---|---|---|
| Healthcare | 2 | $309B |
|
||
| Insurance | 2 | $27B |
|
||
| Telecommunications / Media | 1 | $124B |
|
||
| Industrial Distribution | 1 | $22B |
|
||
| Financial Services | 1 | $20B |
|
||
| Chemicals / Materials | 1 | $18B |
|
||
Price history
+89.2% since first listed13 events — show timeline
- 2026-06-15 Listing Removed — GLVRMLS
- 2026-06-15 Listed $350,000 GLVRMLS
- 2026-06-14 Listed $350,000 GLVRMLS
- 2026-05-17 Pending — GLVRMLS
- 2026-05-16 Listing Removed — GLVRMLS
- 2026-04-23 Listed $359,000 GLVRMLS
- 2025-06-12 Listing Removed — GLVRMLS
- 2025-05-27 Price Changed $350,000 GLVRMLS
- 2025-05-09 Listed $400,000 GLVRMLS
- 2021-10-22 Sold (Public Records) $270,000 Public Records
- 2021-10-13 Sold (MLS) $270,000 GLVRMLS
- 2021-08-19 Listed $250,000 GLVRMLS
- 2007-07-12 Sold (Public Records) $185,000 Public Records
Property tax history
+3.1%/yrLatest (2026): $6,271 · +1.6% YoY. Source: county tax records.
Cash-flow waterfall
monthlySold comps — $/sqft
last 12 mo · ≤1 miLoading sold comps…