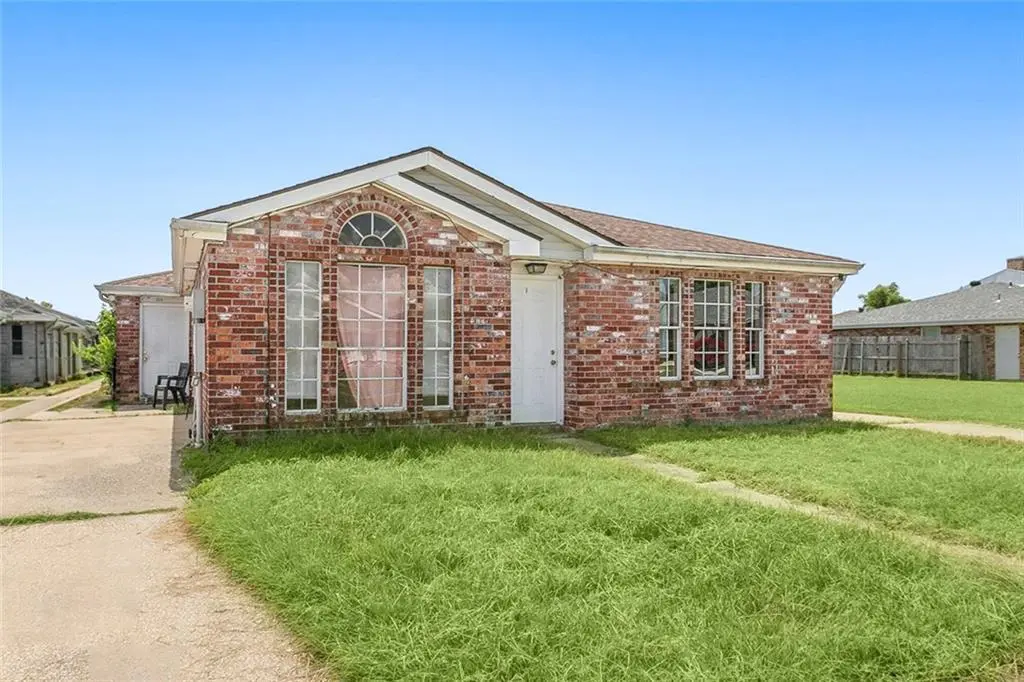
 Duplex
9100 02 Titans Dr · Chalmette, LA
Flood risk 8/10 · Major
- FEMA flood zone
- X (shaded)
- Chance of flooding over 30 yrs
- 0.6%
- Est. flood insurance / yr
- $507 – $1,088
Fire risk 1/10 · Minimal
- Est. fire insurance / yr
- $1,269 – $2,357
Heat risk 10/10 · Severe
- Hot days now (above 108°F)
- 7 days/yr
- Hot days in 30 yrs
- 22 days/yr
Wind risk 10/10 · Severe
- Chance of severe wind over 30 yrs
- 99.0%
Air-quality risk 3/10 · Minor
- Unhealthy air days now
- 3 days/yr
- Unhealthy air days in 30 yrs
- 3 days/yr
Risk factors via First Street. Map © Google.
Why this score? — see what drove the C grade
The composite is a weighted blend of 9 inputs, each scored 0–100. Each bar is that input's sub-score; the figure is the points it added to the 100-point composite (weight × sub-score).
- Cash flow +25.9/30.0
- DSCR +8.7/10.0
- 1% rule +6.5/10.0
- Schools +5.0/10.0
- ARV discount +4.1/15.0
- Rent growth +3.3/5.0
- Livability +3.2/5.0
- Condition / age +2.5/5.0
- Appreciation +0.0/10.0
$249,900
🖨 Deal sheet 📄 Offer letter ✓ Due diligence
Multi-family units
County records classify this as Multi-Family (2-4 Unit). Listing-text estimate: 2 units. confirmed
Listing remarks MLS
This great income-producing duplex is located in a non-flood zone and fully rented, offering both peace of mind and excellent investment potential. Each unit features 2 spacious bedrooms and 1 bath, with durable hard surface flooring throughout for easy maintenance and appeal. Whether you're looking to expand your rental portfolio, start fresh with a smart investment, or those looking to live in one unit and rent out the other, this property is a perfect choice with its attractive layout and prime location.
Key facts
- 5,000 sq ft lot
- Parking
- Built 1996
Neighborhood map
What this means for you Summary
Snapshot
- This is a 2 × 2-bed/1.0-bath units multifamily listed at $250k.
Deal economics
- At list price, monthly cash flow is $547 ($7k/yr) — positive. Per door: $273/mo.
- The deal already cash-flows at list — no discount required.
- Meets the 1% rule at list price ($3k rent vs $250k).
- Recommended offer: $235k (6.0% below list) — sets the bar for market timing.
- Cap rate 9.2% vs local median 5.5% in Chalmette — top-decile yield for the area; either an underpriced asset or a hidden risk that comps aren't pricing in. Stress-test before assuming the spread holds.
Location & tenants
- Location reads 65/100 on livability (#137 in LA) — a middle-class / working-renter tenant base. Strengths: cost of living A+, housing A+, health & safety A; Watch: crime F, amenities F, commute F.
- Market conditions: Rents rising (+3.1%/yr); 209 active listings in the ZIP; 22 comparable units currently listed for rent nearby; rentals at typical pace (median 16d on market — plan ~3-4 weeks tenant-placement turnaround); 112 units permitted in St. Bernard Parish in 2024 (0 in 5+ unit buildings).
- At $2,874/mo this rent would consume 63% of the median local household income ($55k/yr) (locally 881% of renters already pay >50% of income on rent) — very limited rent-growth headroom before tenants either downsize or default.
Forward outlook
- Local home prices are declining (-3.0%/yr); year-one equity from $2k of loan paydown is wiped out by about $7k of value loss. Plan a longer hold.
- St. Bernard County population projected at +89% by 2050 — long-run rental-demand tailwind backs the buy-and-hold thesis.
Negotiation context
- It's been on market 83 days — a 6% lower offer ($235k) is reasonable based on typical stale-listing flexibility.
- 15 sale attempts since 13y ago with the ask held roughly flat each time — persistent listings suggest the price (not the market) is what's stuck; bring a comps-based counter.
Risks & watch-outs
- Watch-outs: flood insurance adds $66/mo.
- Climate carrying-cost: severe flood risk; severe wind risk, 99% chance of damaging wind over 30y; extreme-heat days projected 7→22/yr by 2055 (HVAC capex compounding) — expect insurance premiums to compound above CPI over the hold.
Questions for the listing agent
- It's been on market 83 days. Have you received any prior offers? Is the seller open to a 6% concession, seller financing, or rate buy-down credit?
- Can we see the unit-by-unit rent roll, current vacancy, and any below-market leases? What's the average tenancy length?
- What capital expenditures (roof, boiler, parking lot, exteriors) have been made in the last 5 years, and what's planned in the next 2?
- What's the actual annual flood-insurance premium (NFIP or private), and is the property in a SFHA with mandatory coverage?
- Why hasn't it sold? Are there any deal-killer items the seller is aware of (foundation, flood, title, zoning, code violations)?
- Is there a deadline driving the sale (1031 exchange, divorce, estate, relocation)? That informs how much negotiation room exists.
- Crime grade is F in this area — have there been break-ins, vandalism, or insurance claims at this property in the last 3 years? What carrier currently insures it and at what premium?
- What's the average days-on-market for RENTAL listings here right now (not sales)? A rising rental-DOM trend means longer vacancies and softer asking-rent achievability than the comps imply.
- What's the recent tenant-quality profile in this submarket — average credit score on applications, eviction rate, late-payment / NSF rate, and stable-employment percentage? A property-management company in the area should have these aggregated.
- How much new apartment / multifamily construction is in the pipeline within 1–3 miles? Heavy new supply (>2% of stock underway) typically softens rents 12–24 months out; light construction supports rent growth.
Investment metrics
- 1% rule
- 1.15% ✓
- Cap rate
- 9.24%
- Cash-on-cash
- 10.52%
- DSCR
- 1.47
- GRM
- 7.2
CMA / ARV
- ARV (median comp)
- $232,185
- List price
- $249,900
- Delta
- 7.63%
- Verdict
- FAIR
- Comps
- 20 within 1.0 mi
Show comp detail 7 sales within ~0.75 mi
| Address | Dist | Beds/Ba | Sqft | Sold | Price | $/sf | Match |
|---|---|---|---|---|---|---|---|
| 3817 19 Juno Dr | 0.12mi | 4/2.0 | 1,700 (0%) | 14mo | $255,000 | $150 | 83 |
| 9101-9103 Atreus St | 0.08mi | 4/4.0 | 1,700 (0%) | 11mo | $243,500 | $143 | 79 |
| 4017-19 Jupiter Dr | 0.07mi | 4/2.0 | 1,804 (+6%) | 11mo | $207,000 | $115 | 78 |
| 9100-9102 Atreus St | 0.05mi | 4/2.0 | 1,668 (-2%) | 24mo | $215,000 | $129 | 75 |
| 74-76 Phillip Ct | 0.44mi | 4/2.0 | 1,920 (+13%) | 1mo | $240,000 | $125 | 57 |
| 422 24 W Genie St | 0.46mi | 4/2.0 | 1,543 (-9%) | 22mo | $223,300 | $145 | 45 |
| 8512 14 Valor Dr | 0.60mi | 4/2.0 | 1,933 (+14%) | 11mo | $250,000 | $129 | 40 |
Match score weights: distance 35% · size 25% · config 20% · recency 20%. Top-matched comps best support the ARV.
Projected returns pro-forma
-3.0% appreciation · 3.11% rent growth · sell at horizon
- IRR
- -2.0%
- Equity multiple
- 0.92×
- Total profit
- $-5,297
- Equity at exit
- $37,261
- IRR
- 7.8%
- Equity multiple
- 1.60×
- Total profit
- $41,723
- Equity at exit
- $21,607
Cash invested: $69,972 (down + closing). Projections, not guarantees.
Landlord ↔ Tenant lean methodology
- Overall (STATE)
- 90 Strongly Landlord-Friendly
- State Louisiana
- 90 Strongly Landlord-Friendly · R+12
- County
- — inherits STATE
- City
- — inherits STATE
ZIP-level market 70043
- Rents YoY
- 3.1%
- Active inventory
- 209
- Price-to-rent
- 14.5×
Monthly cashflow live
- Estimated rent
- $2,874 high interval (Pro) →
- Mortgage (P&I)
- −$1,311
- Tax from tax record
- −$242 /mo · $2,909/yr
- Insurance
- −$104
- Flood insurance flood zone
- −$66 /mo · $798/yr
- HOA
- −$0
- Vacancy / Maint / Mgmt
- −$604
- Net cashflow
- $547
Break-even live
2-unit breakdown (identical units grouped — click to expand)
| Units | Beds | Baths | Est. rent |
|---|---|---|---|
| 2× units | 2 | 1 | $2,874 |
| #1 | 2 | 1 | $1,437 |
| #2 | 2 | 1 | $1,437 |
| Total (2 units) | $2,874 | ||
UW: 25.0% down · 7.5% · 30yr · 1.5% tax · 5.0% vac · 8.0% maint · 8.0% mgmt
Financing live
Cash to close
- Down payment
- $62,475
- Closing costs
- $7,497
- Reserves months
- —
- Total cash needed
- —
Loan-product check · same deal, 3 products live
Conventional
25% down · 7.5% · 30yr
- Down + closing
- —
- Monthly P&I
- —
- Monthly cashflow
- —
- DSCR
- —
- Eligible?
- —
Personal DTI + credit; lowest rate.
DSCR
20% down · 8.5% · 30yr
- Down + closing
- —
- Monthly P&I
- —
- Monthly cashflow
- —
- DSCR
- —
- Eligible?
- —
No personal income docs; deal must DSCR.
Hard money
10% down · 12.0% · 12mo
- Down + closing
- —
- Monthly P&I
- —
- Monthly cashflow
- —
- DSCR
- —
- Eligible?
- —
Short-term bridge; refi at stabilization.
Rent comps 22 comps
| Address | Beds | Baths | Sqft | Rent | $/sqft | DOM | Units | Dist |
|---|---|---|---|---|---|---|---|---|
| 9101 Virtue St Unit 9101 Chalmette, LA | 3.0 | 2.0 | 1100 | $1,690 | $1.54 | 3d | 1 | 0.11mi |
| 3606 Pakenham Dr Unit 3606 Chalmette, LA | 3.0 | 2.0 | 1400 | $1,800 | $1.29 | 12d | 1 | 0.32mi |
| 3617 Park Blvd Chalmette, LA | 3.0 | 2.0 | 1090 | $1,850 | $1.70 | 44d | 1 | 0.35mi |
| 3617 Park Blvd Chalmette, LA | 3.0 | 2.0 | 1090 | $1,850 | $1.70 | 20d | 1 | 0.35mi |
| 8600 Patricia St Chalmette, LA | 3.0 | 2.0 | 1255 | $1,550 | $1.24 | 23d | 1 | 0.41mi |
| 8413 Benjamin Dr Chalmette, LA | 3.0 | 2.0 | 1800 | $2,300 | $1.28 | 3d | 1 | 0.46mi |
| 3507 Sinclair St Chalmette, LA | 3.0 | 2.0 | 1186 | $1,800 | $1.52 | 10d | 1 | 0.49mi |
| 3400 Montesquieu St Unit 1-B Chalmette, LA | 3.0 | 2.5 | 1372 | $2,550 | $1.86 | 1d | 1 | 0.75mi |
| 3711 Tournefort St Chalmette, LA | 3.0 | 2.0 | 1250 | $1,850 | $1.48 | 3d | 1 | 0.78mi |
| 511 E Genie St Chalmette, LA | 3.0 | 2.0 | 1100 | $1,500 | $1.36 | 2d | 1 | 0.96mi |
| 2707 Jackson Blvd Chalmette, LA | 3.0 | 3.0 | 1733 | $2,300 | $1.33 | 44d | 1 | 0.97mi |
| 2707 Jackson Blvd Chalmette, LA | 3.0 | 2.5 | 1733 | $2,300 | $1.33 | 23d | 1 | 0.97mi |
| 3108 Tournefort St Chalmette, LA | 3.0 | 2.0 | 1399 | $1,750 | $1.25 | 3d | 1 | 0.98mi |
| 3108 Laplace St Chalmette, LA | 3.0 | 2.5 | 1390 | $1,650 | $1.19 | 44d | 1 | 1.02mi |
| 3106 Laplace St Chalmette, LA | 3.0 | 2.5 | 1390 | $1,650 | $1.19 | 44d | 1 | 1.04mi |
| 3321 Plaza Dr Chalmette, LA | 3.0 | 2.0 | 1400 | $1,650 | $1.18 | 10d | 1 | 1.24mi |
| 32 Old Hickory St Chalmette, LA | 4.0 | 2.0 | 1379 | $1,850 | $1.34 | 23d | 1 | 1.25mi |
| 3708 Veronica Dr Chalmette, LA | 3.0 | 2.0 | 1818 | $2,550 | $1.40 | 1d | 1 | 1.26mi |
| 114 8th St Chalmette, LA | 3.0 | 1.0 | 1275 | $1,695 | $1.33 | 44d | 1 | 1.28mi |
| 424 Chinchilla Dr Arabi, LA | 3.0 | 2.0 | 1735 | $3,500 | $2.02 | 16d | 1 | 1.36mi |
| 2518 Delambert St Chalmette, LA | 3.0 | 2.0 | 1617 | $1,825 | $1.13 | 44d | 1 | 1.38mi |
| 309 Fawn Dr Arabi, LA | 3.0 | 2.5 | 1745 | $2,500 | $1.43 | 1d | 1 | 1.48mi |
Listing history 37 events
-
2026-06-18days on market $249,900 Active 83 DOM
-
2026-06-17days on market $249,900 Active 82 DOM
-
2026-06-16days on market $249,900 Active 81 DOM
-
2026-06-15days on market $249,900 Active 80 DOM
-
2026-06-13days on market $249,900 Active 78 DOM
-
2026-06-10days on market $249,900 Active 75 DOM
-
2026-06-09days on market $249,900 Active 74 DOM
-
2026-06-08days on market $249,900 Active 73 DOM
-
2026-06-07days on market $249,900 Active 72 DOM
-
2026-06-03days on market $249,900 Active 68 DOM
-
2026-06-02days on market $249,900 Active 67 DOM
-
2026-06-01days on market $249,900 Active 66 DOM
-
2026-05-31days on market $249,900 Active 65 DOM
-
2026-03-27$249,900 Active 512-char remark
Show marketing remark (512 chars)
This great income-producing duplex is located in a non-flood zone and fully rented, offering both peace of mind and excellent investment potential. Each unit features 2 spacious bedrooms and 1 bath, with durable hard surface flooring throughout for easy maintenance and appeal. Whether you're looking to expand your rental portfolio, start fresh with a smart investment, or those looking to live in one unit and rent out the other, this property is a perfect choice with its attractive layout and prime location.
-
2025-12-05price $249,900
-
2025-12-05price $249,900
-
2025-09-23$255,000 Active
-
2025-03-10$259,900 Active
-
2024-09-09$259,900 Active
-
2024-07-10historical $1,250
-
2024-06-19$1,250
-
2022-04-04soldstatus $225,000
-
2022-03-31soldstatus $225,000 Closed
-
2022-02-21status Pending
-
2022-02-09$229,900
-
2022-02-09$229,900 Active
-
2018-04-20soldstatus $100,000
-
2017-11-26$119,900
-
2014-09-27$112,000
-
2014-09-27$112,000
-
2013-12-12$112,000
-
2013-12-12$112,000
-
2013-03-12$116,000
-
2013-03-12$116,000
-
2007-10-05soldstatus $40,000
-
2003-10-13soldstatus $126,500
ⓘ Source: listings_history table (triggers on properties + properties_extension) + one-shot
backfill from property_details.listing_events for pre-trigger history.
Tax reassessment forecast LA · Resets to sale price
- Current annual tax
- $2,909 · $242/mo
- Projected year-2 tax
- $2,909 · $242/mo
- Expected delta
- $0/yr ($0/mo · 0.0%)
ⓘ Screening estimate from a state-policy table — verify with the county assessor before closing.
Climate risk First Street
- Flood 8/10 Severe FEMA zone X (shaded) · 60% chance over 30 yrs
- Wildfire 1/10 Low
- Heat 10/10 Extreme 7 d/yr ≥108°F today · 22 d/yr by 30 yrs out
- Wind 10/10 Extreme 99% chance of damaging wind over 30 yrs
- Air quality 3/10 Moderate 3 unhealthy d/yr today · 3 by 30 yrs out
Nearby sold comps map
Loading sold comps map…
Walkable amenities ~0.75 mi
Loading nearby amenities…
Taxation est. · year 1
- Rental income
- $34,488
- − Mortgage interest
- −$13,998
- − Property taxes
- −$2,909
- − Insurance
- −$2,047
- − Repairs & maintenance
- −$2,759
- − Management
- −$2,759
- − Depreciation
- −$7,270
- Taxable income
- $2,746
- Est. tax owed @ 24.0%
- −$659
- After-tax cash flow
- $5,905/yr
For passive investors: Depreciation is non-cash, so a rental often shows a tax loss while cash-flowing — sheltering income. Rental losses are passive: they offset passive income freely, and up to $25,000/yr can offset ordinary (W-2) income if you actively participate and your MAGI is under $100k (phasing out to $0 by $150k); unused losses carry forward. On sale, claimed depreciation is recaptured at up to 25%, and gains may owe capital-gains tax (a 1031 exchange can defer both). Figures are a year-1 estimate at your 24.0% rate — not tax advice; consult a CPA.
Schools (NCES district)
No district data.
Livability — Chalmette
- Score
- 65/100
- State rank
- #137
- US rank
- #12500
Category grades
Schools grade is shown separately in the Schools card above.
Census & demographics
- Census place
- Chalmette, LA
- County
- Saint Bernard Parish · 22,638 people
- City population
- 22,638
- Metro
- New Orleans-Metairie, LA
- Population (ZIP)
- 22,638
- Household income
- $55,068
- Rent vs Own
- Severe rent burden
- 881.0
Population outlook (St. Bernard County) Hauer SSP2
- Today (2025)
- 66,513 people
- By 2030
- 77,768 · +16.9%
- By 2040
- 101,296 · +52.3%
- By 2050
- 125,770 · +89.1%
- By 2075
- 188,160 · +182.9%
- By 2100
- 239,339 · +259.8%
Race, ethnicity, and origin ACS 2023
- Neighborhood character
- Diverse neighborhood (Simpson 0.61)
- Race & ethnicity
- White 55% Black 26% Hispanic / Latino 12% Two or more races 10% Asian 2%
- Hispanic origin (detail)
- Mexican 2%
- Common ancestry
- Lithuanian 13% Slovak 2%
- Foreign-born
- 6% · Canada, Vietnam
- Languages at home
- 88% English-only · Spanish 8% Arabic 1% Vietnamese 1%
Political lean MEDSL · St. Bernard
- 2024 margin
- Strong R (+29.3) · D 34.5% · R 63.8% · Other 1.7%
- 2008→2024 swing
- +16.1pp toward D · 2008: -45.4pp · 2024: -29.3pp
- All cycles
- 2024: R+29.3 2020: R+28.5 2016: R+33.4 2012: R+24.7 2008: R+45.4
Not yet ingested
- Civics
- —
Market trends
- HPI YoY
- ▼ -211.77%
- Current HPI
- 194.8123
- Rent YoY
- ▲ 3.11%
- Metro
- New Orleans-Metairie, LA
- State GDP YoY
- ▲ 3.29%
- F500 in state
- 10
Industry mix (Fortune 500 HQ in LA)
| Industry | F500 HQs | Revenue |
|---|---|---|
| Telecommunications | 2 | $23B |
|
||
| Utilities | 1 | $12B |
|
||
| Wholesale / Distribution | 1 | $5B |
|
||
| Advertising | 1 | $2B |
|
||
Price history
+97.5% since first listed24 events — show timeline
- 2026-03-27 Listed $249,900 GSREIN
- 2026-03-27 Listed $249,900 AcadianaMLS
- 2025-12-05 Price Changed $249,900 AcadianaMLS
- 2025-12-05 Price Changed $249,900 GSREIN
- 2025-09-23 Listed $255,000 AcadianaMLS
- 2025-03-10 Listed $259,900 AcadianaMLS
- 2024-09-09 Listed $259,900 AcadianaMLS
- 2024-07-10 Rental Removed $1,250 GSMLSLA
- 2024-06-19 Listed for Rent $1,250 GSMLSLA
- 2022-04-04 Sold (Public Records) $225,000 Public Records
- 2022-03-31 Sold (MLS) $225,000 GSREIN
- 2022-02-21 Pending — GSREIN
- 2022-02-09 Listed $229,900 GSREIN
- 2022-02-09 Listed $229,900 AcadianaMLS
- 2018-04-20 Sold (Public Records) $100,000 Public Records
- 2017-11-26 Listed $119,900 AcadianaMLS
- 2014-09-27 Listed $112,000 GSREIN
- 2014-09-27 Listed $112,000 AcadianaMLS
- 2013-12-12 Listed $112,000 GSREIN
- 2013-12-12 Listed $112,000 AcadianaMLS
- 2013-03-12 Listed $116,000 GSREIN
- 2013-03-12 Listed $116,000 AcadianaMLS
- 2007-10-05 Sold (Public Records) $40,000 Public Records
- 2003-10-13 Sold (Public Records) $126,500 Public Records
Property tax history
+6.5%/yrLatest (2025): $2,909 · -0.7% YoY. Source: county tax records.
Cash-flow waterfall
monthlySold comps — $/sqft
last 12 mo · ≤1 miLoading sold comps…