None · Paradise, NV
Flood risk 1/10 · Minimal
- FEMA flood zone
- X (unshaded)
- Chance of flooding over 30 yrs
- 0.0%
- Est. flood insurance / yr
- $507 – $1,088
Fire risk 1/10 · Minimal
- Est. fire insurance / yr
- $490 – $910
Heat risk 8/10 · Major
- Hot days now (above 108°F)
- 7 days/yr
- Hot days in 30 yrs
- 18 days/yr
Wind risk 1/10 · Minimal
- Chance of severe wind over 30 yrs
- —
Air-quality risk 3/10 · Minor
- Unhealthy air days now
- 3 days/yr
- Unhealthy air days in 30 yrs
- 4 days/yr
Risk factors via First Street. Map © Google.
Why this score? — see what drove the D grade
The composite is a weighted blend of 9 inputs, each scored 0–100. Each bar is that input's sub-score; the figure is the points it added to the 100-point composite (weight × sub-score).
- Cash flow +14.9/30.0
- ARV discount +7.5/15.0
- DSCR +4.6/10.0
- Livability +3.8/5.0
- 1% rule +3.1/10.0
- Schools +2.6/10.0
- Rent growth +2.5/5.0
- Condition / age +2.5/5.0
- Appreciation +0.0/10.0
$299,999
🖨 Deal sheet (PDF) 📄 Offer letter ✓ Due diligence
Listing remarks MLS
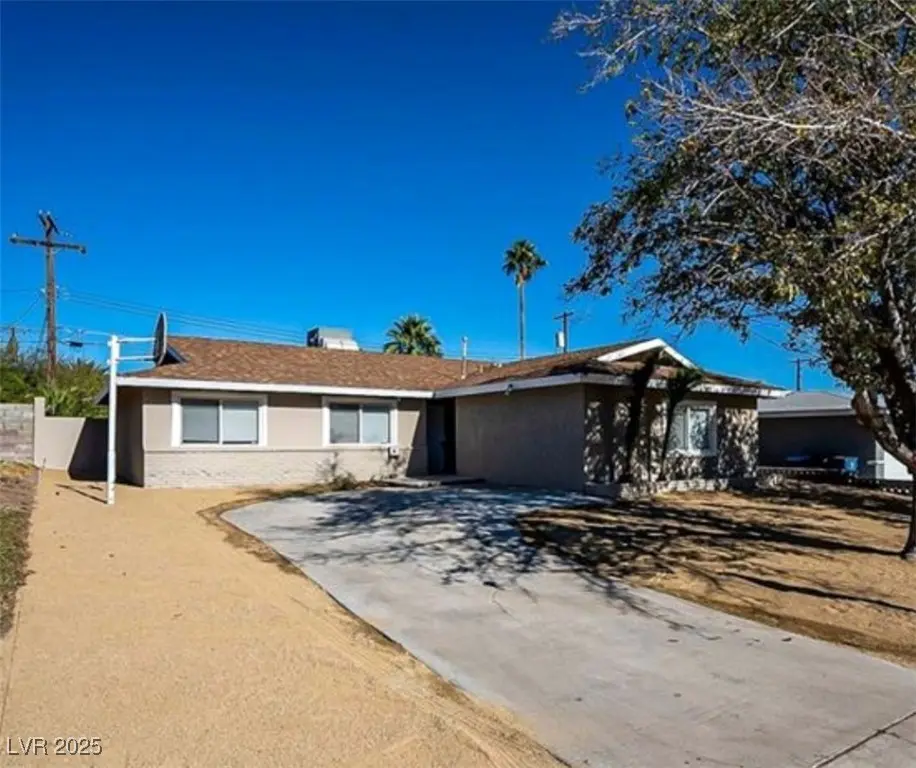
FULLY RENOVATED SINGLE STORY HOUSE WITH A STUDIO WITH SEPARATE ENTRANCE!!!, TOTAL BEDROOMS IS 4 AND 3 FULL BATHROOMS, QUARTZ COUNTERTOP ON KITCHEN AND BATHROOMS, LAMINATED FLOORING THROUGHOUT THE HOUSE, CEILING FANS IN ALL BEDROOMS, FRESH PAINT INTERIOR AND EXTERIOR, NEW KITCHEN CABINETS, ISLAND MOUNT RANGE HOOD AND MICROWAVE WILL BE INSTALLED BEFORE CLOSING, LARGE BACK YARD WITH COVER PATIO AND POOL, CLOSE TO SHOPPING CENTER AND 95 FREEWAY.
Key facts
- Kitchenette
- Large lot
- Remodeled in 2021
Tags
Neighborhood map
What this means for you Summary
Snapshot
- This is a 3-bed/2.0-bath single-family listed at $300k.
Deal economics
- At list price, monthly cash flow is $87 ($1k/yr) — positive.
- The deal already cash-flows at list — no discount required.
- To meet the 1% rule (rent ≥ 1% of price), the offer needs to be $242k (19.4% below list).
- Recommended offer: $242k (19.4% below list) — sets the bar for 1% rule.
Location & tenants
- Location reads 76/100 on livability (#10 in NV, #3,494 nationally) — a middle-class / working-renter tenant base. Strengths: commute A+, housing A-, cost of living B; Watch: employment D+, crime D-.
- Clark County School District (urban): math 21% / reading 39% proficiency, ranked #11 of 17 in NV (top 65%) — families likely to look elsewhere, expect single-tenant / working-renter base with shorter leases.
- Zoned schools: Ferron William E Es (math 17% / reading 32%, grade F, #237 of 402 statewide, top 63%, 588 students, 100% FRL); Woodbury C W Ms (math 7% / reading 27%, grade F, #87 of 109 statewide, top 82%, 784 students, 100% FRL); Chaparral Hs (math 3% / reading 15%, grade F, #128 of 131 statewide, top 98%, 2,256 students, 100% FRL) — zoned schools average 100% FRL vs 52% district-wide (48 pts higher); higher-poverty schools than district average — tighter screening recommended.
- Zoned-school proficiency averages 17% at this address vs 30% district-wide (-13 pts) — the specific schools serving this property underperform the Clark County School District average; the district grade overstates school quality for this exact location.
- Market conditions: Rents soft (-0.1%/yr); 413 active listings in the ZIP; 27 comparable units currently listed for rent nearby; rentals at typical pace (median 25d on market — plan ~3-4 weeks tenant-placement turnaround); 41% of comp listings sitting > 30 days — soft ceiling on asking rent; 14,754 units permitted in Clark County in 2024 (2,301 in 5+ unit buildings).
- At $2,417/mo this rent would consume 52% of the median local household income ($56k/yr) (locally 4080% of renters already pay >50% of income on rent) — very limited rent-growth headroom before tenants either downsize or default.
Forward outlook
- Local home prices are declining (-3.0%/yr); year-one equity from $2k of loan paydown is wiped out by about $9k of value loss. Plan a longer hold.
- Clark County population projected at +36% by 2050 — long-run rental-demand tailwind backs the buy-and-hold thesis.
Negotiation context
- It's been on market 17 days — a 2% lower offer ($295k) is reasonable based on typical stale-listing flexibility.
- 7 sale attempts since 16y ago with the ask held roughly flat each time — persistent listings suggest the price (not the market) is what's stuck; bring a comps-based counter.
Risks & watch-outs
- Climate carrying-cost: extreme-heat days projected 7→18/yr by 2055 (HVAC capex compounding) — expect insurance premiums to compound above CPI over the hold.
Questions for the listing agent
- Built in 1966 — when were the roof, HVAC, electrical panel, plumbing, and water heater last replaced?
- Is there a deadline driving the sale (1031 exchange, divorce, estate, relocation)? That informs how much negotiation room exists.
- Schools are F-rated, which usually means shorter tenancies and higher turnover. Who's the typical renter profile here, and what's been the actual vacancy rate?
- Crime grade is D in this area — have there been break-ins, vandalism, or insurance claims at this property in the last 3 years? What carrier currently insures it and at what premium?
- The area grade is low — what's the realistic commute time and amenity access for the typical tenant pool here? Any planned neighborhood developments (good or bad) we should know about?
- What's the average days-on-market for RENTAL listings here right now (not sales)? A rising rental-DOM trend means longer vacancies and softer asking-rent achievability than the comps imply.
- What's the recent tenant-quality profile in this submarket — average credit score on applications, eviction rate, late-payment / NSF rate, and stable-employment percentage? A property-management company in the area should have these aggregated.
- How much new for-sale + rental construction is in the pipeline within 1–3 miles? Heavy new supply typically softens prices + rents 12–24 months out; constrained supply supports both.
Investment metrics
- 1% rule
- 0.81% ✗
- Cap rate
- 6.64%
- Cash-on-cash
- 1.25%
- DSCR
- 1.06
- GRM
- 10.3
CMA / ARV
No comps found within radius.
Projected returns pro-forma
-3.0% appreciation · 0.0% rent growth · sell at horizon
- IRR
- -17.4%
- Equity multiple
- 0.40×
- Total profit
- $-50,256
- Equity at exit
- $44,731
- IRR
- -15.4%
- Equity multiple
- 0.23×
- Total profit
- $-64,458
- Equity at exit
- $25,938
Cash invested: $84,000 (down + closing). Projections, not guarantees.
Landlord ↔ Tenant lean methodology
- Overall (STATE)
- 71 Landlord-Friendly
- State Nevada
- 71 Landlord-Friendly · R+1
- County
- — inherits STATE
- City
- — inherits STATE
ZIP-level market 89121
- Rents YoY
- -0.1%
- Active inventory
- 413
- Price-to-rent
- 10.3×
Monthly cashflow live
- Estimated rent
- $2,417 high interval (Pro) →
- Mortgage (P&I)
- −$1,573
- Tax from tax record
- −$124 /mo · $1,487/yr
- Insurance
- −$125
- HOA
- −$0
- Vacancy / Maint / Mgmt
- −$508
- Net cashflow
- $87
Break-even live
Sensitivity live
| Price | -10% $257 | -5% $172 | +0% $87 | +5% $2 | +10% $-83 |
|---|---|---|---|---|---|
| Rent | -10% $-104 | -5% $-8 | +0% $87 | +5% $183 | +10% $278 |
| Rate | -1.0pp $238 | -0.5pp $164 | base $87 | +0.5pp $10 | +1.0pp $-70 |
UW: 25.0% down · 7.5% · 30yr · 1.5% tax · 5.0% vac · 8.0% maint · 8.0% mgmt
Financing live
Cash to close
- Down payment
- $75,000
- Closing costs
- $9,000
- Reserves months
- —
- Total cash needed
- —
Loan-product check · same deal, 3 products live
Conventional
25% down · 7.5% · 30yr
- Down + closing
- —
- Monthly P&I
- —
- Monthly cashflow
- —
- DSCR
- —
- Eligible?
- —
Personal DTI + credit; lowest rate.
DSCR
20% down · 8.5% · 30yr
- Down + closing
- —
- Monthly P&I
- —
- Monthly cashflow
- —
- DSCR
- —
- Eligible?
- —
No personal income docs; deal must DSCR.
Hard money
10% down · 12.0% · 12mo
- Down + closing
- —
- Monthly P&I
- —
- Monthly cashflow
- —
- DSCR
- —
- Eligible?
- —
Short-term bridge; refi at stabilization.
Rent comps 27 comps
| Address | Beds | Baths | Sqft | Rent | $/sqft | DOM | Units | Dist |
|---|---|---|---|---|---|---|---|---|
| 4516 Charles Ronald Ave Las Vegas, NV | 3.0 | 2.0 | 1613 | $3,800 | $2.36 | 45d | 1 | 0.02mi |
| 3956 Clear View Dr Las Vegas, NV | 3.0 | 2.0 | 1306 | $2,600 | $1.99 | 19d | 1 | 0.14mi |
| 4264 White Sands Ave Las Vegas, NV | 4.0 | 2.0 | 1392 | $1,650 | $1.19 | 13d | 1 | 0.30mi |
| 3835 Chutney St Las Vegas, NV | 3.0 | 2.0 | 1916 | $2,100 | $1.10 | 45d | 1 | 0.44mi |
| 4386 El Carnal Way Las Vegas, NV | 4.0 | 2.0 | 1994 | $2,800 | $1.40 | 25d | 1 | 0.63mi |
| 4476 El Como Way Las Vegas, NV | 4.0 | 2.0 | 1895 | $1,995 | $1.05 | 45d | 1 | 0.72mi |
| 3800 S Nellis Blvd Las Vegas, NV | 1.0–3.0 | 1.0–2.0 | 943 | $1,635 | $1.73 | 0d | 24 | 0.75mi |
| 5051 Sitka Ln Las Vegas, NV | 3.0 | 2.0 | 1265 | $1,225 | $0.97 | 45d | 1 | 0.82mi |
| 3919 Springhill Ave Las Vegas, NV | 3.0 | 2.0 | 1756 | $2,160 | $1.23 | 16d | 1 | 0.85mi |
| 4422 Bennett Dr Las Vegas, NV | 4.0 | 2.5 | 1519 | $2,545 | $1.68 | 45d | 1 | 0.87mi |
| 3913 Oakhill Ave Las Vegas, NV | 3.0 | 2.0 | 1300 | $2,100 | $1.62 | 45d | 1 | 0.93mi |
| 5185 Sun Valley Dr Las Vegas, NV | 4.0 | 2.5 | 2408 | $2,700 | $1.12 | 45d | 1 | 1.19mi |
| 4876 Rollingwood Cir Las Vegas, NV | 3.0 | 2.5 | 1662 | $2,000 | $1.20 | 45d | 1 | 1.24mi |
| 4248 Montdale Ave Las Vegas, NV | 3.0 | 2.0 | 1988 | $2,087 | $1.05 | 22d | 1 | 1.25mi |
| 4248 Montdale Ave Las Vegas, NV | 3.0 | 2.0 | 1988 | $2,087 | $1.05 | 14d | 1 | 1.25mi |
| 4226 Rosalyn Ridge St Las Vegas, NV | 3.0 | 2.0 | 2000 | $4,800 | $2.40 | 6d | 1 | 1.25mi |
| 4549 Oakdale Ave Las Vegas, NV | 4.0 | 2.0 | 1496 | $1,800 | $1.20 | 0d | 1 | 1.28mi |
| 3463 Monte Carlo Dr Las Vegas, NV | 3.0 | 2.5 | 1840 | $1,599 | $0.87 | 45d | 1 | 1.28mi |
| 3037 Aloha Ave Las Vegas, NV | 3.0 | 2.0 | 1270 | $1,750 | $1.38 | 0d | 1 | 1.31mi |
| 3021 Aloha Ave Las Vegas, NV | 3.0 | 2.0 | 1270 | $1,800 | $1.42 | 5d | 1 | 1.33mi |
| 4717 Woodland Ave Las Vegas, NV | 3.0 | 2.5 | 1742 | $2,250 | $1.29 | 14d | 1 | 1.33mi |
| 3744 Pilgrim St Unit A Las Vegas, NV | 2.0 | 1.0 | 2025 | $1,425 | $0.70 | 0d | 1 | 1.37mi |
| 3012 S Mountain Vista St Unit B Las Vegas, NV | 2.0 | 1.0 | 2498 | $945 | $0.38 | 25d | 1 | 1.39mi |
| 3389 Narod St Las Vegas, NV | 2.0 | 2.5 | 1396 | $1,790 | $1.28 | 45d | 1 | 1.43mi |
| 4647 Dealers Choice Way #103 Las Vegas, NV | 3.0 | 2.5 | 1562 | $1,890 | $1.21 | 25d | 1 | 1.43mi |
| 3384 Matvay St Las Vegas, NV | 2.0 | 2.5 | 1396 | $1,850 | $1.33 | 9d | 1 | 1.45mi |
| 5492 Jackpot Winner Ln #103 Las Vegas, NV | 3.0 | 2.5 | 1562 | $1,800 | $1.15 | 45d | 1 | 1.46mi |
Listing history 27 events
-
2025-12-11status Pending
-
2025-12-04status Active
-
2025-06-27status Pending
-
2025-06-18$299,999 Active
-
2022-01-10soldstatus $388,000 Closed 445-char remark
Show marketing remark (445 chars)
FULLY RENOVATED SINGLE STORY HOUSE WITH A STUDIO WITH SEPARATE ENTRANCE!!!, TOTAL BEDROOMS IS 4 AND 3 FULL BATHROOMS, QUARTZ COUNTERTOP ON KITCHEN AND BATHROOMS, LAMINATED FLOORING THROUGHOUT THE HOUSE, CEILING FANS IN ALL BEDROOMS, FRESH PAINT INTERIOR AND EXTERIOR, NEW KITCHEN CABINETS, ISLAND MOUNT RANGE HOOD AND MICROWAVE WILL BE INSTALLED BEFORE CLOSING, LARGE BACK YARD WITH COVER PATIO AND POOL, CLOSE TO SHOPPING CENTER AND 95 FREEWAY.
-
2022-01-10soldstatus $388,000
Show marketing remark (445 chars)
FULLY RENOVATED SINGLE STORY HOUSE WITH A STUDIO WITH SEPARATE ENTRANCE!!!, TOTAL BEDROOMS IS 4 AND 3 FULL BATHROOMS, QUARTZ COUNTERTOP ON KITCHEN AND BATHROOMS, LAMINATED FLOORING THROUGHOUT THE HOUSE, CEILING FANS IN ALL BEDROOMS, FRESH PAINT INTERIOR AND EXTERIOR, NEW KITCHEN CABINETS, ISLAND MOUNT RANGE HOOD AND MICROWAVE WILL BE INSTALLED BEFORE CLOSING, LARGE BACK YARD WITH COVER PATIO AND POOL, CLOSE TO SHOPPING CENTER AND 95 FREEWAY.
-
2021-12-02historical Active Under Contract 445-char remark
Show marketing remark (445 chars)
FULLY RENOVATED SINGLE STORY HOUSE WITH A STUDIO WITH SEPARATE ENTRANCE!!!, TOTAL BEDROOMS IS 4 AND 3 FULL BATHROOMS, QUARTZ COUNTERTOP ON KITCHEN AND BATHROOMS, LAMINATED FLOORING THROUGHOUT THE HOUSE, CEILING FANS IN ALL BEDROOMS, FRESH PAINT INTERIOR AND EXTERIOR, NEW KITCHEN CABINETS, ISLAND MOUNT RANGE HOOD AND MICROWAVE WILL BE INSTALLED BEFORE CLOSING, LARGE BACK YARD WITH COVER PATIO AND POOL, CLOSE TO SHOPPING CENTER AND 95 FREEWAY.
-
2021-11-12$379,000 Active 445-char remark
Show marketing remark (445 chars)
FULLY RENOVATED SINGLE STORY HOUSE WITH A STUDIO WITH SEPARATE ENTRANCE!!!, TOTAL BEDROOMS IS 4 AND 3 FULL BATHROOMS, QUARTZ COUNTERTOP ON KITCHEN AND BATHROOMS, LAMINATED FLOORING THROUGHOUT THE HOUSE, CEILING FANS IN ALL BEDROOMS, FRESH PAINT INTERIOR AND EXTERIOR, NEW KITCHEN CABINETS, ISLAND MOUNT RANGE HOOD AND MICROWAVE WILL BE INSTALLED BEFORE CLOSING, LARGE BACK YARD WITH COVER PATIO AND POOL, CLOSE TO SHOPPING CENTER AND 95 FREEWAY.
-
2021-09-08soldstatus $265,000
-
2011-06-22status Pending 197-char remark
Show marketing remark (197 chars)
Property is only a block from Flamingo, near shopping, schools, etc. Home has new carpeting and new paint. No HOA!!! Swimming pool. Home has a separate room with its own entrance. Show me and sell.
-
2011-06-22soldstatus $96,000 Sold 197-char remark
Show marketing remark (197 chars)
Property is only a block from Flamingo, near shopping, schools, etc. Home has new carpeting and new paint. No HOA!!! Swimming pool. Home has a separate room with its own entrance. Show me and sell.
-
2011-06-22soldstatus $96,000
Show marketing remark (197 chars)
Property is only a block from Flamingo, near shopping, schools, etc. Home has new carpeting and new paint. No HOA!!! Swimming pool. Home has a separate room with its own entrance. Show me and sell.
-
2011-05-27historical Contingent Offer 197-char remark
Show marketing remark (197 chars)
Property is only a block from Flamingo, near shopping, schools, etc. Home has new carpeting and new paint. No HOA!!! Swimming pool. Home has a separate room with its own entrance. Show me and sell.
-
2011-05-19price $99,000 Exclusive Right 197-char remark
Show marketing remark (197 chars)
Property is only a block from Flamingo, near shopping, schools, etc. Home has new carpeting and new paint. No HOA!!! Swimming pool. Home has a separate room with its own entrance. Show me and sell.
-
2011-05-19status Exclusive Right 197-char remark
Show marketing remark (197 chars)
Property is only a block from Flamingo, near shopping, schools, etc. Home has new carpeting and new paint. No HOA!!! Swimming pool. Home has a separate room with its own entrance. Show me and sell.
-
2011-04-20historical Contingent Offer 197-char remark
Show marketing remark (197 chars)
Property is only a block from Flamingo, near shopping, schools, etc. Home has new carpeting and new paint. No HOA!!! Swimming pool. Home has a separate room with its own entrance. Show me and sell.
-
2011-03-31$109,000 Exclusive Right 197-char remark
Show marketing remark (197 chars)
Property is only a block from Flamingo, near shopping, schools, etc. Home has new carpeting and new paint. No HOA!!! Swimming pool. Home has a separate room with its own entrance. Show me and sell.
-
2011-03-29historical
-
2011-03-15price $109,000
-
2011-03-02price $114,900
-
2011-02-28price $123,450
-
2011-02-26price $123,950
-
2011-02-21price $124,500
-
2011-02-08$125,000 Exclusive Right
-
2011-01-14soldstatus $61,950 Sold
-
2010-06-02$89,800 Auction
-
1987-06-12soldstatus $69,060
ⓘ Source: listings_history table (triggers on properties + properties_extension) + one-shot
backfill from property_details.listing_events for pre-trigger history.
Tax reassessment forecast NV · Resets to sale price
- Current annual tax
- $1,487 · $124/mo
- Projected year-2 tax
- $1,770 · $147/mo
- Expected delta
- +$283/yr (+$24/mo · 19.0%)
ⓘ Screening estimate from a state-policy table — verify with the county assessor before closing.
Climate risk First Street
- Flood 1/10 Low FEMA zone X (unshaded) · 0% chance over 30 yrs
- Wildfire 1/10 Low
- Heat 8/10 Severe 7 d/yr ≥108°F today · 18 d/yr by 30 yrs out
- Wind 1/10 Low
- Air quality 3/10 Moderate 3 unhealthy d/yr today · 4 by 30 yrs out
Nearby sold comps map
Loading sold comps map…
Walkable amenities ~0.75 mi
Loading nearby amenities…
Taxation est. · year 1
- Rental income
- $29,004
- − Mortgage interest
- −$16,805
- − Property taxes
- −$1,487
- − Insurance
- −$1,500
- − Repairs & maintenance
- −$2,320
- − Management
- −$2,320
- − Depreciation
- −$8,727
- Taxable loss
- −$4,156
- Est. tax savings @ 24.0%
- +$997
- After-tax cash flow
- $2,045/yr
For passive investors: Depreciation is non-cash, so a rental often shows a tax loss while cash-flowing — sheltering income. Rental losses are passive: they offset passive income freely, and up to $25,000/yr can offset ordinary (W-2) income if you actively participate and your MAGI is under $100k (phasing out to $0 by $150k); unused losses carry forward. On sale, claimed depreciation is recaptured at up to 25%, and gains may owe capital-gains tax (a 1031 exchange can defer both). Figures are a year-1 estimate at your 24.0% rate — not tax advice; consult a CPA.
Schools (NCES district)
- District
- Clark County School District
- NCES district ID
- 3200060
- Math proficiency
- 21% ▼ -13.00%
- Reading proficiency
- 39% ▼ -8.00%
- Median HH income
- $53,611
- Composite
- 26.48/100
- National rank
- #7211
- State rank
- #11 of 17 in NV
Livability — Paradise
- Score
- 76/100
- State rank
- #10
- US rank
- #3494
Category grades
Schools grade is shown separately in the Schools card above.
Census & demographics
- Census place
- Paradise, NV
- County
- Clark County · 2,306,105 people
- City population
- 227,885
- Metro
- Las Vegas-Henderson-Paradise, NV
- Population (ZIP)
- 68,406
- Household income
- $55,758
- Rent vs Own
- Severe rent burden
- 4080.0
Population outlook (Clark County) Hauer SSP2
- Today (2025)
- 2,504,101 people
- By 2030
- 2,693,770 · +7.6%
- By 2040
- 3,061,208 · +22.2%
- By 2050
- 3,400,072 · +35.8%
- By 2075
- 4,139,522 · +65.3%
- By 2100
- 4,596,916 · +83.6%
Race, ethnicity, and origin ACS 2023
- Neighborhood character
- Diverse neighborhood (Simpson 0.65)
- Race & ethnicity
- Hispanic / Latino 49% White 31% Two or more races 16% Black 11% Asian 4% Native American 1%
- Hispanic origin (detail)
- Mexican 30% Puerto Rican 1% Cuban 5%
- Common ancestry
- Lithuanian 2% Romanian 1% Slovak 1%
- Foreign-born
- 27% · Canada, Dominican Republic, Jamaica
- Languages at home
- 57% English-only · Spanish 37% Tagalog/Filipino 2% Other Asian/Pacific 1%
Political lean MEDSL · Clark
- 2024 margin
- Toss-up / Even · D 50.4% · R 47.8% · Other 1.7%
- 2008→2024 swing
- -16.5pp toward R · 2008: 19.1pp · 2024: 2.6pp
- All cycles
- 2024: D+2.6 2020: D+9.3 2016: D+10.7 2012: D+14.5 2008: D+19.1
Not yet ingested
- Civics
- —
Market trends
- HPI YoY
- ▼ -241.85%
- Current HPI
- 302.201
- Rent YoY
- ▼ -0.10%
- Metro
- Las Vegas-Henderson-Paradise, NV
- State GDP YoY
- ▲ 3.08%
- F500 in state
- 6
Industry mix (Fortune 500 HQ in NV)
| Industry | F500 HQs | Revenue |
|---|---|---|
| Hotels / Casinos | 3 | $36B |
|
||
Price history
+334.4% since first listed27 events — show timeline
- 2025-12-11 Pending — GLVAR
- 2025-12-04 Relisted — GLVAR
- 2025-06-27 Pending — GLVAR
- 2025-06-18 Listed $299,999 GLVAR
- 2022-01-10 Sold (Public Records) $388,000 Public Records
- 2022-01-10 Sold (MLS) $388,000 GLVAR
- 2021-12-02 Contingent — GLVAR
- 2021-11-12 Listed $379,000 GLVAR
- 2021-09-08 Sold (Public Records) $265,000 Public Records
- 2011-06-22 Pending — GLVAR
- 2011-06-22 Sold (Public Records) $96,000 Public Records
- 2011-06-22 Sold (MLS) $96,000 GLVAR
- 2011-05-27 Contingent — GLVAR
- 2011-05-19 Relisted — GLVAR
- 2011-05-19 Price Changed $99,000 GLVAR
- 2011-04-20 Contingent — GLVAR
- 2011-03-31 Listed $109,000 GLVAR
- 2011-03-29 Listing Removed — GLVAR
- 2011-03-15 Price Changed $109,000 GLVAR
- 2011-03-02 Price Changed $114,900 GLVAR
- 2011-02-28 Price Changed $123,450 GLVAR
- 2011-02-26 Price Changed $123,950 GLVAR
- 2011-02-21 Price Changed $124,500 GLVAR
- 2011-02-08 Listed $125,000 GLVAR
- 2011-01-14 Sold (MLS) $61,950 GLVAR
- 2010-06-02 Listed $89,800 GLVAR
- 1987-06-12 Sold (Public Records) $69,060 Public Records
Property tax history
+0.8%/yrLatest (2025): $1,487 · +7.8% YoY. Source: county tax records.
Cash-flow waterfall
monthlySold comps — $/sqft
last 12 mo · ≤1 miLoading sold comps…