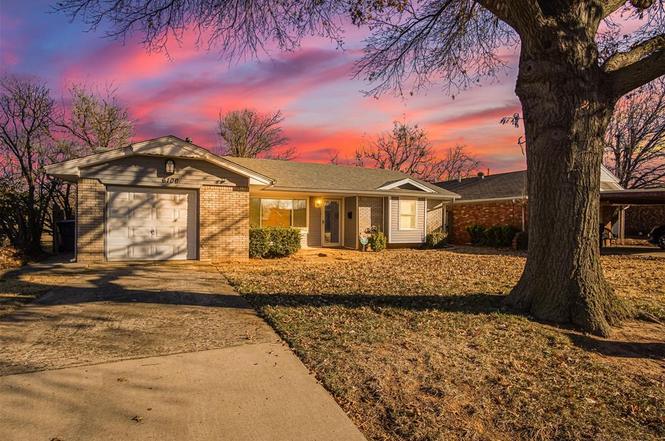
6106 S Hillcrest Dr · Oklahoma City, OK
Flood risk 1/10 · Minimal
- FEMA flood zone
- X (unshaded)
- Chance of flooding over 30 yrs
- 0.0%
- Est. flood insurance / yr
- $507 – $1,088
Fire risk 2/10 · Minimal
- Est. fire insurance / yr
- $2,463 – $4,575
Heat risk 6/10 · Moderate
- Hot days now (above 107°F)
- 7 days/yr
- Hot days in 30 yrs
- 19 days/yr
Wind risk 2/10 · Minimal
- Chance of severe wind over 30 yrs
- 4.0%
Air-quality risk 1/10 · Minimal
- Unhealthy air days now
- 0 days/yr
- Unhealthy air days in 30 yrs
- 0 days/yr
Risk factors via First Street. Map © Google.
Why this score? — see what drove the C- grade
The composite is a weighted blend of 9 inputs, each scored 0–100. Each bar is that input's sub-score; the figure is the points it added to the 100-point composite (weight × sub-score).
- Cash flow +20.1/30.0
- ARV discount +12.1/15.0
- DSCR +6.4/10.0
- 1% rule +4.6/10.0
- Livability +4.0/5.0
- Rent growth +3.4/5.0
- Condition / age +2.5/5.0
- Schools +0.7/10.0
- Appreciation +0.0/10.0
$130,000
🖨 Deal sheet (PDF) 📄 Offer letter ✓ Due diligence
Listing remarks MLS
BACKS TO WILLOW CREEK GOLF COURSE!!!NICE HOME FOR INVESTOR OR 1ST TIME BUYER**POSSIBLE SETTLEMENT, MAY NEED REPAIRS**BEING SOLD 'AS IS' SELLER WILL MAKE NO REPAIRS**NO FHA/VA FINANCE**CLOSING TO BE HELD AT LAWYERS TITLE, 1113 S. DOUGLAS,MWC**
Key facts
- Updated systems
- 7,701 sq ft lot
- Garage
Tags
Property features AI
Finance
- Other: Located in Richards Country Club Estate; Not designated historic; Occupied: No; Directions: From 59th and Hillcrest, property is 1 block south on Hillcrest
- Financial info: Loan qualifying available; Not assumable
- HOA & community: No mandatory association dues
Exterior
- Parking: 1-car garage
- Utilities: Manual geocode source
- Home design: Single family residence; One-level home; Faces west; Residential property
- Construction: Brick and frame construction; Brick exterior; Composition roof; Slab foundation; Existing property
- Exterior features: Covered porch; Open patio; Golf course lot; Interior lot
Interior
- Bedrooms: 2 bedrooms
- Bathrooms: 1 full bathroom; 1 half bathroom
- Interior features: No fireplace; No in-law plan
Neighborhood map
What this means for you Summary
Snapshot
- This is a 3-bed/2.0-bath single-family listed at $130k.
Deal economics
- At list price, monthly cash flow is $161 ($2k/yr) — positive.
- The deal already cash-flows at list — no discount required.
- To meet the 1% rule (rent ≥ 1% of price), the offer needs to be $124k (4.4% below list).
- Recommended offer: $118k (9.0% below list) — sets the bar for market timing.
- Cap rate 7.8% vs local median 3.7% in Oklahoma City — top-decile yield for the area; either an underpriced asset or a hidden risk that comps aren't pricing in. Stress-test before assuming the spread holds.
Location & tenants
- Location reads 80/100 on livability (#3 in OK, #1,635 nationally) — a professional / high-income tenant draw. Strengths: amenities A+, commute A+, cost of living A+; Watch: crime F.
- Oklahoma City (urban): math 7% / reading 10% proficiency, ranked #254 of 270 in OK (top 94%) — low school quality limits family demand, transient renter base, plan for 1-2y turnover; 82% free/reduced lunch — lower-income household profile, screen leases tightly.
- Zoned schools: Hillcrest Es (math 17% / reading 17%, grade F, #540 of 845 statewide, top 68%, 516 students, 0% FRL); Jefferson Ms (math 2% / reading 5%, grade F, #330 of 345 statewide, top 96%, 919 students, 0% FRL); Capitol Hill Hs (math 2% / reading 4%, grade F, #444 of 447 statewide, top 99%, 1,455 students, 0% FRL) — zoned schools average 0% FRL vs 82% district-wide (82 pts lower); this property's tenant base skews higher-income than the district average.
- Market conditions: Rents rising (+3.5%/yr); 38 active listings in the ZIP; 40 comparable units currently listed for rent nearby; rentals at typical pace (median 26d on market — plan ~3-4 weeks tenant-placement turnaround); 5,365 units permitted in Oklahoma County in 2024 (569 in 5+ unit buildings).
Forward outlook
- Local home prices are declining (-3.0%/yr); year-one equity from $899 of loan paydown is wiped out by about $4k of value loss. Plan a longer hold.
- Oklahoma County population projected at +41% by 2050 — long-run rental-demand tailwind backs the buy-and-hold thesis.
Negotiation context
- It's been on market 91 days — a 9% lower offer ($118k) is reasonable based on typical stale-listing flexibility.
- 8 sale attempts since 26y ago; this cycle's ask has dropped $25k (16%) from the opening price — seller is motivated, your offer sets the floor, not the list.
- Current owner paid $55k; list at $130k implies a 136% gain — meaningful room to come down on a strong offer.
Risks & watch-outs
- Watch-outs: built in 1955 — expect roof / HVAC / electrical / plumbing capex.
- Climate carrying-cost: extreme-heat days projected 7→19/yr by 2055 (HVAC capex compounding) — expect insurance premiums to compound above CPI over the hold.
Questions for the listing agent
- It's been on market 91 days. Have you received any prior offers? Is the seller open to a 9% concession, seller financing, or rate buy-down credit?
- Built in 1955 — when were the roof, HVAC, electrical panel, plumbing, and water heater last replaced?
- Why hasn't it sold? Are there any deal-killer items the seller is aware of (foundation, flood, title, zoning, code violations)?
- Is there a deadline driving the sale (1031 exchange, divorce, estate, relocation)? That informs how much negotiation room exists.
- Schools are F-rated, which usually means shorter tenancies and higher turnover. Who's the typical renter profile here, and what's been the actual vacancy rate?
- Crime grade is F in this area — have there been break-ins, vandalism, or insurance claims at this property in the last 3 years? What carrier currently insures it and at what premium?
- What's the average days-on-market for RENTAL listings here right now (not sales)? A rising rental-DOM trend means longer vacancies and softer asking-rent achievability than the comps imply.
- What's the recent tenant-quality profile in this submarket — average credit score on applications, eviction rate, late-payment / NSF rate, and stable-employment percentage? A property-management company in the area should have these aggregated.
- How much new for-sale + rental construction is in the pipeline within 1–3 miles? Heavy new supply typically softens prices + rents 12–24 months out; constrained supply supports both.
Investment metrics
- 1% rule
- 0.96% ✗
- Cap rate
- 7.78%
- Cash-on-cash
- 5.30%
- DSCR
- 1.24
- GRM
- 8.7
CMA / ARV
- ARV (on-the-fly)
- $144,710
- Comps found
- 12
Show comp detail 12 sales within ~0.75 mi
| Address | Dist | Beds/Ba | Sqft | Sold | Price | $/sf | Match |
|---|---|---|---|---|---|---|---|
| 6106 S Hillcrest Dr | 0.00mi | 2/1.5 (-1) | 998 (0%) | 1mo | $125,000 | $125 | 92 |
| 5516 S Agnew Ave | 0.37mi | 3/1.0 | 999 (+0%) | 3mo | $145,500 | $146 | 76 |
| 2436 SW 53rd St | 0.45mi | 3/1.0 | 999 (+0%) | 5mo | $144,000 | $144 | 71 |
| 2401 SW 54th St | 0.42mi | 3/1.0 | 935 (-6%) | 1mo | $177,000 | $189 | 66 |
| 2601 SW 63rd Pl | 0.31mi | 3/1.5 | 1,096 (+10%) | 3mo | $126,900 | $116 | 65 |
| 2509 SW 64th St | 0.31mi | 3/1.5 | 1,096 (+10%) | 4mo | $199,000 | $182 | 64 |
| 2621 SW 70th St | 0.74mi | 3/1.5 | 1,032 (+3%) | 1mo | $150,000 | $145 | 57 |
| 1432 SW 60th St | 0.71mi | 3/1.5 | 942 (-6%) | 2mo | $133,000 | $141 | 54 |
| 1433 SW 60th St | 0.71mi | 3/1.5 | 942 (-6%) | 4mo | $160,000 | $170 | 53 |
| 2341 SW 50th St | 0.71mi | 3/1.0 | 950 (-5%) | 4mo | $124,000 | $131 | 52 |
| 1452 SW 62nd St | 0.69mi | 3/1.5 | 1,116 (+12%) | 4mo | $147,000 | $132 | 43 |
| 1600 SW 64th St | 0.63mi | 2/1.0 (-1) | 883 (-12%) | 2mo | $155,000 | $176 | 41 |
Match score weights: distance 35% · size 25% · config 20% · recency 20%. Top-matched comps best support the ARV.
Projected returns pro-forma
-3.0% appreciation · 3.49% rent growth · sell at horizon
- IRR
- -7.6%
- Equity multiple
- 0.72×
- Total profit
- $-10,235
- Equity at exit
- $19,383
- IRR
- 2.5%
- Equity multiple
- 1.18×
- Total profit
- $6,711
- Equity at exit
- $11,240
Cash invested: $36,400 (down + closing). Projections, not guarantees.
Landlord ↔ Tenant lean methodology
- Overall (STATE)
- 83 Strongly Landlord-Friendly
- State Oklahoma
- 83 Strongly Landlord-Friendly · R+20
- County
- — inherits STATE
- City
- — inherits STATE
ZIP-level market 73159
- Rents YoY
- 3.5%
- Active inventory
- 38
- Price-to-rent
- 8.7×
Monthly cashflow live
- Estimated rent
- $1,242 high interval (Pro) →
- Mortgage (P&I)
- −$682
- Tax from tax record
- −$85 /mo · $1,016/yr
- Insurance
- −$54
- HOA
- −$0
- Vacancy / Maint / Mgmt
- −$261
- Net cashflow
- $161
Break-even live
Sensitivity live
| Price | -10% $234 | -5% $198 | +0% $161 | +5% $124 | +10% $87 |
|---|---|---|---|---|---|
| Rent | -10% $63 | -5% $112 | +0% $161 | +5% $210 | +10% $259 |
| Rate | -1.0pp $226 | -0.5pp $194 | base $161 | +0.5pp $127 | +1.0pp $93 |
UW: 25.0% down · 7.5% · 30yr · 1.5% tax · 5.0% vac · 8.0% maint · 8.0% mgmt
Financing live
Cash to close
- Down payment
- $32,500
- Closing costs
- $3,900
- Reserves months
- —
- Total cash needed
- —
Loan-product check · same deal, 3 products live
Conventional
25% down · 7.5% · 30yr
- Down + closing
- —
- Monthly P&I
- —
- Monthly cashflow
- —
- DSCR
- —
- Eligible?
- —
Personal DTI + credit; lowest rate.
DSCR
20% down · 8.5% · 30yr
- Down + closing
- —
- Monthly P&I
- —
- Monthly cashflow
- —
- DSCR
- —
- Eligible?
- —
No personal income docs; deal must DSCR.
Hard money
10% down · 12.0% · 12mo
- Down + closing
- —
- Monthly P&I
- —
- Monthly cashflow
- —
- DSCR
- —
- Eligible?
- —
Short-term bridge; refi at stabilization.
Rent comps 40 comps
| Address | Beds | Baths | Sqft | Rent | $/sqft | DOM | Units | Dist |
|---|---|---|---|---|---|---|---|---|
| 2120 SW 61st St Oklahoma City, OK | 3.0 | 1.0 | 1101 | $1,200 | $1.09 | 45d | 1 | 0.40mi |
| 2813 SW 62nd St Oklahoma City, OK | 3.0 | 1.5 | 1001 | $1,400 | $1.40 | 25d | 1 | 0.50mi |
| 2741 SW 54th Pl Oklahoma City, OK | 3.0 | 2.0 | 1059 | $1,249 | $1.18 | 3d | 1 | 0.57mi |
| 2728 SW 65th St Oklahoma City, OK | 3.0 | 1.0 | 863 | $1,250 | $1.45 | 5d | 1 | 0.60mi |
| 2908 SW 62nd St Oklahoma City, OK | 3.0 | 1.5 | 936 | $1,450 | $1.55 | 4d | 1 | 0.64mi |
| 5617 S May Ave Oklahoma City, OK | 1.0–3.0 | 1.5 | 1000 | $926 | $0.93 | 25d | 1 | 0.66mi |
| 5901 S May Ave Unit 086 LI Oklahoma City, OK | 2.0 | 2.0 | 859 | $945 | $1.10 | 22d | 1 | 0.69mi |
| 5901 S May Ave Unit 058- Up Oklahoma City, OK | 2.0 | 2.0 | 859 | $945 | $1.10 | 3d | 1 | 0.69mi |
| 5901 S May Ave Unit 090 Oklahoma City, OK | 2.0 | 2.0 | 859 | $945 | $1.10 | 45d | 1 | 0.69mi |
| 5901 S May Ave Unit 105 Oklahoma City, OK | 2.0 | 2.0 | 859 | $995 | $1.16 | 3d | 1 | 0.69mi |
| 5901 S May Ave Apt 38 Oklahoma City, OK | 2.0 | 2.0 | 859 | $1,288 | $1.50 | 45d | 1 | 0.69mi |
| 5901 S May Ave Unit 006 Oklahoma City, OK | 2.0 | 2.0 | 859 | $949 | $1.10 | 45d | 1 | 0.69mi |
| 5901 S May Ave Apt 55 Oklahoma City, OK | 2.0 | 2.0 | 859 | $995 | $1.16 | 45d | 1 | 0.69mi |
| 5901 S May Ave Unit 089 VLI Oklahoma City, OK | 2.0 | 2.0 | 859 | $999 | $1.16 | 45d | 1 | 0.69mi |
| 1433 SW 60th St Oklahoma City, OK | 3.0 | 2.0 | 942 | $1,400 | $1.49 | 45d | 1 | 0.71mi |
| 1432 SW 61st Ter Oklahoma City, OK | 3.0 | 1.5 | 891 | $1,145 | $1.29 | 45d | 1 | 0.72mi |
| 2801 SW 51st St Oklahoma City, OK | 2.0 | 1.0 | 840 | $1,025 | $1.22 | 3d | 1 | 0.75mi |
| 2759 W I 240 Service Rd Oklahoma City, OK | 1.0–2.0 | 1.0–1.5 | 725 | $924 | $1.27 | 5d | 4 | 0.76mi |
| 5901 S May Ave Unit 004 VLI Up Oklahoma City, OK | 2.0 | 2.0 | 859 | $986 | $1.15 | 45d | 1 | 0.76mi |
| 1402 SW 59th St Apt 1112 Oklahoma City, OK | 2.0 | 1.5 | 925 | $980 | $1.06 | 45d | 1 | 0.80mi |
| 1402 SW 59th St Apt 3201 Oklahoma City, OK | 2.0 | 1.0 | 950 | $865 | $0.91 | 45d | 1 | 0.80mi |
| 1402 SW 59th St Unit 3202 Oklahoma City, OK | 2.0 | 1.0 | 950 | $865 | $0.91 | 25d | 1 | 0.80mi |
| 2500 SW 48th St Oklahoma City, OK | 2.0 | 1.0 | 1096 | $1,050 | $0.96 | 45d | 1 | 0.80mi |
| 2812 SW 48th St Oklahoma City, OK | 4.0 | 1.0 | 840 | $1,350 | $1.61 | 21d | 1 | 0.84mi |
| 1344 SW 62nd St Oklahoma City, OK | 3.0 | 1.0 | 878 | $1,300 | $1.48 | 4d | 1 | 0.85mi |
| 2412 SW 47th St Oklahoma City, OK | 3.0 | 1.0 | 638 | $1,150 | $1.80 | 25d | 1 | 0.87mi |
| 2741 SW Murray Dr Oklahoma City, OK | 3.0 | 1.0 | 949 | $1,395 | $1.47 | 3d | 1 | 0.88mi |
| 16 SW Duplex Units Oklahoma City, OK | 2.0 | 2.0 | 1000 | $1,502 | $1.50 | 5d | 5 | 0.92mi |
| 2600 W Interstate 240 Service Rd Unit 2731 Oklahoma City, OK | 2.0 | 1.5 | 1056 | $999 | $0.95 | 45d | 1 | 0.94mi |
| 2600 W Interstate 240 Service Rd Unit 2729 Oklahoma City, OK | 2.0 | 1.5 | 1056 | $999 | $0.95 | 25d | 1 | 0.94mi |
| 2300 SW 74th St Oklahoma City, OK | 1.0–2.0 | 1.0–1.5 | 771 | $1,050 | $1.36 | 45d | 1 | 1.02mi |
| 1338 South Dr Oklahoma City, OK | 2.0 | 1.0 | 720 | $1,150 | $1.60 | 17d | 1 | 1.10mi |
| 4330 S Barnes Ave Oklahoma City, OK | 1.0–3.0 | 1.0–2.0 | 860 | $1,099 | $1.28 | 5d | 9 | 1.23mi |
| 1020 SW 65th St Oklahoma City, OK | 3.0 | 1.0 | 956 | $1,330 | $1.39 | 45d | 1 | 1.32mi |
| 6111 S Klein Ave Oklahoma City, OK | 2.0–3.0 | 1.0 | 617 | $900 | $1.46 | 5d | 3 | 1.32mi |
| 1004 SW 62nd St Oklahoma City, OK | 3.0 | 1.0 | 968 | $1,295 | $1.34 | 5d | 1 | 1.32mi |
| 2128 SW 41st St Oklahoma City, OK | 2.0 | 1.0 | 860 | $820 | $0.95 | 4d | 1 | 1.33mi |
| 1332 SW 77th Pl Oklahoma City, OK | 2.0 | 1.0 | 1000 | $1,195 | $1.20 | 25d | 1 | 1.42mi |
| 1105 W I-240 Service Rd Oklahoma City, OK | 2.0 | 2.0 | 1000 | $945 | $0.94 | 23d | 1 | 1.46mi |
| 1105 W Interstate 240 Service Rd Unit 1111-1 Oklahoma City, OK | 2.0 | 1.0 | 950 | $895 | $0.94 | 25d | 1 | 1.46mi |
Listing history 23 events
-
2026-04-16status Pending
-
2026-04-01status Active
-
2026-03-13status Pending
-
2026-02-23price $130,000
-
2026-02-03price $140,000
-
2026-01-13price $150,000
-
2025-12-27$155,000 Active
-
2008-03-27soldstatus $55,000 242-char remark
Show marketing remark (242 chars)
BACKS TO WILLOW CREEK GOLF COURSE!!!NICE HOME FOR INVESTOR OR 1ST TIME BUYER**POSSIBLE SETTLEMENT, MAY NEED REPAIRS**BEING SOLD 'AS IS' SELLER WILL MAKE NO REPAIRS**NO FHA/VA FINANCE**CLOSING TO BE HELD AT LAWYERS TITLE, 1113 S. DOUGLAS,MWC**
-
2007-12-26$62,500 242-char remark
Show marketing remark (242 chars)
BACKS TO WILLOW CREEK GOLF COURSE!!!NICE HOME FOR INVESTOR OR 1ST TIME BUYER**POSSIBLE SETTLEMENT, MAY NEED REPAIRS**BEING SOLD 'AS IS' SELLER WILL MAKE NO REPAIRS**NO FHA/VA FINANCE**CLOSING TO BE HELD AT LAWYERS TITLE, 1113 S. DOUGLAS,MWC**
-
2007-12-19historical
-
2007-12-19historical
-
2007-09-22historical
-
2007-04-11$71,500
-
2005-04-25soldstatus $74,000
-
2005-04-22soldstatus $74,000
-
2005-01-27$75,900
-
2001-12-12soldstatus $65,000
-
2001-12-10soldstatus $65,000
-
2001-11-07$68,990
-
2001-02-19$59,900
-
2000-10-20$59,900
-
1999-09-14soldstatus $45,000
-
1978-05-01soldstatus $19,433
ⓘ Source: listings_history table (triggers on properties + properties_extension) + one-shot
backfill from property_details.listing_events for pre-trigger history.
Tax reassessment forecast OK · Resets to sale price
- Current annual tax
- $1,016 · $85/mo
- Projected year-2 tax
- $1,170 · $98/mo
- Expected delta
- +$154/yr (+$13/mo · 15.2%)
ⓘ Screening estimate from a state-policy table — verify with the county assessor before closing.
Climate risk First Street
- Flood 1/10 Low FEMA zone X (unshaded) · 0% chance over 30 yrs
- Wildfire 2/10 Low
- Heat 6/10 Major 7 d/yr ≥107°F today · 19 d/yr by 30 yrs out
- Wind 2/10 Low 4% chance of damaging wind over 30 yrs
- Air quality 1/10 Low 0 unhealthy d/yr today · 0 by 30 yrs out
Nearby sold comps map
Loading sold comps map…
Walkable amenities ~0.75 mi
Loading nearby amenities…
Taxation est. · year 1
- Rental income
- $14,907
- − Mortgage interest
- −$7,282
- − Property taxes
- −$1,016
- − Insurance
- −$650
- − Repairs & maintenance
- −$1,193
- − Management
- −$1,193
- − Depreciation
- −$3,782
- Taxable loss
- −$208
- Est. tax savings @ 24.0%
- +$50
- After-tax cash flow
- $1,980/yr
For passive investors: Depreciation is non-cash, so a rental often shows a tax loss while cash-flowing — sheltering income. Rental losses are passive: they offset passive income freely, and up to $25,000/yr can offset ordinary (W-2) income if you actively participate and your MAGI is under $100k (phasing out to $0 by $150k); unused losses carry forward. On sale, claimed depreciation is recaptured at up to 25%, and gains may owe capital-gains tax (a 1031 exchange can defer both). Figures are a year-1 estimate at your 24.0% rate — not tax advice; consult a CPA.
Schools (NCES district)
- District
- Oklahoma City
- NCES district ID
- 4022770
- Math proficiency
- 7% ▼ -5.00%
- Reading proficiency
- 10% ▼ -6.00%
- Median HH income
- $35,606
- Composite
- 7.0/100
- National rank
- #9970
- State rank
- #254 of 270 in OK
Livability — Oklahoma City
- Score
- 80/100
- State rank
- #3
- US rank
- #1635
Category grades
Schools grade is shown separately in the Schools card above.
Census & demographics
- Census place
- Oklahoma City, OK
- County
- Oklahoma County · 771,644 people
- City population
- 498,656
- Metro
- Oklahoma City, OK
- Population (ZIP)
- 31,447
- Household income
- $54,642
- Rent vs Own
- Severe rent burden
- 1138.0
Population outlook (Oklahoma County) Hauer SSP2
- Today (2025)
- 911,875 people
- By 2030
- 982,413 · +7.7%
- By 2040
- 1,130,468 · +24.0%
- By 2050
- 1,288,422 · +41.3%
- By 2075
- 1,711,482 · +87.7%
- By 2100
- 2,088,448 · +129.0%
Race, ethnicity, and origin ACS 2023
- Neighborhood character
- Diverse neighborhood (Simpson 0.69)
- Race & ethnicity
- White 46% Hispanic / Latino 31% Two or more races 15% Black 9% Asian 5% Native American 5%
- Hispanic origin (detail)
- Mexican 27%
- Common ancestry
- Italian 2% Slovak 1% Serbian 1%
- Foreign-born
- 14% · Canada, Vietnam, Dominican Republic
- Languages at home
- 69% English-only · Spanish 24% Vietnamese 4% Other Asian/Pacific 1%
Political lean MEDSL · Oklahoma
- 2024 margin
- Toss-up / Even · D 48.0% · R 49.7% · Other 2.3%
- 2008→2024 swing
- +15.1pp toward D · 2008: -16.8pp · 2024: -1.7pp
- All cycles
- 2024: R+1.7 2020: R+1.1 2016: R+10.5 2012: R+16.7 2008: R+16.8
Not yet ingested
- Civics
- —
Market trends
- HPI YoY
- ▼ -142.40%
- Current HPI
- 245.4497
- Rent YoY
- ▲ 3.49%
- Metro
- Oklahoma City, OK
- State GDP YoY
- ▲ 1.55%
- F500 in state
- 6
Industry mix (Fortune 500 HQ in OK)
| Industry | F500 HQs | Revenue |
|---|---|---|
| Energy | 3 | $48B |
|
||
Price history
+569.0% since first listed23 events — show timeline
- 2026-04-16 Pending — MLSOK
- 2026-04-01 Relisted — MLSOK
- 2026-03-13 Pending — MLSOK
- 2026-02-23 Price Changed $130,000 MLSOK
- 2026-02-03 Price Changed $140,000 MLSOK
- 2026-01-13 Price Changed $150,000 MLSOK
- 2025-12-27 Listed $155,000 MLSOK
- 2008-03-27 Sold (MLS) $55,000 MLSOK
- 2007-12-26 Listed $62,500 MLSOK
- 2007-12-19 Listing Removed — MLSOK
- 2007-12-19 Listing Removed — MLSOK
- 2007-09-22 Listing Removed — MLSOK
- 2007-04-11 Listed $71,500 MLSOK
- 2005-04-25 Sold (Public Records) $74,000 Public Records
- 2005-04-22 Sold (MLS) $74,000 MLSOK
- 2005-01-27 Listed $75,900 MLSOK
- 2001-12-12 Sold (Public Records) $65,000 Public Records
- 2001-12-10 Sold (MLS) $65,000 MLSOK
- 2001-11-07 Listed $68,990 MLSOK
- 2001-02-19 Listed $59,900 MLSOK
- 2000-10-20 Listed $59,900 MLSOK
- 1999-09-14 Sold (Public Records) $45,000 Public Records
- 1978-05-01 Sold (Public Records) $19,433 Public Records
Property tax history
+4.5%/yrLatest (2025): $1,016 · +2.8% YoY. Source: county tax records.
Cash-flow waterfall
monthlySold comps — $/sqft
last 12 mo · ≤1 miLoading sold comps…