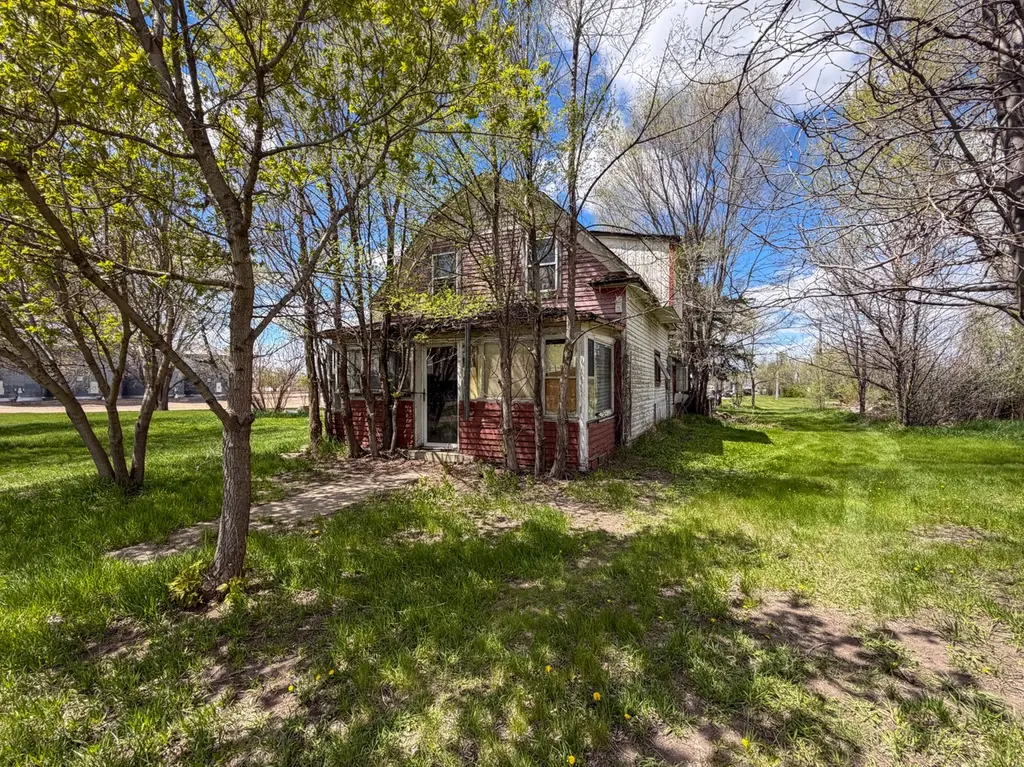
215 Commercial St N · Wessington, SD
Flood risk 1/10 · Minimal
- FEMA flood zone
- X (unshaded)
- Chance of flooding over 30 yrs
- 0.0%
- Est. flood insurance / yr
- $473 – $860
Fire risk 3/10 · Minor
- Est. fire insurance / yr
- $1,342 – $2,492
Heat risk 3/10 · Minor
- Hot days now (above 100°F)
- 7 days/yr
- Hot days in 30 yrs
- 14 days/yr
Wind risk 2/10 · Minimal
- Chance of severe wind over 30 yrs
- —
Air-quality risk 1/10 · Minimal
- Unhealthy air days now
- 0 days/yr
- Unhealthy air days in 30 yrs
- 0 days/yr
Risk factors via First Street. Map © Google.
Why this score? — see what drove the B grade
The composite is a weighted blend of 9 inputs, each scored 0–100. Each bar is that input's sub-score; the figure is the points it added to the 100-point composite (weight × sub-score).
- Cash flow +30.0/30.0
- 1% rule +10.0/10.0
- DSCR +10.0/10.0
- ARV discount +7.5/15.0
- Appreciation +5.0/10.0
- Schools +3.1/10.0
- Livability +3.0/5.0
- Rent growth +2.5/5.0
- Condition / age +2.5/5.0
$25,000
🖨 Deal sheet (PDF) 📄 Offer letter ✓ Due diligence
Key facts
- Two lots
- Single-car garage
- Future development
Tags
Property features AI
Exterior
- Parking: Attached or detached garage with space for 1 vehicle
- Home design: Residential property
- Exterior features: Lot approximately 100' x 165'; Zoned R-0
Interior
- Heating & cooling: Central air conditioning
- Interior features: Central air conditioning
Neighborhood map
What this means for you Summary
Snapshot
- This is a 2-bed/1.0-bath other listed at $25k.
Deal economics
- At list price, monthly cash flow is $625 ($7k/yr) — positive.
- The deal already cash-flows at list — no discount required.
- Meets the 1% rule at list price ($976 rent vs $25k).
- Recommended offer: $24k (3.0% below list) — sets the bar for market timing.
Location & tenants
- Location reads 60/100 on livability (#244 in SD) — a middle-class / working-renter tenant base. Strengths: cost of living A+, housing A-; Watch: health & safety C-, crime F, amenities F.
- Wolsey Wessington School District 02-6 (rural): math 30% / reading 35% proficiency, ranked #128 of 148 in SD (top 86%) — families likely to look elsewhere, expect single-tenant / working-renter base with shorter leases.
- Zoned schools: Wolsey Wessington Elementary - 02 (math 42% / reading 37%, grade F, #169 of 253 statewide, top 71%, 166 students, 25% FRL); Wolsey Wessington Middle School - 03 (math 52% / reading 42%, grade D+, #70 of 143 statewide, top 50%, 83 students, 40% FRL); Wolsey Wessington High School - 01 (math 50% / reading 50%, grade D, #100 of 151 statewide, top 69%, 110 students, 31% FRL) — zoned schools at 32% FRL track the district average.
- Zoned-school proficiency averages 45% at this address vs 32% district-wide (+13 pts) — the actual schools serving this property are materially stronger than the Wolsey Wessington School District 02-6 average implies; a family-tenant draw the district grade alone would hide.
- Market conditions: 3 active listings in the ZIP; 30 units permitted in Beadle County in 2024 (6 in 5+ unit buildings).
Forward outlook
- In year one you build about $923 of equity ($173 loan paydown + $750 appreciation (3.0% local appreciation)).
- Beadle County population projected at +39% by 2050 — long-run rental-demand tailwind backs the buy-and-hold thesis.
- At projected returns (3.0% appreciation + 3.0% rent growth), your $7k cash investment doubles in ~1 year — after that, you're playing with house money.
Negotiation context
- It's been on market 45 days — a 3% lower offer ($24k) is reasonable based on typical stale-listing flexibility.
Risks & watch-outs
- Watch-outs: built in 1922 — expect roof / HVAC / electrical / plumbing capex.
Questions for the listing agent
- It's been on market 45 days. Have you received any prior offers? Is the seller open to a 3% concession, seller financing, or rate buy-down credit?
- Built in 1922 — when were the roof, HVAC, electrical panel, plumbing, and water heater last replaced?
- Is there a deadline driving the sale (1031 exchange, divorce, estate, relocation)? That informs how much negotiation room exists.
- Schools are F-rated, which usually means shorter tenancies and higher turnover. Who's the typical renter profile here, and what's been the actual vacancy rate?
- Crime grade is F in this area — have there been break-ins, vandalism, or insurance claims at this property in the last 3 years? What carrier currently insures it and at what premium?
- What's the average days-on-market for RENTAL listings here right now (not sales)? A rising rental-DOM trend means longer vacancies and softer asking-rent achievability than the comps imply.
- What's the recent tenant-quality profile in this submarket — average credit score on applications, eviction rate, late-payment / NSF rate, and stable-employment percentage? A property-management company in the area should have these aggregated.
- How much new for-sale + rental construction is in the pipeline within 1–3 miles? Heavy new supply typically softens prices + rents 12–24 months out; constrained supply supports both.
Investment metrics
- 1% rule
- 3.90% ✓
- Cap rate
- 36.28%
- Cash-on-cash
- 107.10%
- DSCR
- 5.77
- GRM
- 2.1
CMA / ARV
No comps found within radius.
Projected returns pro-forma
3.0% appreciation · 3.0% rent growth · sell at horizon
- IRR
- —
- Equity multiple
- 7.11×
- Total profit
- $42,801
- Equity at exit
- $11,241
- IRR
- —
- Equity multiple
- 14.80×
- Total profit
- $96,602
- Equity at exit
- $17,324
Cash invested: $7,000 (down + closing). Projections, not guarantees.
Landlord ↔ Tenant lean methodology
- Overall (STATE)
- 83 Strongly Landlord-Friendly
- State South Dakota
- 83 Strongly Landlord-Friendly · R+16
- County
- — inherits STATE
- City
- — inherits STATE
ZIP-level market 57381
- Active inventory
- 3
- Price-to-rent
- 2.1×
Monthly cashflow live
- Estimated rent
- $976 medium interval (Pro) →
- Mortgage (P&I)
- −$131
- Tax from tax record
- −$5 /mo · $54/yr
- Insurance
- −$10
- HOA
- −$0
- Vacancy / Maint / Mgmt
- −$205
- Net cashflow
- $625
Break-even live
Sensitivity live
| Price | -10% $639 | -5% $632 | +0% $625 | +5% $618 | +10% $581 |
|---|---|---|---|---|---|
| Rent | -10% $548 | -5% $586 | +0% $625 | +5% $663 | +10% $702 |
| Rate | -1.0pp $637 | -0.5pp $631 | base $625 | +0.5pp $618 | +1.0pp $612 |
UW: 25.0% down · 7.5% · 30yr · 1.5% tax · 5.0% vac · 8.0% maint · 8.0% mgmt
Financing live
Cash to close
- Down payment
- $6,250
- Closing costs
- $750
- Reserves months
- —
- Total cash needed
- —
Loan-product check · same deal, 3 products live
Conventional
25% down · 7.5% · 30yr
- Down + closing
- —
- Monthly P&I
- —
- Monthly cashflow
- —
- DSCR
- —
- Eligible?
- —
Personal DTI + credit; lowest rate.
DSCR
20% down · 8.5% · 30yr
- Down + closing
- —
- Monthly P&I
- —
- Monthly cashflow
- —
- DSCR
- —
- Eligible?
- —
No personal income docs; deal must DSCR.
Hard money
10% down · 12.0% · 12mo
- Down + closing
- —
- Monthly P&I
- —
- Monthly cashflow
- —
- DSCR
- —
- Eligible?
- —
Short-term bridge; refi at stabilization.
Listing history 17 events
-
2026-06-21days on market $25,000 Active 45 DOM
-
2026-06-21days on market $25,000 Active 44 DOM
-
2026-06-18days on market $25,000 Active 42 DOM
-
2026-06-17days on market $25,000 Active 41 DOM
-
2026-06-16days on market $25,000 Active 40 DOM
-
2026-06-15days on market $25,000 Active 39 DOM
-
2026-06-13days on market $25,000 Active 37 DOM
-
2026-06-12days on market $25,000 Active 36 DOM
-
2026-06-09days on market $25,000 Active 33 DOM
-
2026-06-08days on market $25,000 Active 32 DOM
-
2026-06-08days on market $25,000 Active 31 DOM
-
2026-06-05days on market $25,000 Active 29 DOM
-
2026-06-04days on market $25,000 Active 27 DOM
-
2026-06-02days on market $25,000 Active 26 DOM
-
2026-06-01days on market $25,000 Active 25 DOM
-
2026-05-31days on market $25,000 Active 24 DOM
-
2026-05-07$25,000 Active
ⓘ Source: listings_history table (triggers on properties + properties_extension) + one-shot
backfill from property_details.listing_events for pre-trigger history.
Tax reassessment forecast SD · Resets to sale price
- Current annual tax
- $54 · $5/mo
- Projected year-2 tax
- $328 · $27/mo
- Expected delta
- +$273/yr (+$23/mo · 500.9%)
ⓘ Screening estimate from a state-policy table — verify with the county assessor before closing.
Climate risk First Street
- Flood 1/10 Low FEMA zone X (unshaded) · 0% chance over 30 yrs
- Wildfire 3/10 Moderate
- Heat 3/10 Moderate 7 d/yr ≥100°F today · 14 d/yr by 30 yrs out
- Wind 2/10 Low
- Air quality 1/10 Low 0 unhealthy d/yr today · 0 by 30 yrs out
Nearby sold comps map
Loading sold comps map…
Walkable amenities ~0.75 mi
Loading nearby amenities…
Taxation est. · year 1
- Rental income
- $11,709
- − Mortgage interest
- −$1,400
- − Property taxes
- −$54
- − Insurance
- −$125
- − Repairs & maintenance
- −$937
- − Management
- −$937
- − Depreciation
- −$727
- Taxable income
- $7,528
- Est. tax owed @ 24.0%
- −$1,807
- After-tax cash flow
- $5,690/yr
For passive investors: Depreciation is non-cash, so a rental often shows a tax loss while cash-flowing — sheltering income. Rental losses are passive: they offset passive income freely, and up to $25,000/yr can offset ordinary (W-2) income if you actively participate and your MAGI is under $100k (phasing out to $0 by $150k); unused losses carry forward. On sale, claimed depreciation is recaptured at up to 25%, and gains may owe capital-gains tax (a 1031 exchange can defer both). Figures are a year-1 estimate at your 24.0% rate — not tax advice; consult a CPA.
Schools (NCES district)
- District
- Wolsey Wessington School District 02-6
- NCES district ID
- 4680100
- Math proficiency
- 30% ▼ -12.00%
- Reading proficiency
- 35% ▼ -12.00%
- Median HH income
- $47,119
- Composite
- 30.72/100
- National rank
- #11418
- State rank
- #128 of 148 in SD
Livability — Wessington
- Score
- 60/100
- State rank
- #244
- US rank
- #18646
Category grades
Schools grade is shown separately in the Schools card above.
Census & demographics
- Census place
- Wessington, SD
- Population (ZIP)
- 504
Population outlook (Beadle County) Hauer SSP2
- Today (2025)
- 20,094 people
- By 2030
- 21,218 · +5.6%
- By 2040
- 24,042 · +19.6%
- By 2050
- 27,931 · +39.0%
- By 2075
- 43,296 · +115.5%
- By 2100
- 65,888 · +227.9%
Race, ethnicity, and origin ACS 2023
- Neighborhood character
- Predominantly White (91%)
- Race & ethnicity
- White 91% Two or more races 6% Hispanic / Latino 3%
- Common ancestry
- Portuguese 9% Iranian 7% Romanian 3%
- Foreign-born
- 1% · Canada
- Languages at home
- 99% English-only · German/W. Germanic 1%
Political lean MEDSL · Beadle
- 2024 margin
- Solid R (+40.1) · D 28.8% · R 68.8% · Other 2.4%
- 2008→2024 swing
- -32.8pp toward R · 2008: -7.3pp · 2024: -40.1pp
- All cycles
- 2024: R+40.1 2020: R+38.1 2016: R+37.6 2012: R+18.6 2008: R+7.3
Not yet ingested
- Civics
- —
Market trends
- HPI YoY
- —
- Current HPI
- —
- Rent YoY
- —
- Metro
- —
- State GDP YoY
- ▲ 0.70%
- F500 in state
- 2
Industry mix (Fortune 500 HQ in SD)
| Industry | F500 HQs | Revenue |
|---|---|---|
| Utilities | 1 | $1B |
|
||
Price history
1 event — show timeline
- 2026-05-07 Listed $25,000 HBOR
Property tax history
+3.4%/yrLatest (2026): $54 · -8.1% YoY. Source: county tax records.
Cash-flow waterfall
monthlySold comps — $/sqft
last 12 mo · ≤1 miLoading sold comps…