 🏗️ New Construction
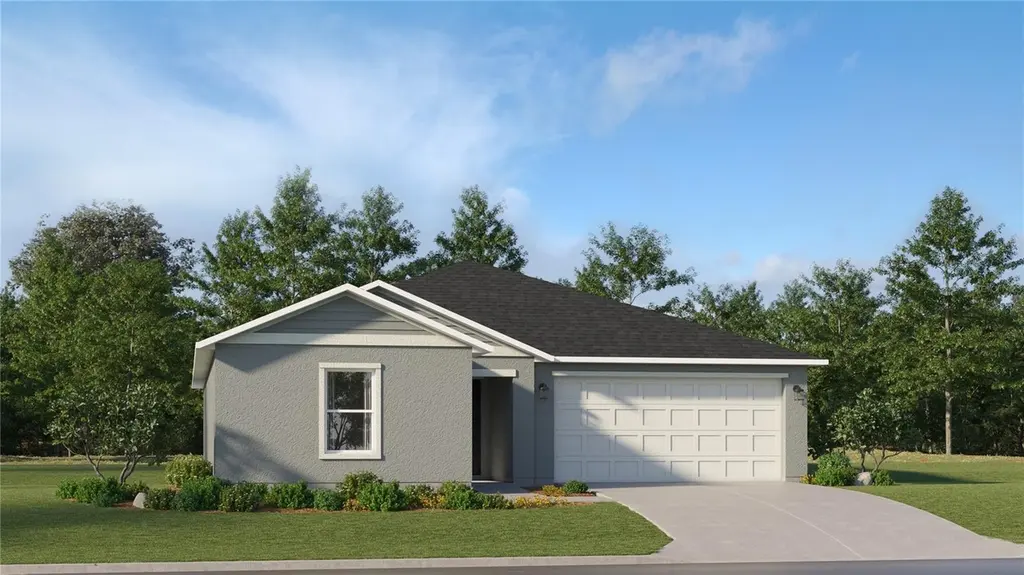
1489 NW 48th Ter · Ocala, FL
Flood risk No data
- FEMA flood zone
- —
- Chance of flooding over 30 yrs
- —
- Est. flood insurance / yr
- —
Fire risk No data
- Est. fire insurance / yr
- —
Heat risk No data
- Hot days now (above threshold)
- —
- Hot days in 30 yrs
- —
Wind risk No data
- Chance of severe wind over 30 yrs
- —
Air-quality risk No data
- Unhealthy air days now
- —
- Unhealthy air days in 30 yrs
- —
Risk factors via First Street. Map © Google.
Why this score? — see what drove the D grade
The composite is a weighted blend of 9 inputs, each scored 0–100. Each bar is that input's sub-score; the figure is the points it added to the 100-point composite (weight × sub-score).
- Cash flow +10.1/30.0
- ARV discount +7.5/15.0
- Rent growth +5.0/5.0
- Condition / age +4.8/5.0
- Schools +3.6/10.0
- Livability +3.5/5.0
- 1% rule +3.2/10.0
- DSCR +2.9/10.0
- Appreciation +0.0/10.0
$292,990
🖨 Deal sheet 📄 Offer letter ✓ Due diligence
Listing remarks
Under Construction. This new single-story home is a modern take on a classic design. Down the foyer is a spacious and open-plan family room which has direct access to the cozy dining room, well-equipped kitchen and attached patio, perfect for everyday living. In a private corner is the owner’s suite with a convenient adjoining bathroom, while on the opposite side of the home are three secondary bedrooms to offer restful retreats.
Key facts
- Adjoining bathroom
- Owner's suite
- Single-story home
Tags
Neighborhood map
What this means for you Summary
Snapshot
- This is a 4-bed/2.0-bath single-family listed at $293k. Condition is rated excellent.
Deal economics
- At list price, monthly cash flow is $-174 ($-2k/yr) — negative.
- To cash-flow at today's rent, offer at most $270k (7.9% below list).
- To meet the 1% rule (rent ≥ 1% of price), the offer needs to be $242k (17.5% below list).
- Recommended offer: $242k (17.5% below list) — sets the bar for 1% rule.
- Cap rate 5.6% vs local median 4.2% in Ocala — top-decile yield for the area; either an underpriced asset or a hidden risk that comps aren't pricing in. Stress-test before assuming the spread holds.
Location & tenants
- Location reads 69/100 on livability (#476 in FL) — a middle-class / working-renter tenant base. Strengths: cost of living A+, housing A+, health & safety A+; Watch: crime F, amenities F, commute F.
- Marion (rural): math 42% / reading 43% proficiency, ranked #61 of 73 in FL (top 84%) — families likely to look elsewhere, expect single-tenant / working-renter base with shorter leases; 61% free/reduced lunch — lower-income household profile, screen leases tightly.
- Zoned schools: College Park Elementary School (math 46% / reading 37%, grade F, #1,437 of 2,144 statewide, top 68%, 840 students, 78% FRL); West Port High School (math 34% / reading 52%, grade F, #255 of 667 statewide, top 39%, 2,906 students, 52% FRL) — zoned schools at 65% FRL track the district average.
- Market conditions: Rents rising fast (+11.1%/yr); 663 active listings in the ZIP; 6 comparable units currently listed for rent nearby; rentals at typical pace (median 21d on market — plan ~3-4 weeks tenant-placement turnaround); 7,071 units permitted in Marion County in 2024 (534 in 5+ unit buildings).
- This rent runs 44% of the median local income ($66k/yr) — at the standard rent-burdened threshold; future hikes will face affordability resistance.
Forward outlook
- Local home prices are declining (-3.0%/yr); year-one equity from $2k of loan paydown is wiped out by about $9k of value loss. Plan a longer hold.
- Marion County population projected at +13% by 2050 — modest demand growth; plan on rents tracking national, not racing it.
Negotiation context
- Only 13 days on market — expect competitive offers; lowballing is unlikely to land.
Questions for the listing agent
- What do current leases actually rent for vs. the listed asking? Can we see a recent rent roll and the last 12 months of T-12 income?
- What does the HOA fee cover, when was the last increase, and are there any pending special assessments or reserve-fund shortfalls?
- Is there a deadline driving the sale (1031 exchange, divorce, estate, relocation)? That informs how much negotiation room exists.
- Crime grade is F in this area — have there been break-ins, vandalism, or insurance claims at this property in the last 3 years? What carrier currently insures it and at what premium?
- The area grade is low — what's the realistic commute time and amenity access for the typical tenant pool here? Any planned neighborhood developments (good or bad) we should know about?
- What's the average days-on-market for RENTAL listings here right now (not sales)? A rising rental-DOM trend means longer vacancies and softer asking-rent achievability than the comps imply.
- What's the recent tenant-quality profile in this submarket — average credit score on applications, eviction rate, late-payment / NSF rate, and stable-employment percentage? A property-management company in the area should have these aggregated.
- How much new for-sale + rental construction is in the pipeline within 1–3 miles? Heavy new supply typically softens prices + rents 12–24 months out; constrained supply supports both.
Investment metrics
- 1% rule
- 0.82% ✗
- Cap rate
- 5.58%
- Cash-on-cash
- -2.53%
- DSCR
- 0.89
- GRM
- 10.2
CMA / ARV
- ARV (on-the-fly)
- $295,002
- Comps found
- 12
Show comp detail 12 sales within ~0.75 mi
| Address | Dist | Beds/Ba | Sqft | Sold | Price | $/sf | Match |
|---|---|---|---|---|---|---|---|
| 1457 NW 48th Ter | 0.00mi | 4/2.0 | 1,821 (0%) | 1mo | $292,990 | $161 | 99 |
| 1321 NW 48th Ter | 0.07mi | 4/2.0 | 1,821 (0%) | 8mo | $295,000 | $162 | 90 |
| 1385 NW 48th Ter | 0.03mi | 4/2.5 | 1,879 (+3%) | 5mo | $272,000 | $145 | 87 |
| 1283 NW 44th Court Rd | 0.32mi | 4/2.0 | 1,824 (+0%) | 13mo | $309,390 | $170 | 74 |
| 4684 NW 11th St | 0.29mi | 3/2.0 (-1) | 1,697 (-7%) | 2mo | $260,000 | $153 | 68 |
| 1177 NW 48th Ter | 0.45mi | 4/2.5 | 1,875 (+3%) | 12mo | $284,035 | $151 | 62 |
| 4493 NW 14th Loop | 0.48mi | 3/2.0 (-1) | 1,755 (-4%) | 8mo | $320,000 | $182 | 60 |
| 5195 NW 21st Loop | 0.67mi | 3/2.0 (-1) | 1,840 (+1%) | 8mo | $299,000 | $163 | 56 |
| 5306 NW 19th Pl | 0.54mi | 3/2.0 (-1) | 1,719 (-6%) | 9mo | $344,500 | $200 | 53 |
| 5391 NW 19th Pl | 0.63mi | 3/2.0 (-1) | 1,715 (-6%) | 12mo | $205,000 | $120 | 46 |
| 4433 NW 14th Loop | 0.39mi | 3/2.5 (-1) | 1,950 (+7%) | 21mo | $343,089 | $176 | 45 |
| 5332 NW 20th Pl | 0.60mi | 3/2.0 (-1) | 2,087 (+15%) | 15mo | $210,000 | $101 | 30 |
Match score weights: distance 35% · size 25% · config 20% · recency 20%. Top-matched comps best support the ARV.
Projected returns pro-forma
-3.0% appreciation · 8.0% rent growth · sell at horizon
- IRR
- -14.9%
- Equity multiple
- 0.44×
- Total profit
- $-46,049
- Equity at exit
- $43,986
- IRR
- 0.6%
- Equity multiple
- 1.05×
- Total profit
- $4,054
- Equity at exit
- $25,506
Cash invested: $82,601 (down + closing). Projections, not guarantees.
Landlord ↔ Tenant lean methodology
- Overall (STATE)
- 87 Strongly Landlord-Friendly
- State Florida
- 87 Strongly Landlord-Friendly · R+3
- County
- — inherits STATE
- City
- — inherits STATE
ZIP-level market 34482
- Rents YoY
- 11.1%
- Active inventory
- 663
- Price-to-rent
- 10.1×
Monthly cashflow live
- Estimated rent
- $2,418 high interval (Pro) →
- Mortgage (P&I)
- −$1,547
- Tax est. 1.5%
- −$369 /mo · $4,425/yr
- Insurance
- −$123
- HOA
- −$46
- Vacancy / Maint / Mgmt
- −$508
- Net cashflow
- $-174
Break-even live
UW: 25.0% down · 7.5% · 30yr · 1.5% tax · 5.0% vac · 8.0% maint · 8.0% mgmt
Financing live
Cash to close
- Down payment
- $73,750
- Closing costs
- $8,850
- Reserves months
- —
- Total cash needed
- —
Loan-product check · same deal, 3 products live
Conventional
25% down · 7.5% · 30yr
- Down + closing
- —
- Monthly P&I
- —
- Monthly cashflow
- —
- DSCR
- —
- Eligible?
- —
Personal DTI + credit; lowest rate.
DSCR
20% down · 8.5% · 30yr
- Down + closing
- —
- Monthly P&I
- —
- Monthly cashflow
- —
- DSCR
- —
- Eligible?
- —
No personal income docs; deal must DSCR.
Hard money
10% down · 12.0% · 12mo
- Down + closing
- —
- Monthly P&I
- —
- Monthly cashflow
- —
- DSCR
- —
- Eligible?
- —
Short-term bridge; refi at stabilization.
Rent comps 6 comps
| Address | Beds | Baths | Sqft | Rent | $/sqft | DOM | Units | Dist |
|---|---|---|---|---|---|---|---|---|
| 1632 NW 44th Court Rd Ocala, FL | 4.0 | 3.0 | 2039 | $2,200 | $1.08 | 21d | 1 | 0.30mi |
| 4522 NW 14th Loop Ocala, FL | 4.0 | 3.0 | 2028 | $2,050 | $1.01 | 13d | 1 | 0.47mi |
| 4530 NW 14th Loop Ocala, FL | 3.0 | 2.5 | 1966 | $2,250 | $1.14 | 13d | 1 | 0.48mi |
| 1527 NW 57th Ct Unit 1 Ocala, FL | 3.0 | 2.0 | 1460 | $1,550 | $1.06 | 21d | 1 | 0.83mi |
| 5353 N US Highway 27 Ocala, FL | 1.0–3.0 | 1.0–2.0 | 1169 | $2,045 | $1.75 | 21d | 1 | 1.25mi |
| 311 NW 60th Ave Ocala, FL | 3.0 | 2.0 | 1462 | $1,900 | $1.30 | 21d | 1 | 1.31mi |
HOA detail
- Monthly dues
- $46 · $552/yr
Listing history 3 events
-
2026-04-13status Pending
-
2026-04-08price $292,990
-
2026-03-31$289,990 Active
ⓘ Source: listings_history table (triggers on properties + properties_extension) + one-shot
backfill from property_details.listing_events for pre-trigger history.
Nearby sold comps map
Loading sold comps map…
Walkable amenities ~0.75 mi
Loading nearby amenities…
Taxation est. · year 1
- Rental income
- $29,021
- − Mortgage interest
- −$16,525
- − Property taxes
- −$4,425
- − Insurance
- −$1,475
- − Repairs & maintenance
- −$2,322
- − Management
- −$2,322
- − HOA
- −$552
- − Depreciation
- −$8,582
- Taxable loss
- −$7,181
- Est. tax savings @ 24.0%
- +$1,723
- After-tax cash flow
- $-366/yr
For passive investors: Depreciation is non-cash, so a rental often shows a tax loss while cash-flowing — sheltering income. Rental losses are passive: they offset passive income freely, and up to $25,000/yr can offset ordinary (W-2) income if you actively participate and your MAGI is under $100k (phasing out to $0 by $150k); unused losses carry forward. On sale, claimed depreciation is recaptured at up to 25%, and gains may owe capital-gains tax (a 1031 exchange can defer both). Figures are a year-1 estimate at your 24.0% rate — not tax advice; consult a CPA.
Condition & rehab AI · 6 photos
This single-story home is under construction and presents as move-in-ready with excellent condition and no visible repairs needed. It offers a modern design with spacious living areas and well-maintained interiors.
Value-add opportunities
- Both Painting the exterior — Enhances curb appeal and can increase both resale and rental value
- Both Landscaping improvements — Enhances curb appeal and can increase both resale and rental value
Renovation cost estimate screening
Value-add ROI direction
- Both Painting the exterior — Enhances curb appeal and can increase both resale and rental value ↑
- Both Landscaping improvements — Enhances curb appeal and can increase both resale and rental value ↑
ⓘ Cost ranges are severity-bucket heuristics (US national rule-of-thumb). Get contractor quotes + a written scope before underwriting a rehab budget.
Schools (NCES district)
- District
- Marion
- NCES district ID
- 1201260
- Math proficiency
- 42% ▼ -7.00%
- Reading proficiency
- 43% ▼ -4.00%
- Median HH income
- $40,015
- Composite
- 35.61/100
- National rank
- #4890
- State rank
- #61 of 73 in FL
Livability — Ocala
- Score
- 69/100
- State rank
- #476
- US rank
- #8461
Category grades
Schools grade is shown separately in the Schools card above.
Census & demographics
- Census place
- Ocala, FL
- County
- Marion County · 315,796 people
- City population
- 263,375
- Metro
- Ocala, FL
- Population (ZIP)
- 22,807
- Household income
- $65,901
- Rent vs Own
- Severe rent burden
- 282.0
Population outlook (Marion County) Hauer SSP2
- Today (2025)
- 365,905 people
- By 2030
- 376,768 · +3.0%
- By 2040
- 396,555 · +8.4%
- By 2050
- 412,723 · +12.8%
- By 2075
- 446,090 · +21.9%
- By 2100
- 436,193 · +19.2%
Race, ethnicity, and origin ACS 2023
- Neighborhood character
- Majority White (63%)
- Race & ethnicity
- White 63% Hispanic / Latino 19% Black 14% Two or more races 12%
- Hispanic origin (detail)
- Mexican 6% Puerto Rican 9% Cuban 2%
- Common ancestry
- Lithuanian 2% Romanian 2% Slovak 2%
- Foreign-born
- 10% · Canada
- Languages at home
- 81% English-only · Spanish 16% Other Indo-European 1%
Political lean MEDSL · Marion
- 2024 margin
- Solid R (+31.6) · D 33.8% · R 65.5%
- 2008→2024 swing
- -20.0pp toward R · 2008: -11.6pp · 2024: -31.6pp
- All cycles
- 2024: R+31.6 2020: R+25.9 2016: R+26.2 2012: R+16.2 2008: R+11.6
Not yet ingested
- Civics
- —
Market trends
- HPI YoY
- ▼ -133.62%
- Current HPI
- 194.3857
- Rent YoY
- ▲ 11.12%
- Metro
- Ocala, FL
- State GDP YoY
- ▲ 3.28%
- F500 in state
- 36
Industry mix (Fortune 500 HQ in FL)
| Industry | F500 HQs | Revenue |
|---|---|---|
| Industrial Technology | 2 | $29B |
|
||
| Insurance | 2 | $17B |
|
||
| Retail | 1 | $60B |
|
||
| Technology Distribution | 1 | $58B |
|
||
| Homebuilding | 1 | $35B |
|
||
| Technology Manufacturing | 1 | $35B |
|
||
Price history
+1.0% since first listed3 events — show timeline
- 2026-04-13 Pending — Stellar MLS as Distributed by MLS Grid
- 2026-04-08 Price Changed $292,990 Stellar MLS as Distributed by MLS Grid
- 2026-03-31 Listed $289,990 Stellar MLS as Distributed by MLS Grid
Cash-flow waterfall
monthlySold comps — $/sqft
last 12 mo · ≤1 miLoading sold comps…