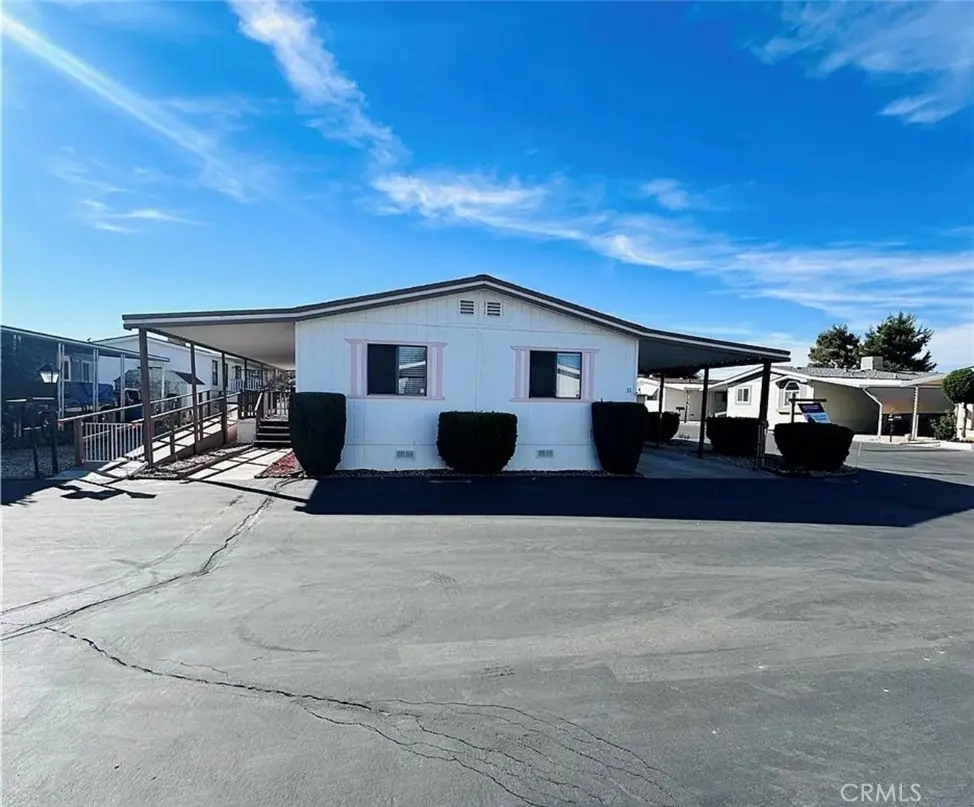
14000 El Evado #51 · Victorville, CA
Flood risk 1/10 · Minimal
- FEMA flood zone
- X (unshaded)
- Chance of flooding over 30 yrs
- 0.0%
- Est. flood insurance / yr
- $507 – $1,088
Fire risk 5/10 · Moderate
- Est. fire insurance / yr
- $659 – $1,223
Heat risk 7/10 · Major
- Hot days now (above 99°F)
- 1 days/yr
- Hot days in 30 yrs
- 3 days/yr
Wind risk 1/10 · Minimal
- Chance of severe wind over 30 yrs
- —
Air-quality risk 9/10 · Severe
- Unhealthy air days now
- 22 days/yr
- Unhealthy air days in 30 yrs
- 28 days/yr
Risk factors via First Street. Map © Google.
Why this score? — see what drove the C- grade
The composite is a weighted blend of 9 inputs, each scored 0–100. Each bar is that input's sub-score; the figure is the points it added to the 100-point composite (weight × sub-score).
- Cash flow +15.0/30.0
- ARV discount +15.0/15.0
- 1% rule +5.0/10.0
- DSCR +5.0/10.0
- Rent growth +2.9/5.0
- Livability +2.7/5.0
- Condition / age +2.5/5.0
- Schools +2.2/10.0
- Appreciation +0.0/10.0
$55,000
🖨 Deal sheet (PDF) 📄 Offer letter ✓ Due diligence
Listing remarks
Welcome home to this spacious 3-bedroom, 2-bath manufactured home offering 1,344 square feet of comfortable living in the lovely 55+ community of The Seasons in Victorville. From the moment you step inside, you’ll appreciate the bright, open layout and the sense of space this home provides. The living room is inviting and filled with natural light, creating a warm and relaxing atmosphere. The kitchen offers generous counter space, abundant cabinetry, and a convenient layout that makes cooking and entertaining a joy. Adjacent to the kitchen, the dining area is perfect for both everyday meals and gatherings with family and friends. The primary suite is a peaceful retreat with its own pr
Key facts
- Low maintenance yard
- Covered parking
- Private bath
Tags
Property features AI
Finance
- HOA & community: Senior community; Land lease of $950
Exterior
- Parking: Located in Seasons park
- Utilities: Public sewer; District/public water
- Home design: Single-story mobile home (Model 807); Mobile home remains on site; 12 ft by 56 ft structure; Entry on main level
- Construction: Year built per public records
- Exterior features: Community pool; Urban neighborhood with sidewalks
Interior
- Bathrooms: 2 full bathrooms
- Heating & cooling: Cooling by evaporative system; Heating (see remarks)
- Interior features: One-level home; Ground-floor entry
- Laundry & utility: Laundry inside in a dedicated room
Neighborhood map
What this means for you Summary
Snapshot
- This is a 3-bed/2.0-bath manufactured listed at $55k.
Deal economics
- At list price, monthly cash flow is $2k ($19k/yr) — positive.
- The deal already cash-flows at list — no discount required.
- Meets the 1% rule at list price ($2k rent vs $55k).
- Recommended offer: $53k (3.0% below list) — sets the bar for market timing.
- Cap rate 40.0% vs local median 4.2% in Victorville — top-decile yield for the area; either an underpriced asset or a hidden risk that comps aren't pricing in. Stress-test before assuming the spread holds.
Location & tenants
- Location reads 54/100 on livability (#906 in CA) — a working-class tenant base; expect higher turnover. Strengths: housing A+; Watch: employment D+, crime F, amenities F.
- Victor Elementary (urban): math 25% / reading 25% proficiency, ranked #408 of 517 in CA (top 79%) — low school quality limits family demand, transient renter base, plan for 1-2y turnover; 70% free/reduced lunch — lower-income household profile, screen leases tightly.
- Zoned schools: Liberty Elementary (980 students, 89% FRL); Imogene Garner Hook Junior High (1,000 students, 76% FRL); Silverado High (2,175 students, 59% FRL) — zoned schools at 75% FRL track the district average.
- Market conditions: Rents rising (+1.7%/yr); 374 active listings in the ZIP; 18 comparable units currently listed for rent nearby; rentals leasing fast (median 0d on market — plan ~1-2 weeks tenant-placement turnaround); solid renter incomes; 5,458 units permitted in San Bernardino County in 2024 (1,500 in 5+ unit buildings).
- This rent runs 33% of the median local income ($88k/yr) — at the standard rent-burdened threshold; future hikes will face affordability resistance.
Forward outlook
- Local home prices are declining (-3.0%/yr); year-one equity from $380 of loan paydown is wiped out by about $2k of value loss. Plan a longer hold.
- San Bernardino County population projected at +15% by 2050 — modest demand growth; plan on rents tracking national, not racing it.
- At projected returns (-3.0% appreciation + 1.7% rent growth), your $15k cash investment doubles in ~1 year — after that, you're playing with house money.
Negotiation context
- It's been on market 47 days — a 3% lower offer ($53k) is reasonable based on typical stale-listing flexibility.
- 5 sale attempts since 3y ago with the ask held roughly flat each time — persistent listings suggest the price (not the market) is what's stuck; bring a comps-based counter.
Risks & watch-outs
- Climate carrying-cost: moderate wildfire risk; extreme-heat days projected 1→3/yr by 2055 (HVAC capex compounding) — expect insurance premiums to compound above CPI over the hold.
Questions for the listing agent
- It's been on market 47 days. Have you received any prior offers? Is the seller open to a 3% concession, seller financing, or rate buy-down credit?
- Is there a deadline driving the sale (1031 exchange, divorce, estate, relocation)? That informs how much negotiation room exists.
- Schools are D-rated, which usually means shorter tenancies and higher turnover. Who's the typical renter profile here, and what's been the actual vacancy rate?
- Crime grade is F in this area — have there been break-ins, vandalism, or insurance claims at this property in the last 3 years? What carrier currently insures it and at what premium?
- What's the average days-on-market for RENTAL listings here right now (not sales)? A rising rental-DOM trend means longer vacancies and softer asking-rent achievability than the comps imply.
- What's the recent tenant-quality profile in this submarket — average credit score on applications, eviction rate, late-payment / NSF rate, and stable-employment percentage? A property-management company in the area should have these aggregated.
- How much new for-sale + rental construction is in the pipeline within 1–3 miles? Heavy new supply typically softens prices + rents 12–24 months out; constrained supply supports both.
Investment metrics
- 1% rule
- 4.35% ✓
- Cap rate
- 40.00%
- Cash-on-cash
- 120.39%
- DSCR
- 6.36
- GRM
- 1.9
CMA / ARV
- ARV (on-the-fly)
- $84,672
- Comps found
- 12
Show comp detail 12 sales within ~0.75 mi
| Address | Dist | Beds/Ba | Sqft | Sold | Price | $/sf | Match |
|---|---|---|---|---|---|---|---|
| 14000 El Evado Rd #12 | 0.00mi | 3/2.0 | 1,296 (-4%) | 12mo | $102,000 | $79 | 84 |
| 14000 El Evado Rd #70 | 0.00mi | 3/2.0 | 1,427 (+6%) | 13mo | $129,900 | $91 | 79 |
| 14000 El Evado Rd #65 | 0.00mi | 3/2.0 | 1,449 (+8%) | 10mo | $125,000 | $86 | 78 |
| 14000 El Evado Rd #100 | 0.00mi | 2/2.0 (-1) | 1,440 (+7%) | 10mo | $114,900 | $80 | 74 |
| 14000 El Evado Rd #30 | 0.00mi | 3/2.0 | 1,248 (-7%) | 23mo | $65,999 | $53 | 69 |
| 14000 El Evado Rd #77 | 0.00mi | 2/2.0 (-1) | 1,152 (-14%) | 4mo | $65,000 | $56 | 68 |
| 14000 El Evado Rd #19 | 0.00mi | 4/2.0 (+1) | 1,536 (+14%) | 5mo | $89,999 | $59 | 67 |
| 14000 El Evado Rd #87 | 0.00mi | 2/2.0 (-1) | 1,248 (-7%) | 20mo | $70,000 | $56 | 66 |
| 14000 El Evado Rd #44 | 0.00mi | 2/2.0 (-1) | 1,248 (-7%) | 20mo | $45,000 | $36 | 66 |
| 14000 El Evado Rd #17 | 0.00mi | 2/2.0 (-1) | 1,218 (-9%) | 22mo | $77,000 | $63 | 61 |
| 14000 El Evado Rd #96 | 0.00mi | 2/2.0 (-1) | 1,152 (-14%) | 22mo | $40,000 | $35 | 53 |
| 14580 Gravilla | 0.66mi | 3/2.0 | 1,248 (-7%) | 7mo | $326,000 | $261 | 51 |
Match score weights: distance 35% · size 25% · config 20% · recency 20%. Top-matched comps best support the ARV.
Projected returns pro-forma
-3.0% appreciation · 1.69% rent growth · sell at horizon
- IRR
- —
- Equity multiple
- 6.61×
- Total profit
- $86,394
- Equity at exit
- $8,201
- IRR
- —
- Equity multiple
- 13.31×
- Total profit
- $189,560
- Equity at exit
- $4,755
Cash invested: $15,400 (down + closing). Projections, not guarantees.
Landlord ↔ Tenant lean methodology
- Overall (STATE)
- 18 Strongly Tenant-Friendly
- State California
- 18 Strongly Tenant-Friendly · D+13
- County
- — inherits STATE
- City
- — inherits STATE
ZIP-level market 92392
- Home prices YoY
- -9.0%
- Rents YoY
- 1.7%
- Active inventory
- 374
- Price-to-rent
- 1.9×
Monthly cashflow live
- Estimated rent
- $2,392 high interval (Pro) →
- Mortgage (P&I)
- −$288
- Tax from tax record
- −$33 /mo · $399/yr
- Insurance
- −$23
- HOA
- −$0
- Vacancy / Maint / Mgmt
- −$502
- Net cashflow
- $1,545
Break-even live
Sensitivity live
| Price | -10% $1,576 | -5% $1,561 | +0% $1,545 | +5% $1,529 | +10% $1,514 |
|---|---|---|---|---|---|
| Rent | -10% $1,356 | -5% $1,451 | +0% $1,545 | +5% $1,640 | +10% $1,734 |
| Rate | -1.0pp $1,573 | -0.5pp $1,559 | base $1,545 | +0.5pp $1,531 | +1.0pp $1,516 |
UW: 25.0% down · 7.5% · 30yr · 1.5% tax · 5.0% vac · 8.0% maint · 8.0% mgmt
Financing live
Cash to close
- Down payment
- $13,750
- Closing costs
- $1,650
- Reserves months
- —
- Total cash needed
- —
Loan-product check · same deal, 3 products live
Conventional
25% down · 7.5% · 30yr
- Down + closing
- —
- Monthly P&I
- —
- Monthly cashflow
- —
- DSCR
- —
- Eligible?
- —
Personal DTI + credit; lowest rate.
DSCR
20% down · 8.5% · 30yr
- Down + closing
- —
- Monthly P&I
- —
- Monthly cashflow
- —
- DSCR
- —
- Eligible?
- —
No personal income docs; deal must DSCR.
Hard money
10% down · 12.0% · 12mo
- Down + closing
- —
- Monthly P&I
- —
- Monthly cashflow
- —
- DSCR
- —
- Eligible?
- —
Short-term bridge; refi at stabilization.
Rent comps 18 comps
| Address | Beds | Baths | Sqft | Rent | $/sqft | DOM | Units | Dist |
|---|---|---|---|---|---|---|---|---|
| 14450 El Evado Rd Victorville, CA | 2.0–3.0 | 1.0–2.0 | 895 | $2,075 | $2.32 | 0d | 7 | 0.40mi |
| 14485 Seneca Rd Victorville, CA | 2.0–3.0 | 2.0 | 1123 | $2,545 | $2.27 | 0d | 6 | 0.62mi |
| 13730 San Martin Rd Unit B Victorville, CA | 2.0 | 1.0 | 1000 | $1,500 | $1.50 | 25d | 1 | 0.70mi |
| 14440 Stivers Rd Victorville, CA | 3.0 | 2.0 | 994 | $1,950 | $1.96 | 11d | 1 | 0.83mi |
| 14610 Green River Rd Victorville, CA | 3.0 | 2.5 | 1493 | $2,595 | $1.74 | 0d | 1 | 0.84mi |
| 14451 Green River Rd Victorville, CA | 4.0 | 2.0 | 1842 | $2,200 | $1.19 | 0d | 1 | 0.91mi |
| 14374 Borego Rd Victorville, CA | 1.0–2.0 | 1.0–2.0 | 842 | $2,080 | $2.47 | 0d | 14 | 0.95mi |
| 14344 Mcart Rd Victorville, CA | 2.0–3.0 | 2.0 | 1042 | $2,395 | $2.30 | 0d | 4 | 0.95mi |
| 13489 Monterey Way Victorville, CA | 3.0 | 2.0 | 927 | $2,195 | $2.37 | 3d | 1 | 1.12mi |
| 13489 Monterey Way Victorville, CA | 3.0 | 2.0 | 927 | $2,195 | $2.37 | 0d | 1 | 1.12mi |
| 15230 Seneca Rd Victorville, CA | 1.0–3.0 | 1.0–2.0 | 805 | $1,990 | $2.47 | 0d | 10 | 1.15mi |
| 14861 Ann Dr Victorville, CA | 3.0 | 3.0 | 1657 | $2,395 | $1.45 | 0d | 1 | 1.18mi |
| 14304 Gray Fox Ln Victorville, CA | 3.0 | 2.5 | 1795 | $2,600 | $1.45 | 16d | 1 | 1.28mi |
| 14979 Buckskin Rd Victorville, CA | 3.0 | 2.0 | 1277 | $2,250 | $1.76 | 0d | 1 | 1.33mi |
| 13755 Hanford Ct Victorville, CA | 3.0 | 2.0 | 1867 | $2,397 | $1.28 | 0d | 1 | 1.35mi |
| 13629 Dry Creek Rd Victorville, CA | 3.0 | 2.0 | 1512 | $2,400 | $1.59 | 0d | 1 | 1.43mi |
| 15083 Brown Ln Victorville, CA | 4.0 | 2.0 | 1842 | $2,150 | $1.17 | 3d | 1 | 1.44mi |
| 15112 Brown Ln Victorville, CA | 3.0 | 2.0 | 1400 | $850 | $0.61 | 0d | 1 | 1.47mi |
Listing history 25 events
-
2026-06-21days on market $55,000 Active 47 DOM
-
2026-06-18days on market $55,000 Active 44 DOM
-
2026-06-17days on market $55,000 Active 43 DOM
-
2026-06-16days on market $55,000 Active 42 DOM
-
2026-06-15days on market $55,000 Active 41 DOM
-
2026-06-13days on market $55,000 Active 39 DOM
-
2026-06-13days on market $55,000 Active 38 DOM
-
2026-06-09days on market $55,000 Active 35 DOM
-
2026-06-08days on market $55,000 Active 34 DOM
-
2026-06-07days on market $55,000 Active 33 DOM
-
2026-06-04days on market $55,000 Active 30 DOM
-
2026-06-03days on market $55,000 Active 29 DOM
-
2026-06-02days on market $55,000 Active 28 DOM
-
2026-06-01days on market $55,000 Active 27 DOM
-
2026-05-31days on market $55,000 Active 26 DOM
-
2026-05-05$55,000 Active
-
2026-04-24historical
-
2026-04-20status Active
-
2026-03-20status Pending Sale
-
2025-12-10status Active
-
2025-11-25status Pending Sale
-
2025-10-26$57,000 Active
-
2024-06-08historical
-
2024-04-28price $65,000
-
2023-12-08$77,000 Active
ⓘ Source: listings_history table (triggers on properties + properties_extension) + one-shot
backfill from property_details.listing_events for pre-trigger history.
Tax reassessment forecast CA · Resets to sale price
- Current annual tax
- $399 · $33/mo
- Projected year-2 tax
- $418 · $35/mo
- Expected delta
- +$19/yr (+$2/mo · 4.7%)
ⓘ Screening estimate from a state-policy table — verify with the county assessor before closing.
Climate risk First Street
- Flood 1/10 Low FEMA zone X (unshaded) · 0% chance over 30 yrs
- Wildfire 5/10 Major
- Heat 7/10 Severe 1 d/yr ≥99°F today · 3 d/yr by 30 yrs out
- Wind 1/10 Low
- Air quality 9/10 Extreme 22 unhealthy d/yr today · 28 by 30 yrs out
Nearby sold comps map
Loading sold comps map…
Walkable amenities ~0.75 mi
Loading nearby amenities…
Taxation est. · year 1
- Rental income
- $28,704
- − Mortgage interest
- −$3,081
- − Property taxes
- −$399
- − Insurance
- −$275
- − Repairs & maintenance
- −$2,296
- − Management
- −$2,296
- − Depreciation
- −$1,600
- Taxable income
- $18,756
- Est. tax owed @ 24.0%
- −$4,501
- After-tax cash flow
- $14,039/yr
For passive investors: Depreciation is non-cash, so a rental often shows a tax loss while cash-flowing — sheltering income. Rental losses are passive: they offset passive income freely, and up to $25,000/yr can offset ordinary (W-2) income if you actively participate and your MAGI is under $100k (phasing out to $0 by $150k); unused losses carry forward. On sale, claimed depreciation is recaptured at up to 25%, and gains may owe capital-gains tax (a 1031 exchange can defer both). Figures are a year-1 estimate at your 24.0% rate — not tax advice; consult a CPA.
Schools (NCES district)
- District
- Victor Elementary
- NCES district ID
- 0641040
- Math proficiency
- 25% ▬ 0.00%
- Reading proficiency
- 25% ▼ -9.00%
- Median HH income
- $44,949
- Composite
- 21.58/100
- National rank
- #8304
- State rank
- #408 of 517 in CA
Livability — Victorville
- Score
- 54/100
- State rank
- #906
- US rank
- #24038
Category grades
Schools grade is shown separately in the Schools card above.
Census & demographics
- Census place
- Victorville, CA
- County
- San Bernardino County · 2,030,291 people
- City population
- 154,418
- Metro
- Riverside-San Bernardino-Ontario, CA
- Population (ZIP)
- 65,429
- Household income
- $87,681
- Rent vs Own
- Severe rent burden
- 1879.0
Population outlook (San Bernardino County) Hauer SSP2
- Today (2025)
- 2,300,329 people
- By 2030
- 2,378,907 · +3.4%
- By 2040
- 2,523,137 · +9.7%
- By 2050
- 2,642,388 · +14.9%
- By 2075
- 2,880,769 · +25.2%
- By 2100
- 2,909,436 · +26.5%
Race, ethnicity, and origin ACS 2023
- Neighborhood character
- Diverse neighborhood (Simpson 0.62)
- Race & ethnicity
- Hispanic / Latino 55% Two or more races 24% White 22% Black 14% Asian 4% Native American 2%
- Hispanic origin (detail)
- Mexican 47%
- Common ancestry
- Portuguese 1% Romanian 1%
- Foreign-born
- 20% · Canada, China, Vietnam
- Languages at home
- 57% English-only · Spanish 38% Tagalog/Filipino 2% Other Indo-European 1%
Political lean MEDSL · San Bernardino
- 2024 margin
- Toss-up / Even · D 47.5% · R 49.7% · Other 2.8%
- 2008→2024 swing
- -8.5pp toward R · 2008: 6.3pp · 2024: -2.1pp
- All cycles
- 2024: R+2.1 2020: D+10.7 2016: D+9.8 2012: D+5.4 2008: D+6.3
Not yet ingested
- Civics
- —
Market trends
- HPI YoY
- ▼ -35.57%
- Current HPI
- 358.5152
- Rent YoY
- ▲ 1.69%
- Metro
- Riverside-San Bernardino-Ontario, CA
- State GDP YoY
- ▲ 3.21%
- F500 in state
- 116
Industry mix (Fortune 500 HQ in CA)
| Industry | F500 HQs | Revenue |
|---|---|---|
| Technology | 27 | $1,492B |
|
||
| Financial Services | 3 | $174B |
|
||
| Retail | 3 | $44B |
|
||
| Insurance | 3 | $26B |
|
||
| Media / Entertainment | 2 | $115B |
|
||
| Pharmaceuticals / Biotech | 2 | $62B |
|
||
Price history
-28.6% since first listed10 events — show timeline
- 2026-05-05 Listed $55,000 CRMLS
- 2026-04-24 Listing Removed — CRMLS
- 2026-04-20 Relisted — CRMLS
- 2026-03-20 Pending — CRMLS
- 2025-12-10 Relisted — CRMLS
- 2025-11-25 Pending — CRMLS
- 2025-10-26 Listed $57,000 CRMLS
- 2024-06-08 Listing Removed — CRMLS
- 2024-04-28 Price Changed $65,000 CRMLS
- 2023-12-08 Listed $77,000 CRMLS
Property tax history
+0.6%/yrLatest (2025): $399 · +5.1% YoY. Source: county tax records.
Cash-flow waterfall
monthlySold comps — $/sqft
last 12 mo · ≤1 miLoading sold comps…