4940 Sunnyside Rd S Unit B-8 · Salem, OR
Flood risk 1/10 · Minimal
- FEMA flood zone
- X (unshaded)
- Chance of flooding over 30 yrs
- 0.0%
- Est. flood insurance / yr
- $507 – $1,088
Fire risk 2/10 · Minimal
- Est. fire insurance / yr
- $498 – $926
Heat risk 3/10 · Minor
- Hot days now (above 91°F)
- 7 days/yr
- Hot days in 30 yrs
- 14 days/yr
Wind risk 1/10 · Minimal
- Chance of severe wind over 30 yrs
- —
Air-quality risk 9/10 · Severe
- Unhealthy air days now
- 12 days/yr
- Unhealthy air days in 30 yrs
- 13 days/yr
Risk factors via First Street. Map © Google.
Why this score? — see what drove the B grade
The composite is a weighted blend of 9 inputs, each scored 0–100. Each bar is that input's sub-score; the figure is the points it added to the 100-point composite (weight × sub-score).
- Cash flow +30.0/30.0
- 1% rule +10.0/10.0
- DSCR +10.0/10.0
- ARV discount +7.5/15.0
- Livability +4.0/5.0
- Schools +3.7/10.0
- Rent growth +2.9/5.0
- Condition / age +2.5/5.0
- Appreciation +0.0/10.0
$60,000
🖨 Deal sheet 📄 Offer letter ✓ Due diligence
Listing remarks MLS
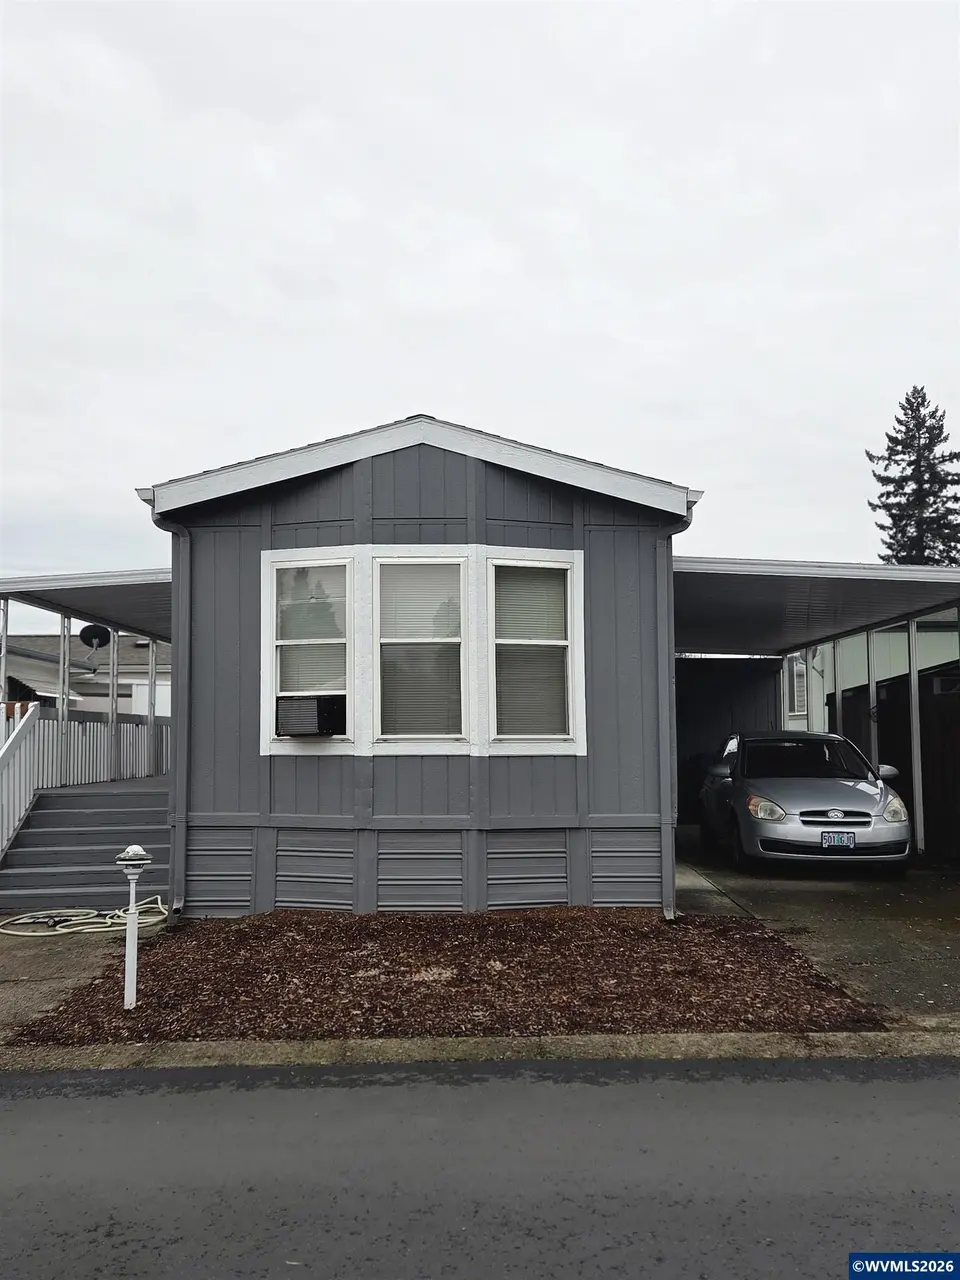
Updated flooring. Updated kitchen and bathroom. Cozy Single wide. Open space for kitchen table and living room with great outside light from big windows. Big covered deck to enjoy outside. Shed with ample storage. Nice gym/rec room for residents as well as a multi use building with kitchen. There is also a beautiful park with tables and benches for walking, sitting or gatherings. All a short walking distance from this unit. RV Storage area for extra charge.
Key facts
- Gym rec room
- Updated flooring
- Updated kitchen
Tags
Neighborhood map
What this means for you Summary
Snapshot
- This is a 1-bed/1.0-bath manufactured listed at $60k.
Deal economics
- At list price, monthly cash flow is $567 ($7k/yr) — positive.
- The deal already cash-flows at list — no discount required.
- Meets the 1% rule at list price ($1k rent vs $60k).
- Recommended offer: $53k (12.0% below list) — sets the bar for market timing.
- Cap rate 17.6% vs local median 2.9% in Salem — top-decile yield for the area; either an underpriced asset or a hidden risk that comps aren't pricing in. Stress-test before assuming the spread holds.
Location & tenants
- Location reads 79/100 on livability (#59 in OR, #2,084 nationally) — a middle-class / working-renter tenant base. Strengths: amenities A+, commute A+, housing A+; Watch: schools D, crime F.
- Salem-Keizer SD 24J (urban): math 34% / reading 47% proficiency, ranked #103 of 183 in OR (top 56%) — families likely to look elsewhere, expect single-tenant / working-renter base with shorter leases.
- Market conditions: Rents rising (+1.6%/yr); 272 active listings in the ZIP; 34 comparable units currently listed for rent nearby; rentals at typical pace (median 23d on market — plan ~3-4 weeks tenant-placement turnaround); 44% of comp listings sitting > 30 days — soft ceiling on asking rent; solid renter incomes; 1,591 units permitted in Marion County in 2024 (716 in 5+ unit buildings).
- This rent is only 14% of the median local income ($102k/yr) — well below the 30% rent-burden line; pricing power to push rent on renewal without tenant pushback.
Forward outlook
- Local home prices are declining (-3.0%/yr); year-one equity from $415 of loan paydown is wiped out by about $2k of value loss. Plan a longer hold.
- Marion County population projected at +17% by 2050 — long-run rental-demand tailwind backs the buy-and-hold thesis.
- At projected returns (-3.0% appreciation + 1.6% rent growth), your $17k cash investment doubles in ~3 years — after that, you're playing with house money.
Negotiation context
- It's been on market 127 days — a 12% lower offer ($53k) is reasonable based on typical stale-listing flexibility.
- 3 sale attempts since 9y ago with the ask held roughly flat each time — persistent listings suggest the price (not the market) is what's stuck; bring a comps-based counter.
- Current owner paid $10k; list at $60k implies a 500% gain — meaningful room to come down on a strong offer.
Questions for the listing agent
- It's been on market 127 days. Have you received any prior offers? Is the seller open to a 12% concession, seller financing, or rate buy-down credit?
- Why hasn't it sold? Are there any deal-killer items the seller is aware of (foundation, flood, title, zoning, code violations)?
- Is there a deadline driving the sale (1031 exchange, divorce, estate, relocation)? That informs how much negotiation room exists.
- Schools are D-rated, which usually means shorter tenancies and higher turnover. Who's the typical renter profile here, and what's been the actual vacancy rate?
- Crime grade is F in this area — have there been break-ins, vandalism, or insurance claims at this property in the last 3 years? What carrier currently insures it and at what premium?
- What's the average days-on-market for RENTAL listings here right now (not sales)? A rising rental-DOM trend means longer vacancies and softer asking-rent achievability than the comps imply.
- What's the recent tenant-quality profile in this submarket — average credit score on applications, eviction rate, late-payment / NSF rate, and stable-employment percentage? A property-management company in the area should have these aggregated.
- How much new for-sale + rental construction is in the pipeline within 1–3 miles? Heavy new supply typically softens prices + rents 12–24 months out; constrained supply supports both.
Investment metrics
- 1% rule
- 2.01% ✓
- Cap rate
- 17.63%
- Cash-on-cash
- 40.50%
- DSCR
- 2.80
- GRM
- 4.1
CMA / ARV
No comps found within radius.
Projected returns pro-forma
-3.0% appreciation · 1.64% rent growth · sell at horizon
- IRR
- 35.4%
- Equity multiple
- 2.47×
- Total profit
- $24,764
- Equity at exit
- $8,946
- IRR
- 41.5%
- Equity multiple
- 4.66×
- Total profit
- $61,570
- Equity at exit
- $5,188
Cash invested: $16,800 (down + closing). Projections, not guarantees.
Landlord ↔ Tenant lean methodology
- Overall (STATE)
- 28 Tenant-Leaning
- State Oregon
- 28 Tenant-Leaning · D+6
- County
- — inherits STATE
- City
- — inherits STATE
ZIP-level market 97306
- Rents YoY
- 1.6%
- Active inventory
- 272
- Price-to-rent
- 4.1×
Monthly cashflow live
- Estimated rent
- $1,205 high interval (Pro) →
- Mortgage (P&I)
- −$315
- Tax from tax record
- −$45 /mo · $543/yr
- Insurance
- −$25
- HOA
- −$0
- Vacancy / Maint / Mgmt
- −$253
- Net cashflow
- $567
Break-even live
UW: 25.0% down · 7.5% · 30yr · 1.5% tax · 5.0% vac · 8.0% maint · 8.0% mgmt
Financing live
Cash to close
- Down payment
- $15,000
- Closing costs
- $1,800
- Reserves months
- —
- Total cash needed
- —
Loan-product check · same deal, 3 products live
Conventional
25% down · 7.5% · 30yr
- Down + closing
- —
- Monthly P&I
- —
- Monthly cashflow
- —
- DSCR
- —
- Eligible?
- —
Personal DTI + credit; lowest rate.
DSCR
20% down · 8.5% · 30yr
- Down + closing
- —
- Monthly P&I
- —
- Monthly cashflow
- —
- DSCR
- —
- Eligible?
- —
No personal income docs; deal must DSCR.
Hard money
10% down · 12.0% · 12mo
- Down + closing
- —
- Monthly P&I
- —
- Monthly cashflow
- —
- DSCR
- —
- Eligible?
- —
Short-term bridge; refi at stabilization.
Rent comps 34 comps
| Address | Beds | Baths | Sqft | Rent | $/sqft | DOM | Units | Dist |
|---|---|---|---|---|---|---|---|---|
| 4810 Sunnyside Rd SE Salem, OR | 1.0–3.0 | 1.0 | 737 | $1,025 | $1.39 | 13d | 1 | 0.09mi |
| 1253 Royvonne Ave SE Unit 03 Salem, OR | 2.0 | 1.0 | 700 | $1,150 | $1.64 | 23d | 1 | 0.28mi |
| 1253 Royvonne Ave SE Unit 29 Salem, OR | 2.0 | 1.0 | 700 | $1,175 | $1.68 | 23d | 1 | 0.28mi |
| 1253 Royvonne Ave SE Salem, OR | 2.0 | 1.0 | 700 | $1,162 | $1.66 | 43d | 4 | 0.28mi |
| 1194 Barnes Ave SE Salem, OR | 1.0–2.0 | 1.0 | 807 | $1,399 | $1.73 | 13d | 3 | 0.29mi |
| 4352 10th Ct SE Unit 4357 Salem, OR | 2.0 | 1.0 | 750 | $1,100 | $1.47 | 43d | 1 | 0.51mi |
| 1040 Lansford Dr SE Unit 1038 Salem, OR | 1.0 | 1.0 | 558 | $1,149 | $2.06 | 23d | 1 | 0.56mi |
| 1040 Lansford Dr SE Unit 1020 Salem, OR | 1.0 | 1.0 | 558 | $1,150 | $2.06 | 21d | 1 | 0.56mi |
| 1040 Lansford Dr SE Unit 1012 Salem, OR | 1.0 | 1.0 | 558 | $1,149 | $2.06 | 43d | 1 | 0.56mi |
| 5463-5487 Commercial St SE Unit 46 Salem, OR | 1.0 | 1.0 | 687 | $1,095 | $1.59 | 23d | 1 | 0.65mi |
| 5775 Commercial St SE Salem, OR | 1.0–3.0 | 1.0–2.0 | 779 | $1,645 | $2.11 | 23d | 17 | 1.15mi |
| 5775 Commercial St SE Salem, OR | 1.0–3.0 | 1.0–2.0 | 779 | $1,575 | $2.02 | 13d | 47 | 1.15mi |
| 4950 Liberty Rd S Unit 56 Salem, OR | 1.0 | 1.0 | 700 | $1,095 | $1.56 | 43d | 1 | 1.21mi |
| 5952 Park Ct SE Salem, OR | 1.0–2.0 | 1.0 | 742 | $1,129 | $1.52 | 13d | 11 | 1.22mi |
| 158 Friendship Ave SE Unit 158-08 Salem, OR | 1.0 | 1.0 | 572 | $1,095 | $1.91 | 43d | 1 | 1.22mi |
| 1162 Harris St SE Salem, OR | 2.0 | 1.0 | 700 | $1,295 | $1.85 | 43d | 1 | 1.24mi |
| 1807 Wiltsey Rd SE Salem, OR | 1.0–2.0 | 1.0–2.0 | 845 | $1,460 | $1.73 | 13d | 6 | 1.25mi |
| 127 Hrubetz Rd SE Unit 127C Salem, OR | 1.0 | 1.0 | 550 | $995 | $1.81 | 43d | 1 | 1.25mi |
| 113 Hrubetz Rd SE Unit 113A Salem, OR | 1.0 | 1.0 | 550 | $995 | $1.81 | 23d | 1 | 1.25mi |
| 3955 Outward Rd SE Salem, OR | 1.0–3.0 | 1.0–2.0 | 970 | $1,399 | $1.44 | 13d | 20 | 1.26mi |
| 120 Hrubetz Rd SE Salem, OR | 1.0 | 1.0 | 602 | $1,350 | $2.24 | 43d | 1 | 1.26mi |
| 4954 Liberty Rd S Salem, OR | 1.0 | 1.0 | 700 | $1,095 | $1.56 | 43d | 1 | 1.27mi |
| 4954 Liberty Rd S Salem, OR | 1.0 | 1.0 | 700 | $1,095 | $1.56 | 23d | 1 | 1.27mi |
| 133 Hrubetz Rd SE Unit 133B Salem, OR | 1.0 | 1.0 | 550 | $995 | $1.81 | 43d | 1 | 1.27mi |
| 4946 Liberty Rd S Unit 10 Salem, OR | 1.0 | 1.0 | 700 | $1,095 | $1.56 | 43d | 1 | 1.27mi |
| 122 Hrubetz Rd SE Salem, OR | 1.0–2.0 | 1.0–2.0 | 818 | $1,485 | $1.81 | 23d | 1 | 1.27mi |
| 4892 Liberty Rd S Salem, OR | 1.0–2.0 | 1.0 | 806 | $1,275 | $1.58 | 13d | 12 | 1.28mi |
| 3962 Liberty Rd S Unit 3962 Salem, OR | 1.0 | 1.0 | 725 | $995 | $1.37 | 43d | 1 | 1.35mi |
| 701 Lockwood Ln S Salem, OR | 1.0 | 1.0 | 610 | $1,395 | $2.29 | 43d | 1 | 1.36mi |
| 701 Lockwood Ln S Unit 711 Salem, OR | 1.0 | 1.0 | 600 | $1,250 | $2.08 | 43d | 1 | 1.36mi |
| 701 Lockwood Ln S Unit 703 Salem, OR | 1.0 | 1.0 | 450 | $1,150 | $2.56 | 43d | 1 | 1.36mi |
| 1691 Waln Dr SE Salem, OR | 1.0–2.0 | 1.0–2.0 | 955 | $1,399 | $1.46 | 13d | 6 | 1.41mi |
| 4788 Skyline Rd S Salem, OR | 1.0 | 1.0 | 620 | $1,125 | $1.81 | 13d | 1 | 1.47mi |
| 3869 Liberty Rd S Salem, OR | 1.0 | 1.0 | 690 | $1,250 | $1.81 | 13d | 2 | 1.49mi |
Listing history 24 events
-
2026-06-18days on market $60,000 Active 127 DOM
-
2026-06-17days on market $60,000 Active 126 DOM
-
2026-06-16days on market $60,000 Active 125 DOM
-
2026-06-15days on market $60,000 Active 124 DOM
-
2026-06-14days on market $60,000 Active 122 DOM
-
2026-06-10days on market $60,000 Active 119 DOM
-
2026-06-09days on market $60,000 Active 118 DOM
-
2026-06-08days on market $60,000 Active 117 DOM
-
2026-06-07remarks 487-char remark
-
2026-06-07days on market $60,000 Active 116 DOM
-
2026-06-03days on market $60,000 Active 112 DOM
-
2026-06-02days on market $60,000 Active 111 DOM
-
2026-06-01days on market $60,000 Active 110 DOM
-
2026-05-31days on market $60,000 Active 109 DOM
-
2026-05-30days on market $60,000 Active 108 DOM
-
2026-02-06$60,000 Active 461-char remark
Show marketing remark (461 chars)
Updated flooring. Updated kitchen and bathroom. Cozy Single wide. Open space for kitchen table and living room with great outside light from big windows. Big covered deck to enjoy outside. Shed with ample storage. Nice gym/rec room for residents as well as a multi use building with kitchen. There is also a beautiful park with tables and benches for walking, sitting or gatherings. All a short walking distance from this unit. RV Storage area for extra charge.
-
2017-03-07soldstatus $10,000 Sold 145-char remark
Show marketing remark (145 chars)
Sweet single wide manufacture home. Large covered front deck, carport with storage shed. 55+ park rent $406.00 includes water, sewer and garbage.
-
2017-03-03status Pending 145-char remark
Show marketing remark (145 chars)
Sweet single wide manufacture home. Large covered front deck, carport with storage shed. 55+ park rent $406.00 includes water, sewer and garbage.
-
2017-02-27historical Active under Contract 145-char remark
Show marketing remark (145 chars)
Sweet single wide manufacture home. Large covered front deck, carport with storage shed. 55+ park rent $406.00 includes water, sewer and garbage.
-
2017-02-22price $10,000 145-char remark
Show marketing remark (145 chars)
Sweet single wide manufacture home. Large covered front deck, carport with storage shed. 55+ park rent $406.00 includes water, sewer and garbage.
-
2017-02-06status Active 145-char remark
Show marketing remark (145 chars)
Sweet single wide manufacture home. Large covered front deck, carport with storage shed. 55+ park rent $406.00 includes water, sewer and garbage.
-
2017-02-01status Pending 145-char remark
Show marketing remark (145 chars)
Sweet single wide manufacture home. Large covered front deck, carport with storage shed. 55+ park rent $406.00 includes water, sewer and garbage.
-
2017-01-25historical Active under Contract 145-char remark
Show marketing remark (145 chars)
Sweet single wide manufacture home. Large covered front deck, carport with storage shed. 55+ park rent $406.00 includes water, sewer and garbage.
-
2017-01-23$13,900 Active 145-char remark
Show marketing remark (145 chars)
Sweet single wide manufacture home. Large covered front deck, carport with storage shed. 55+ park rent $406.00 includes water, sewer and garbage.
ⓘ Source: listings_history table (triggers on properties + properties_extension) + one-shot
backfill from property_details.listing_events for pre-trigger history.
Tax reassessment forecast OR · Resets to sale price
- Current annual tax
- $543 · $45/mo
- Projected year-2 tax
- $582 · $48/mo
- Expected delta
- +$39/yr (+$3/mo · 7.1%)
ⓘ Screening estimate from a state-policy table — verify with the county assessor before closing.
Climate risk First Street
- Flood 1/10 Low FEMA zone X (unshaded) · 0% chance over 30 yrs
- Wildfire 2/10 Low
- Heat 3/10 Moderate 7 d/yr ≥91°F today · 14 d/yr by 30 yrs out
- Wind 1/10 Low
- Air quality 9/10 Extreme 12 unhealthy d/yr today · 13 by 30 yrs out
Nearby sold comps map
Loading sold comps map…
Walkable amenities ~0.75 mi
Loading nearby amenities…
Taxation est. · year 1
- Rental income
- $14,460
- − Mortgage interest
- −$3,361
- − Property taxes
- −$543
- − Insurance
- −$300
- − Repairs & maintenance
- −$1,157
- − Management
- −$1,157
- − Depreciation
- −$1,745
- Taxable income
- $6,197
- Est. tax owed @ 24.0%
- −$1,487
- After-tax cash flow
- $5,317/yr
For passive investors: Depreciation is non-cash, so a rental often shows a tax loss while cash-flowing — sheltering income. Rental losses are passive: they offset passive income freely, and up to $25,000/yr can offset ordinary (W-2) income if you actively participate and your MAGI is under $100k (phasing out to $0 by $150k); unused losses carry forward. On sale, claimed depreciation is recaptured at up to 25%, and gains may owe capital-gains tax (a 1031 exchange can defer both). Figures are a year-1 estimate at your 24.0% rate — not tax advice; consult a CPA.
Schools (NCES district)
- District
- Salem-Keizer SD 24J
- NCES district ID
- 4110820
- Math proficiency
- 34% ▼ -1.00%
- Reading proficiency
- 47% ▼ -2.00%
- Median HH income
- $48,632
- Composite
- 37.16/100
- National rank
- #9017
- State rank
- #103 of 183 in OR
Livability — Salem
- Score
- 79/100
- State rank
- #59
- US rank
- #2084
Category grades
Schools grade is shown separately in the Schools card above.
Census & demographics
- Census place
- Salem, OR
- County
- Marion County · 258,219 people
- City population
- 193,601
- Metro
- Salem, OR
- Population (ZIP)
- 34,383
- Household income
- $101,753
- Rent vs Own
- Severe rent burden
- 1437.0
Population outlook (Marion County) Hauer SSP2
- Today (2025)
- 360,940 people
- By 2030
- 375,178 · +3.9%
- By 2040
- 400,914 · +11.1%
- By 2050
- 422,187 · +17.0%
- By 2075
- 460,305 · +27.5%
- By 2100
- 464,025 · +28.6%
Race, ethnicity, and origin ACS 2023
- Neighborhood character
- Predominantly White (74%)
- Race & ethnicity
- White 74% Hispanic / Latino 12% Two or more races 9% Asian 5% Pacific Islander 2% Black 1%
- Hispanic origin (detail)
- Mexican 9%
- Common ancestry
- Italian 6% Portuguese 5% Slovak 3%
- Foreign-born
- 8% · Canada, China, Vietnam
- Languages at home
- 86% English-only · Spanish 6% Other Asian/Pacific 3% Russian/Polish/Slavic 1%
Political lean MEDSL · Marion
- 2024 margin
- Toss-up / Even · D 47.5% · R 49.5% · Other 3.0%
- 2008→2024 swing
- -4.2pp toward R · 2008: 2.2pp · 2024: -2.0pp
- All cycles
- 2024: R+2.0 2020: D+1.1 2016: R+5.0 2012: R+3.5 2008: D+2.2
Not yet ingested
- Civics
- —
Market trends
- HPI YoY
- ▼ -335.25%
- Current HPI
- 279.7875
- Rent YoY
- ▲ 1.64%
- Metro
- Salem, OR
- State GDP YoY
- ▲ 2.05%
- F500 in state
- 2
Industry mix (Fortune 500 HQ in OR)
| Industry | F500 HQs | Revenue |
|---|---|---|
| Consumer Goods | 1 | $51B |
|
||
Price history
+331.7% since first listed9 events — show timeline
- 2026-02-06 Listed $60,000 WVMLS
- 2017-03-07 Sold (MLS) $10,000 WVMLS
- 2017-03-03 Pending — WVMLS
- 2017-02-27 Contingent — WVMLS
- 2017-02-22 Price Changed $10,000 WVMLS
- 2017-02-06 Relisted — WVMLS
- 2017-02-01 Pending — WVMLS
- 2017-01-25 Contingent — WVMLS
- 2017-01-23 Listed $13,900 WVMLS
Property tax history
+5.1%/yrLatest (2025): $543 · +7.6% YoY. Source: county tax records.
Cash-flow waterfall
monthlySold comps — $/sqft
last 12 mo · ≤1 miLoading sold comps…