 🏷️ Likely Rental
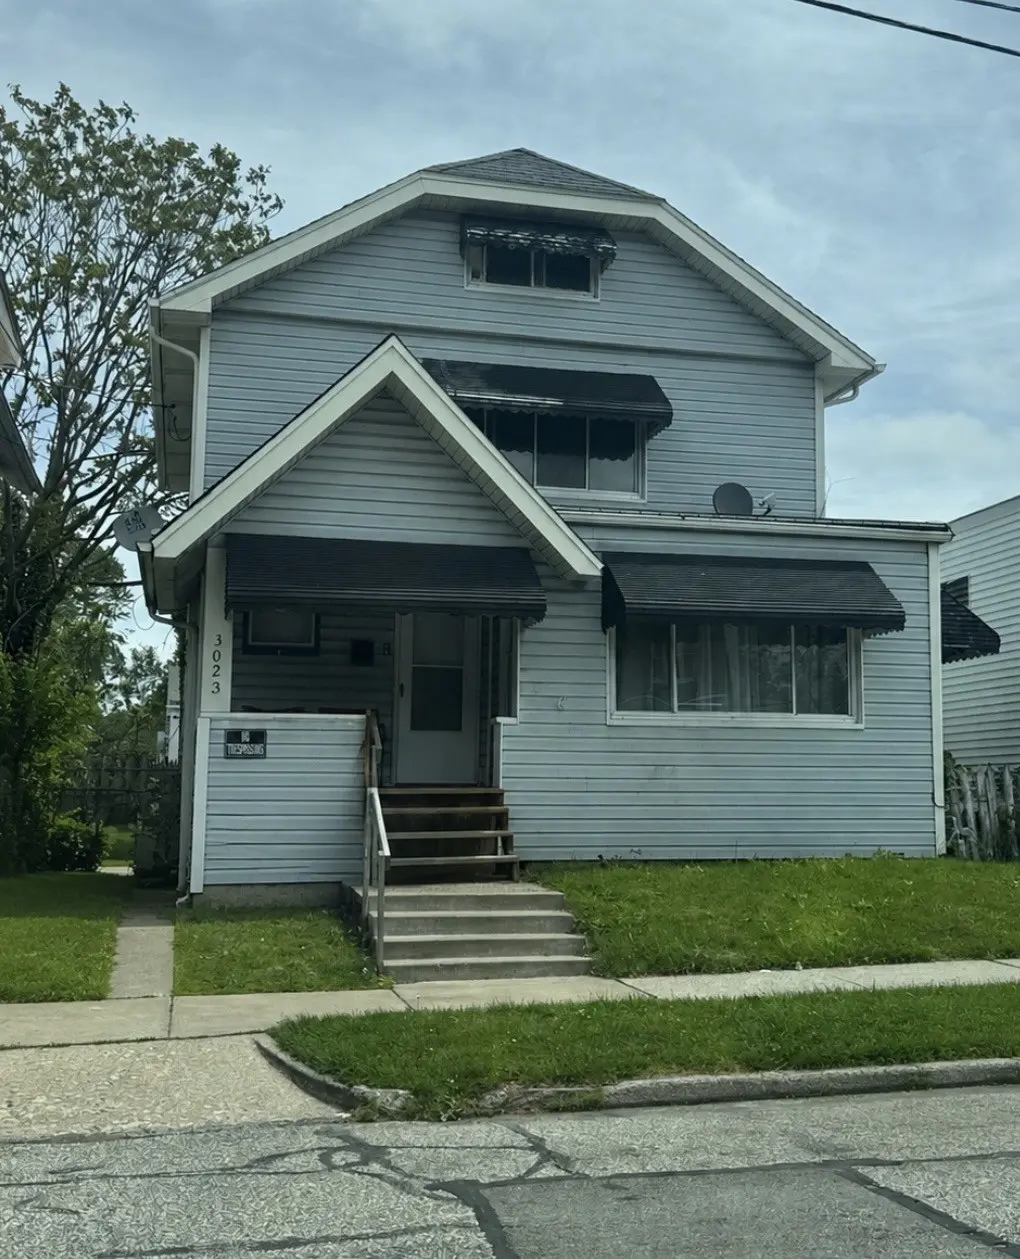
3023 French St · Erie, PA
Flood risk 1/10 · Minimal
- FEMA flood zone
- X (unshaded)
- Chance of flooding over 30 yrs
- 0.0%
- Est. flood insurance / yr
- $473 – $860
Fire risk 1/10 · Minimal
- Est. fire insurance / yr
- $511 – $949
Heat risk 3/10 · Minor
- Hot days now (above 90°F)
- 7 days/yr
- Hot days in 30 yrs
- 17 days/yr
Wind risk 1/10 · Minimal
- Chance of severe wind over 30 yrs
- —
Air-quality risk 2/10 · Minimal
- Unhealthy air days now
- 1 days/yr
- Unhealthy air days in 30 yrs
- 3 days/yr
Risk factors via First Street. Map © Google.
Why this score? — see what drove the D grade
The composite is a weighted blend of 9 inputs, each scored 0–100. Each bar is that input's sub-score; the figure is the points it added to the 100-point composite (weight × sub-score).
- ARV discount +15.0/15.0
- Cash flow +11.0/30.0
- Livability +4.2/5.0
- 1% rule +3.8/10.0
- DSCR +3.2/10.0
- Rent growth +2.5/5.0
- Condition / age +2.5/5.0
- Schools +1.3/10.0
- Appreciation +0.0/10.0
$125,000
🖨 Deal sheet (PDF) 📄 Offer letter ✓ Due diligence
Listing remarks MLS
Tenant occupied.
Key facts
- Charming curb appeal
- Large backyard
- Full basement
Tags
Property features AI
Exterior
- Utilities: Public water; Public sewer
- Home design: Single-family residence; Two levels; Residential property
- Construction: Aluminum siding and frame construction; Asphalt roof
- Exterior features: Level lot; Paved road access
Interior
- Flooring: Carpet
- Bathrooms: 1 full bathroom
- Heating & cooling: Forced air heating; No central cooling
- Interior features: Carpet flooring; Decorative fireplace (1); Full basement
Neighborhood map
What this means for you Summary
Snapshot
- This is a 3-bed/1.0-bath single-family listed at $125k.
Deal economics
- At list price, monthly cash flow is $-53 ($-631/yr) — negative.
- To cash-flow at today's rent, offer at most $116k (7.4% below list).
- To meet the 1% rule (rent ≥ 1% of price), the offer needs to be $110k (11.8% below list).
- Recommended offer: $110k (11.8% below list) — sets the bar for 1% rule.
Location & tenants
- Location reads 83/100 on livability (#109 in PA, #840 nationally) — a professional / high-income tenant draw. Strengths: amenities A+, commute A+, cost of living A+; Watch: crime D+, employment F.
- Erie City SD (urban): math 12% / reading 19% proficiency, ranked #510 of 539 in PA (top 95%) — low school quality limits family demand, transient renter base, plan for 1-2y turnover; 81% free/reduced lunch — lower-income household profile, screen leases tightly.
- Market conditions: 68 active listings in the ZIP; 10 comparable units currently listed for rent nearby; rentals lingering (median 45d on market — plan ~5-8 weeks vacancy on turnover, expect pricing pressure); 100% of comp listings sitting > 30 days — soft ceiling on asking rent; 364 units permitted in Erie County in 2024 (188 in 5+ unit buildings).
Forward outlook
- Local home prices are declining (-3.0%/yr); year-one equity from $864 of loan paydown is wiped out by about $4k of value loss. Plan a longer hold.
- Erie County population projected at -14% by 2050 — secular population decline; favor cash flow + early exit over multi-decade hold.
Negotiation context
- Only 3 days on market — expect competitive offers; lowballing is unlikely to land.
- 3 sale attempts since 9y ago with the ask held roughly flat each time — persistent listings suggest the price (not the market) is what's stuck; bring a comps-based counter.
- Current owner paid $80k; list at $125k implies a 56% gain — meaningful room to come down on a strong offer.
Risks & watch-outs
- Watch-outs: built in 1925 — expect roof / HVAC / electrical / plumbing capex.
Questions for the listing agent
- What do current leases actually rent for vs. the listed asking? Can we see a recent rent roll and the last 12 months of T-12 income?
- Built in 1925 — when were the roof, HVAC, electrical panel, plumbing, and water heater last replaced?
- Is there a deadline driving the sale (1031 exchange, divorce, estate, relocation)? That informs how much negotiation room exists.
- Crime grade is D in this area — have there been break-ins, vandalism, or insurance claims at this property in the last 3 years? What carrier currently insures it and at what premium?
- The area grade is low — what's the realistic commute time and amenity access for the typical tenant pool here? Any planned neighborhood developments (good or bad) we should know about?
- What's the average days-on-market for RENTAL listings here right now (not sales)? A rising rental-DOM trend means longer vacancies and softer asking-rent achievability than the comps imply.
- What's the recent tenant-quality profile in this submarket — average credit score on applications, eviction rate, late-payment / NSF rate, and stable-employment percentage? A property-management company in the area should have these aggregated.
- How much new for-sale + rental construction is in the pipeline within 1–3 miles? Heavy new supply typically softens prices + rents 12–24 months out; constrained supply supports both.
Investment metrics
- 1% rule
- 0.88% ✗
- Cap rate
- 5.79%
- Cash-on-cash
- -1.80%
- DSCR
- 0.92
- GRM
- 9.5
CMA / ARV
- ARV (on-the-fly)
- $160,080
- Comps found
- 12
Show comp detail 12 sales within ~0.75 mi
| Address | Dist | Beds/Ba | Sqft | Sold | Price | $/sf | Match |
|---|---|---|---|---|---|---|---|
| 248 Maiden Ln | 0.29mi | 3/1.0 | 1,349 (-3%) | 0mo | $175,950 | $130 | 81 |
| 242 E 32 St | 0.22mi | 3/1.0 | 1,336 (-4%) | 3mo | $75,201 | $56 | 80 |
| 239 E 25th St | 0.42mi | 3/1.0 | 1,404 (+1%) | 1mo | $77,500 | $55 | 78 |
| 3216 French St | 0.11mi | 3/1.0 | 1,220 (-12%) | 2mo | $175,000 | $143 | 72 |
| 3729 State St | 0.41mi | 4/2.0 (+1) | 1,461 (+5%) | 2mo | $241,000 | $165 | 62 |
| 3848 Eliot Rd | 0.65mi | 3/1.5 | 1,440 (+3%) | 2mo | $255,000 | $177 | 60 |
| 434 Stafford Ave | 0.65mi | 3/1.0 | 1,320 (-5%) | 1mo | $127,094 | $96 | 60 |
| 3322 Glenwood Park Ave | 0.58mi | 3/1.0 | 1,248 (-10%) | 1mo | $140,000 | $112 | 55 |
| 333 W 31 St | 0.53mi | 3/1.0 | 1,584 (+14%) | 1mo | $95,000 | $60 | 52 |
| 3711 State St | 0.38mi | 3/2.5 | 1,600 (+15%) | 0mo | $282,500 | $177 | 51 |
| 2684 Chestnut St | 0.60mi | 3/1.0 | 1,572 (+13%) | 1mo | $139,900 | $89 | 50 |
| 3001 Walnut St | 0.71mi | 3/1.0 | 1,248 (-10%) | 3mo | $143,000 | $115 | 47 |
Match score weights: distance 35% · size 25% · config 20% · recency 20%. Top-matched comps best support the ARV.
Projected returns pro-forma
-3.0% appreciation · 3.0% rent growth · sell at horizon
- IRR
- -19.2%
- Equity multiple
- 0.33×
- Total profit
- $-23,554
- Equity at exit
- $18,638
- IRR
- -11.8%
- Equity multiple
- 0.30×
- Total profit
- $-24,610
- Equity at exit
- $10,808
Cash invested: $35,000 (down + closing). Projections, not guarantees.
Landlord ↔ Tenant lean methodology
- Overall (STATE)
- 62 Landlord-Friendly
- State Pennsylvania
- 62 Landlord-Friendly · EVEN
- County
- — inherits STATE
- City
- — inherits STATE
ZIP-level market 16504
- Home prices YoY
- -17.9%
- Active inventory
- 68
- Price-to-rent
- 9.5×
Monthly cashflow live
- Estimated rent
- $1,102 high interval (Pro) →
- Mortgage (P&I)
- −$656
- Tax from tax record
- −$216 /mo · $2,587/yr
- Insurance
- −$52
- HOA
- −$0
- Vacancy / Maint / Mgmt
- −$231
- Net cashflow
- $-53
Break-even live
Sensitivity live
| Price | -10% $18 | -5% $-17 | +0% $-53 | +5% $-88 | +10% $-123 |
|---|---|---|---|---|---|
| Rent | -10% $-140 | -5% $-96 | +0% $-53 | +5% $-9 | +10% $34 |
| Rate | -1.0pp $10 | -0.5pp $-21 | base $-53 | +0.5pp $-85 | +1.0pp $-118 |
UW: 25.0% down · 7.5% · 30yr · 1.5% tax · 5.0% vac · 8.0% maint · 8.0% mgmt
Financing live
Cash to close
- Down payment
- $31,250
- Closing costs
- $3,750
- Reserves months
- —
- Total cash needed
- —
Loan-product check · same deal, 3 products live
Conventional
25% down · 7.5% · 30yr
- Down + closing
- —
- Monthly P&I
- —
- Monthly cashflow
- —
- DSCR
- —
- Eligible?
- —
Personal DTI + credit; lowest rate.
DSCR
20% down · 8.5% · 30yr
- Down + closing
- —
- Monthly P&I
- —
- Monthly cashflow
- —
- DSCR
- —
- Eligible?
- —
No personal income docs; deal must DSCR.
Hard money
10% down · 12.0% · 12mo
- Down + closing
- —
- Monthly P&I
- —
- Monthly cashflow
- —
- DSCR
- —
- Eligible?
- —
Short-term bridge; refi at stabilization.
Rent comps 10 comps
| Address | Beds | Baths | Sqft | Rent | $/sqft | DOM | Units | Dist |
|---|---|---|---|---|---|---|---|---|
| 115 W 32nd St Erie, PA | 3.0 | 2.0 | 1844 | $1,050 | $0.57 | 44d | 1 | 0.24mi |
| 126 W 38th St Erie, PA | 4.0 | 2.0 | 1850 | $4,000 | $2.16 | 44d | 1 | 0.51mi |
| 504 W 29th St Unit 2 Erie, PA | 3.0 | 1.0 | 1200 | $1,500 | $1.25 | 44d | 1 | 0.77mi |
| 614 E 22nd St Unit 1 Erie, PA | 3.0 | 1.0 | 1300 | $1,000 | $0.77 | 44d | 1 | 0.87mi |
| 3603 Maple St Erie, PA | 2.0 | 1.0 | 1200 | $1,000 | $0.83 | 44d | 1 | 0.98mi |
| 811 W 30th St Unit 1 Erie, PA | 2.0 | 1.0 | 900 | $1,175 | $1.31 | 44d | 1 | 1.13mi |
| 1022 W 30th St Unit 2 Erie, PA | 2.0 | 1.0 | 1000 | $850 | $0.85 | 44d | 1 | 1.36mi |
| 1610 Poplar St Unit Downstairs Erie, PA | 3.0 | 1.0 | 1200 | $875 | $0.73 | 44d | 1 | 1.36mi |
| 223 E 9th St Erie, PA | 2.0 | 2.0 | 1564 | $1,300 | $0.83 | 44d | 1 | 1.40mi |
| 923 Chestnut St Unit 2 Erie, PA | 4.0 | 2.0 | 1100 | $1,150 | $1.05 | 44d | 1 | 1.49mi |
Listing history 4 events
-
2026-06-07statusdays on market $125,000 Pending 3 DOM
-
2026-06-05days on market $125,000 Active 2 DOM
-
2026-06-03remarks 514-char remark
-
2026-06-03$125,000 Active 1 DOM
ⓘ Source: listings_history table (triggers on properties + properties_extension) + one-shot
backfill from property_details.listing_events for pre-trigger history.
Tax reassessment forecast PA · Partial reset (capped growth)
- Current annual tax
- $2,587 · $216/mo
- Projected year-2 tax
- $2,587 · $216/mo
- Expected delta
- $0/yr ($0/mo · 0.0%)
ⓘ Screening estimate from a state-policy table — verify with the county assessor before closing.
Climate risk First Street
- Flood 1/10 Low FEMA zone X (unshaded) · 0% chance over 30 yrs
- Wildfire 1/10 Low
- Heat 3/10 Moderate 7 d/yr ≥90°F today · 17 d/yr by 30 yrs out
- Wind 1/10 Low
- Air quality 2/10 Low 1 unhealthy d/yr today · 3 by 30 yrs out
Nearby sold comps map
Loading sold comps map…
Walkable amenities ~0.75 mi
Loading nearby amenities…
Taxation est. · year 1
- Rental income
- $13,224
- − Mortgage interest
- −$7,002
- − Property taxes
- −$2,587
- − Insurance
- −$625
- − Repairs & maintenance
- −$1,058
- − Management
- −$1,058
- − Depreciation
- −$3,636
- Taxable loss
- −$2,742
- Est. tax savings @ 24.0%
- +$658
- After-tax cash flow
- $27/yr
For passive investors: Depreciation is non-cash, so a rental often shows a tax loss while cash-flowing — sheltering income. Rental losses are passive: they offset passive income freely, and up to $25,000/yr can offset ordinary (W-2) income if you actively participate and your MAGI is under $100k (phasing out to $0 by $150k); unused losses carry forward. On sale, claimed depreciation is recaptured at up to 25%, and gains may owe capital-gains tax (a 1031 exchange can defer both). Figures are a year-1 estimate at your 24.0% rate — not tax advice; consult a CPA.
Schools (NCES district)
- District
- Erie City SD
- NCES district ID
- 4209300
- Math proficiency
- 12% ▼ -11.00%
- Reading proficiency
- 19% ▼ -16.00%
- Median HH income
- $33,625
- Composite
- 12.59/100
- National rank
- #9617
- State rank
- #510 of 539 in PA
Livability — Erie
- Score
- 83/100
- State rank
- #109
- US rank
- #840
Category grades
Schools grade is shown separately in the Schools card above.
Census & demographics
- Census place
- Erie, PA
- City population
- 92,215
- Population (ZIP)
- 15,632
Population outlook (Erie County) Hauer SSP2
- Today (2025)
- 272,159 people
- By 2030
- 266,299 · -2.2%
- By 2040
- 250,987 · -7.8%
- By 2050
- 234,925 · -13.7%
- By 2075
- 199,164 · -26.8%
- By 2100
- 162,985 · -40.1%
Race, ethnicity, and origin ACS 2023
- Neighborhood character
- Predominantly White (73%)
- Race & ethnicity
- White 73% Two or more races 12% Black 10% Hispanic / Latino 6% Asian 3%
- Hispanic origin (detail)
- Mexican 1% Puerto Rican 3%
- Common ancestry
- Romanian 17% Subsaharan African 2% American 2%
- Foreign-born
- 9% · Canada, India, China
- Languages at home
- 88% English-only · Russian/Polish/Slavic 5% Spanish 3% Other Indo-European 3%
Political lean MEDSL · Erie
- 2024 margin
- Toss-up / Even · D 49.0% · R 50.0%
- 2008→2024 swing
- -20.9pp toward R · 2008: 19.9pp · 2024: -1.0pp
- All cycles
- 2024: R+1.0 2020: D+1.0 2016: R+2.0 2012: D+16.9 2008: D+19.9
Not yet ingested
- Civics
- —
Market trends
- HPI YoY
- ▼ -56.54%
- Current HPI
- 260.1053
- Rent YoY
- —
- Metro
- —
- State GDP YoY
- ▲ 1.68%
- F500 in state
- 34
Industry mix (Fortune 500 HQ in PA)
| Industry | F500 HQs | Revenue |
|---|---|---|
| Healthcare | 2 | $309B |
|
||
| Insurance | 2 | $27B |
|
||
| Telecommunications / Media | 1 | $124B |
|
||
| Industrial Distribution | 1 | $22B |
|
||
| Financial Services | 1 | $20B |
|
||
| Chemicals / Materials | 1 | $18B |
|
||
Price history
+296.2% since first listed8 events — show timeline
- 2026-06-02 Listed $125,000 GEBOR
- 2024-06-14 Sold (MLS) $80,000 GEBOR
- 2024-05-13 Delisted — GEBOR
- 2024-05-11 Listed $75,000 GEBOR
- 2017-09-20 Listed $49,900 GEBOR
- 2014-07-07 Sold (Public Records) $51,318 Public Records
- 1991-04-25 Sold (Public Records) $32,000 Public Records
- 1977-11-28 Sold (Public Records) $31,550 Public Records
Property tax history
+1.9%/yrLatest (2026): $2,587 · +3.4% YoY. Source: county tax records.
Cash-flow waterfall
monthlySold comps — $/sqft
last 12 mo · ≤1 miLoading sold comps…