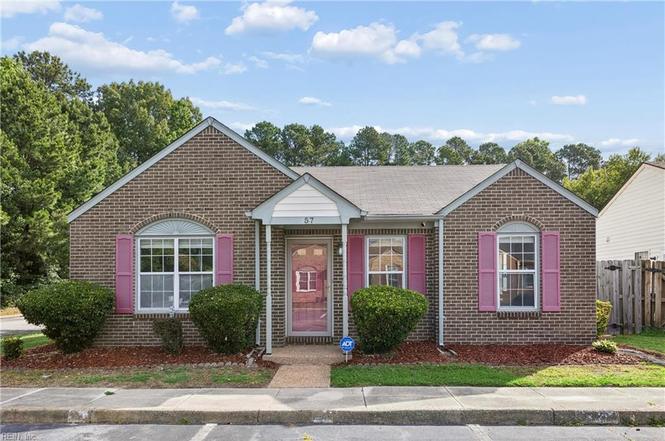
57 N Lake Loop · Hampton, VA
Flood risk 1/10 · Minimal
- FEMA flood zone
- X (unshaded)
- Chance of flooding over 30 yrs
- 0.0%
- Est. flood insurance / yr
- $507 – $1,088
Fire risk 3/10 · Minor
- Est. fire insurance / yr
- $666 – $1,236
Heat risk 9/10 · Severe
- Hot days now (above 105°F)
- 7 days/yr
- Hot days in 30 yrs
- 17 days/yr
Wind risk 8/10 · Major
- Chance of severe wind over 30 yrs
- 80.0%
Air-quality risk 2/10 · Minimal
- Unhealthy air days now
- 2 days/yr
- Unhealthy air days in 30 yrs
- 2 days/yr
Risk factors via First Street. Map © Google.
Why this score? — see what drove the D+ grade
The composite is a weighted blend of 9 inputs, each scored 0–100. Each bar is that input's sub-score; the figure is the points it added to the 100-point composite (weight × sub-score).
- ARV discount +14.1/15.0
- Cash flow +10.8/30.0
- Schools +5.5/10.0
- Livability +3.8/5.0
- Rent growth +3.5/5.0
- DSCR +3.1/10.0
- 1% rule +3.0/10.0
- Condition / age +2.5/5.0
- Appreciation +0.0/10.0
$245,900
🖨 Deal sheet (PDF) 📄 Offer letter ✓ Due diligence
Listing remarks
This move-in ready gem checks all the boxes! Welcome home to a beautifully maintained 3-bedroom, 2-bathroom rancher that effortlessly combines comfort, style, and convenience! Nestled in the established Westview Lakes community, this turnkey property is ready for its next chapter. Step inside to an inviting, open-concept main living area boasting brand-new paint & a thoughtful layout that maximizes every square foot. The seamless flow leads you into a bright eat-in kitchen complete with a dedicated dining area—great for morning coffee or hosting weekend dinners! The spacious primary suite features its own private bathroom, while the 2 additional bedrooms offer flexible space for
Key facts
- 2 parking spots
- Built 1992
- Listed 7 days
Tags
Property features AI
Finance
- HOA & community: Has HOA; Association fee $55 per month; Association managed by Property Management Associates
Exterior
- Parking: Assigned/reserved parking for 2 vehicles
- Security: Security system
- Utilities: City/County water; City/County sewer; Electric water heater; Electric power
- Home design: Detached home; Contemporary style; Single-story
- Construction: Brick and vinyl siding; Asphalt shingle roof; Slab foundation
- Exterior features: Back fenced yard; Trash pickup available through community
Interior
- Kitchen: Electric range; Dishwasher; Garbage disposal
- Bedrooms: Master bedroom with ensuite; At least one bedroom and full bathroom on the first floor; Additional bedroom(s)
- Flooring: Carpet; Ceramic
- Bathrooms: 2 full bathrooms
- Heating & cooling: Electric heating; Central air conditioning
- Interior features: Ceiling fan; Security system; Walk-in closet
- Laundry & utility: Washer; Dryer; Utility room
Neighborhood map
What this means for you Summary
Snapshot
- This is a 3-bed/2.0-bath single-family listed at $246k.
Deal economics
- At list price, monthly cash flow is $-114 ($-1k/yr) — negative.
- To cash-flow at today's rent, offer at most $226k (8.2% below list).
- To meet the 1% rule (rent ≥ 1% of price), the offer needs to be $197k (20.1% below list).
- Recommended offer: $197k (20.1% below list) — sets the bar for 1% rule.
- Cap rate 5.7% vs local median 4.5% in Hampton — meaningfully above typical; check what's discounted (condition, days-on-market, listing class) to confirm the premium yield is real.
Location & tenants
- Location reads 75/100 on livability (#133 in VA, #4,302 nationally) — a middle-class / working-renter tenant base. Strengths: housing A+, health & safety A+, cost of living A; Watch: crime C-, amenities D+, commute F.
- Hampton City Public School District (urban): math 60% / reading 70% proficiency, ranked #40 of 131 in VA (top 30%) — acceptable for families but not a draw, mixed tenant base, ~2y average lease.
- Zoned schools: George P. Phenix Elementary (math 68% / reading 73%, grade A-, #310 of 1,108 statewide, top 28%, 1,516 students, 83% FRL); Bethel High (math 64% / reading 84%, grade B+, #120 of 319 statewide, top 38%, 1,777 students, 86% FRL) — zoned schools average 84% FRL vs 49% district-wide (36 pts higher); higher-poverty schools than district average — tighter screening recommended.
- Market conditions: Rents rising fast (+4.0%/yr); 231 active listings in the ZIP; 11 comparable units currently listed for rent nearby; rentals at typical pace (median 15d on market — plan ~3-4 weeks tenant-placement turnaround); 68 units permitted in Hampton city in 2024 (0 in 5+ unit buildings).
- This rent runs 32% of the median local income ($73k/yr) — at the standard rent-burdened threshold; future hikes will face affordability resistance.
Forward outlook
- Local home prices are declining (-3.0%/yr); year-one equity from $2k of loan paydown is wiped out by about $7k of value loss. Plan a longer hold.
- Hampton County population projected at -13% by 2050 — secular population decline; favor cash flow + early exit over multi-decade hold.
Negotiation context
- Only 7 days on market — expect competitive offers; lowballing is unlikely to land.
- Current owner paid $82k; list at $246k implies a 198% gain — meaningful room to come down on a strong offer.
Risks & watch-outs
- Climate carrying-cost: severe wind risk, 80% chance of damaging wind over 30y; extreme-heat days projected 7→17/yr by 2055 (HVAC capex compounding) — expect insurance premiums to compound above CPI over the hold.
Questions for the listing agent
- What do current leases actually rent for vs. the listed asking? Can we see a recent rent roll and the last 12 months of T-12 income?
- What does the HOA fee cover, when was the last increase, and are there any pending special assessments or reserve-fund shortfalls?
- Is there a deadline driving the sale (1031 exchange, divorce, estate, relocation)? That informs how much negotiation room exists.
- Schools are B-rated — typically a magnet for longer-tenancy family renters. What's the average tenant stay here, and is there a school-zone premium baked into asking?
- The area grade is low — what's the realistic commute time and amenity access for the typical tenant pool here? Any planned neighborhood developments (good or bad) we should know about?
- What's the average days-on-market for RENTAL listings here right now (not sales)? A rising rental-DOM trend means longer vacancies and softer asking-rent achievability than the comps imply.
- What's the recent tenant-quality profile in this submarket — average credit score on applications, eviction rate, late-payment / NSF rate, and stable-employment percentage? A property-management company in the area should have these aggregated.
- How much new for-sale + rental construction is in the pipeline within 1–3 miles? Heavy new supply typically softens prices + rents 12–24 months out; constrained supply supports both.
Investment metrics
- 1% rule
- 0.80% ✗
- Cap rate
- 5.74%
- Cash-on-cash
- -1.98%
- DSCR
- 0.91
- GRM
- 10.4
CMA / ARV
- ARV (on-the-fly)
- $288,399
- Comps found
- 12
Show comp detail 12 sales within ~0.75 mi
| Address | Dist | Beds/Ba | Sqft | Sold | Price | $/sf | Match |
|---|---|---|---|---|---|---|---|
| 230 Anne Dr | 0.15mi | 3/2.0 | 1,239 (+8%) | 7mo | $300,000 | $242 | 74 |
| 702 Chatsworth Dr | 0.23mi | 3/2.0 | 1,250 (+9%) | 6mo | $315,000 | $252 | 70 |
| 21 Sandy Lake Dr | 0.52mi | 3/2.0 | 1,162 (+1%) | 6mo | $299,000 | $257 | 69 |
| 48 Sandy Lake Dr | 0.40mi | 3/2.0 | 1,239 (+8%) | 0mo | $329,900 | $266 | 68 |
| 50 Sandy Lake Dr | 0.39mi | 3/2.0 | 1,240 (+8%) | 1mo | $330,000 | $266 | 67 |
| 10 Kingwood Dr | 0.38mi | 3/1.0 | 1,213 (+6%) | 6mo | $259,500 | $214 | 64 |
| 8 Sanlun Lakes Dr | 0.50mi | 3/2.0 | 1,239 (+8%) | 3mo | $321,000 | $259 | 62 |
| 113 Kincaid Ln | 0.41mi | 3/2.0 | 1,304 (+14%) | 2mo | $295,000 | $226 | 57 |
| 45 Crestwood Dr | 0.40mi | 3/2.5 | 1,295 (+13%) | 3mo | $308,698 | $238 | 56 |
| 21 Sanlun Lakes Dr | 0.45mi | 3/2.0 | 1,300 (+13%) | 2mo | $326,000 | $251 | 56 |
| 32 Betz Ln | 0.65mi | 3/1.0 | 1,253 (+9%) | 7mo | $290,000 | $231 | 45 |
| 748 Leonard Ln | 0.63mi | 3/2.0 | 1,316 (+14%) | 5mo | $325,000 | $247 | 43 |
Match score weights: distance 35% · size 25% · config 20% · recency 20%. Top-matched comps best support the ARV.
Projected returns pro-forma
-3.0% appreciation · 4.05% rent growth · sell at horizon
- IRR
- -18.4%
- Equity multiple
- 0.35×
- Total profit
- $-44,988
- Equity at exit
- $36,664
- IRR
- -8.9%
- Equity multiple
- 0.42×
- Total profit
- $-39,675
- Equity at exit
- $21,261
Cash invested: $68,852 (down + closing). Projections, not guarantees.
Landlord ↔ Tenant lean methodology
- Overall (STATE)
- 55 Moderately Landlord-Leaning
- State Virginia
- 55 Moderately Landlord-Leaning · D+2
- County
- — inherits STATE
- City
- — inherits STATE
ZIP-level market 23666
- Home prices YoY
- -15.7%
- Rents YoY
- 4.0%
- Active inventory
- 231
- Price-to-rent
- 10.4×
Monthly cashflow live
- Estimated rent
- $1,965 high interval (Pro) →
- Mortgage (P&I)
- −$1,290
- Tax from tax record
- −$219 /mo · $2,633/yr
- Insurance
- −$102
- HOA
- −$55
- Vacancy / Maint / Mgmt
- −$413
- Net cashflow
- $-114
Break-even live
Sensitivity live
| Price | -10% $25 | -5% $-44 | +0% $-114 | +5% $-183 | +10% $-253 |
|---|---|---|---|---|---|
| Rent | -10% $-269 | -5% $-191 | +0% $-114 | +5% $-36 | +10% $41 |
| Rate | -1.0pp $10 | -0.5pp $-51 | base $-114 | +0.5pp $-178 | +1.0pp $-242 |
UW: 25.0% down · 7.5% · 30yr · 1.5% tax · 5.0% vac · 8.0% maint · 8.0% mgmt
Financing live
Cash to close
- Down payment
- $61,475
- Closing costs
- $7,377
- Reserves months
- —
- Total cash needed
- —
Loan-product check · same deal, 3 products live
Conventional
25% down · 7.5% · 30yr
- Down + closing
- —
- Monthly P&I
- —
- Monthly cashflow
- —
- DSCR
- —
- Eligible?
- —
Personal DTI + credit; lowest rate.
DSCR
20% down · 8.5% · 30yr
- Down + closing
- —
- Monthly P&I
- —
- Monthly cashflow
- —
- DSCR
- —
- Eligible?
- —
No personal income docs; deal must DSCR.
Hard money
10% down · 12.0% · 12mo
- Down + closing
- —
- Monthly P&I
- —
- Monthly cashflow
- —
- DSCR
- —
- Eligible?
- —
Short-term bridge; refi at stabilization.
Rent comps 11 comps
| Address | Beds | Baths | Sqft | Rent | $/sqft | DOM | Units | Dist |
|---|---|---|---|---|---|---|---|---|
| 20 Lenora Dr Newport News, VA | 3.0 | 1.5 | 1030 | $1,950 | $1.89 | 12d | 1 | 0.09mi |
| 173 Louise Dr Newport News, VA | 3.0 | 1.0–2.0 | 1000 | $1,725 | $1.73 | 44d | 5 | 0.77mi |
| 725 Harpersville Rd Newport News, VA | 3.0 | 1.0 | 1003 | $1,700 | $1.69 | 24d | 1 | 0.82mi |
| 210 Durham Ct Yorktown, VA | 3.0 | 2.5 | 1440 | $2,100 | $1.46 | 22d | 1 | 0.94mi |
| 110 Foundry Ct Yorktown, VA | 2.0 | 2.5 | 1278 | $1,700 | $1.33 | 15d | 1 | 1.04mi |
| 6 Old Pond Ct Hampton, VA | 3.0 | 2.5 | 1494 | $2,695 | $1.80 | 18d | 1 | 1.17mi |
| 1400 Summit Ln Newport News, VA | 1.0–3.0 | 1.0–2.0 | 1135 | $2,756 | $2.43 | 2d | 25 | 1.35mi |
| 19 Port Lndg Newport News, VA | 1.0–3.0 | 1.0 | 975 | $1,825 | $1.87 | 44d | 8 | 1.44mi |
| 19 Port Lndg Newport News, VA | 1.0–3.0 | 1.0–1.5 | 975 | $1,825 | $1.87 | 2d | 24 | 1.44mi |
| 101 Saint Clair Cir Yorktown, VA | 2.0–3.0 | 2.0 | 1205 | $2,122 | $1.76 | 2d | 20 | 1.45mi |
| 1 Guenevere Ct Apt D Newport News, VA | 1.0–2.0 | 1.0 | 760 | $1,029 | $1.35 | 8d | 1 | 1.46mi |
HOA detail
- Monthly dues
- $55 · $660/yr
Listing history 9 events
-
2026-06-18status $245,900 Under Contract 7 DOM
-
2026-06-18days on market $245,900 Active Under Contract 7 DOM
-
2026-06-17days on market $245,900 Active Under Contract 6 DOM
-
2026-06-16days on market $245,900 Active Under Contract 5 DOM
-
2026-06-16status $245,900 Active Under Contract 4 DOM
-
2026-06-15days on market $245,900 Active 4 DOM
-
2026-06-13days on market $245,900 Active 2 DOM
-
2026-06-13remarks 689-char remark
-
2026-06-13$245,900 Active 1 DOM
ⓘ Source: listings_history table (triggers on properties + properties_extension) + one-shot
backfill from property_details.listing_events for pre-trigger history.
Tax reassessment forecast VA · Resets to sale price
- Current annual tax
- $2,633 · $219/mo
- Projected year-2 tax
- $2,633 · $219/mo
- Expected delta
- $0/yr ($0/mo · 0.0%)
ⓘ Screening estimate from a state-policy table — verify with the county assessor before closing.
Climate risk First Street
- Flood 1/10 Low FEMA zone X (unshaded) · 0% chance over 30 yrs
- Wildfire 3/10 Moderate
- Heat 9/10 Extreme 7 d/yr ≥105°F today · 17 d/yr by 30 yrs out
- Wind 8/10 Severe 80% chance of damaging wind over 30 yrs
- Air quality 2/10 Low 2 unhealthy d/yr today · 2 by 30 yrs out
Nearby sold comps map
Loading sold comps map…
Walkable amenities ~0.75 mi
Loading nearby amenities…
Taxation est. · year 1
- Rental income
- $23,584
- − Mortgage interest
- −$13,774
- − Property taxes
- −$2,633
- − Insurance
- −$1,230
- − Repairs & maintenance
- −$1,887
- − Management
- −$1,887
- − HOA
- −$660
- − Depreciation
- −$7,153
- Taxable loss
- −$5,640
- Est. tax savings @ 24.0%
- +$1,354
- After-tax cash flow
- $-12/yr
For passive investors: Depreciation is non-cash, so a rental often shows a tax loss while cash-flowing — sheltering income. Rental losses are passive: they offset passive income freely, and up to $25,000/yr can offset ordinary (W-2) income if you actively participate and your MAGI is under $100k (phasing out to $0 by $150k); unused losses carry forward. On sale, claimed depreciation is recaptured at up to 25%, and gains may owe capital-gains tax (a 1031 exchange can defer both). Figures are a year-1 estimate at your 24.0% rate — not tax advice; consult a CPA.
Schools (NCES district)
- District
- Hampton City Public School District
- NCES district ID
- 5101800
- Math proficiency
- 60% ▼ -21.00%
- Reading proficiency
- 70% ▼ -4.00%
- Median HH income
- $50,089
- Composite
- 55.19/100
- National rank
- #1272
- State rank
- #40 of 131 in VA
Livability — Hampton
- Score
- 75/100
- State rank
- #133
- US rank
- #4302
Category grades
Schools grade is shown separately in the Schools card above.
Census & demographics
- Census place
- Hampton, VA
- County
- Hampton City · 132,421 people
- City population
- 132,421
- Metro
- Virginia Beach-Norfolk-Newport News, VA-NC
- Population (ZIP)
- 54,233
- Household income
- $72,568
- Rent vs Own
- Severe rent burden
- 2951.0
Population outlook (Hampton County) Hauer SSP2
- Today (2025)
- 134,055 people
- By 2030
- 131,753 · -1.7%
- By 2040
- 125,017 · -6.7%
- By 2050
- 116,825 · -12.9%
- By 2075
- 97,033 · -27.6%
- By 2100
- 76,188 · -43.2%
Race, ethnicity, and origin ACS 2023
- Neighborhood character
- Diverse neighborhood (Simpson 0.65)
- Race & ethnicity
- Black 51% White 29% Two or more races 10% Hispanic / Latino 9% Asian 4%
- Hispanic origin (detail)
- Mexican 3% Puerto Rican 3%
- Common ancestry
- Italian 1% Lithuanian 1% Romanian 1%
- Foreign-born
- 7% · Canada, Vietnam
- Languages at home
- 90% English-only · Spanish 5% Vietnamese 1% Arabic 1%
Political lean MEDSL · Hampton
- 2024 margin
- Solid D (+39.9) · D 69.2% · R 29.4% · Other 1.4%
- 2008→2024 swing
- +1.0pp no change · 2008: 38.9pp · 2024: 39.9pp
- All cycles
- 2024: D+39.9 2020: D+42.2 2016: D+37.8 2012: D+45.4 2008: D+38.9
Not yet ingested
- Civics
- —
Market trends
- HPI YoY
- ▼ -49.01%
- Current HPI
- 262.821
- Rent YoY
- ▲ 4.05%
- Metro
- Virginia Beach-Norfolk-Newport News, VA-NC
- State GDP YoY
- ▲ 2.40%
- F500 in state
- 50
Industry mix (Fortune 500 HQ in VA)
| Industry | F500 HQs | Revenue |
|---|---|---|
| Aerospace / Defense | 4 | $236B |
|
||
| Technology / Defense | 3 | $32B |
|
||
| Financial Services | 2 | $176B |
|
||
| Utilities | 2 | $27B |
|
||
| Insurance | 2 | $25B |
|
||
| Technology | 2 | $15B |
|
||
Price history
+251.8% since first listed4 events — show timeline
- 2026-06-10 Listed $245,900 REINMLS
- 2001-03-27 Sold (Public Records) $82,500 Public Records
- 1996-09-01 Sold (Public Records) $76,000 Public Records
- 1992-08-01 Sold (Public Records) $69,900 Public Records
Property tax history
+9.0%/yrLatest (2025): $2,633 · +3.0% YoY. Source: county tax records.
Cash-flow waterfall
monthlySold comps — $/sqft
last 12 mo · ≤1 miLoading sold comps…