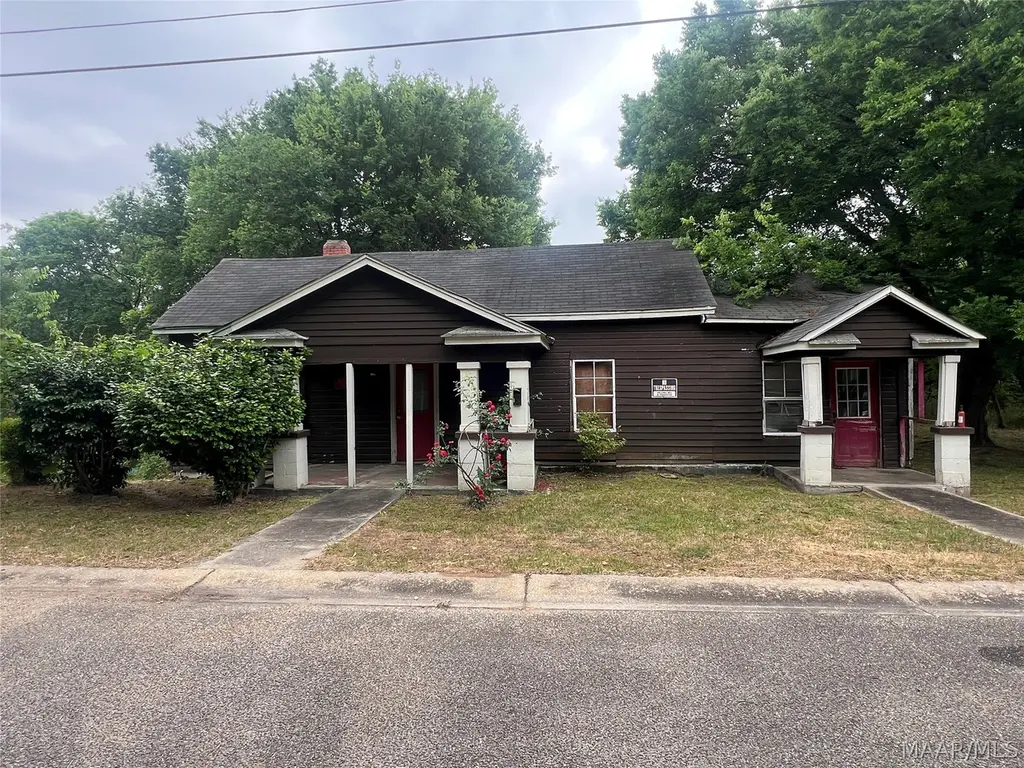
707 Rushing Cir · Tallassee, AL
Flood risk 1/10 · Minimal
- FEMA flood zone
- X (unshaded)
- Chance of flooding over 30 yrs
- 0.0%
- Est. flood insurance / yr
- $507 – $1,088
Fire risk 4/10 · Minor
- Est. fire insurance / yr
- $916 – $1,700
Heat risk 6/10 · Moderate
- Hot days now (above 107°F)
- 7 days/yr
- Hot days in 30 yrs
- 18 days/yr
Wind risk 6/10 · Moderate
- Chance of severe wind over 30 yrs
- 68.0%
Air-quality risk 2/10 · Minimal
- Unhealthy air days now
- 1 days/yr
- Unhealthy air days in 30 yrs
- 2 days/yr
Risk factors via First Street. Map © Google.
Why this score? — see what drove the D grade
The composite is a weighted blend of 9 inputs, each scored 0–100. Each bar is that input's sub-score; the figure is the points it added to the 100-point composite (weight × sub-score).
- Cash flow +15.0/30.0
- ARV discount +7.5/15.0
- 1% rule +5.0/10.0
- DSCR +5.0/10.0
- Livability +2.8/5.0
- Schools +2.7/10.0
- Rent growth +2.5/5.0
- Condition / age +2.5/5.0
- Appreciation +0.0/10.0
$13,900
🖨 Deal sheet 📄 Offer letter ✓ Due diligence
Listing remarks
Under $20K — Steal of a Deal! Calling all investors, rehabbers, and HGTV visionaries! This property is a true blank canvas with endless potential. Whether you are looking to create a single-family home with a full gut renovation, redesign it as a spacious 4-bedroom, 2-bath layout, or explore the possibility of converting it into a 2bd 1 bth duplex, this property gives you the opportunity to bring your vision to life. Priced for a quick sale, this is the perfect project for someone ready to roll up their sleeves and create value. Bring your ideas, your contractor, and your best offer — opportunities like this do not last long! is an equitable interest listing where seller is sel
Key facts
- 0.23 acre lot
- 2 parking spots
- Built 1945
Property features AI
Exterior
- Parking: Detached carport; 2 carport spaces
- Utilities: Cable available; Electricity available; Public water; Public sewer
- Home design: Single-story home; Wood siding construction
- Construction: Built (year per public records); Wood siding; Single-story
- Exterior features: City lot; Mature trees
Interior
- Flooring: Tile
- Bathrooms: 2 full bathrooms
- Interior features: Split-bedroom floor plan; Tile flooring
- Laundry & utility: Water heater included
Neighborhood map
What this means for you Summary
Snapshot
- This is a 4-bed/1.0-bath single-family listed at $14k.
Deal economics
- At list price, monthly cash flow is $1k ($13k/yr) — positive.
- The deal already cash-flows at list — no discount required.
- Meets the 1% rule at list price ($1k rent vs $14k).
- Recommended offer: $13k (3.0% below list) — sets the bar for market timing.
- Cap rate 99.8% vs local median 4.0% in Tallassee — top-decile yield for the area; either an underpriced asset or a hidden risk that comps aren't pricing in. Stress-test before assuming the spread holds.
Location & tenants
- Location reads 56/100 on livability (#418 in AL) — a working-class tenant base; expect higher turnover. Strengths: cost of living A+, housing A+; Watch: schools D+, crime F, amenities F.
- Tallassee City (rural): math 23% / reading 40% proficiency, ranked #60 of 129 in AL (top 46%) — families likely to look elsewhere, expect single-tenant / working-renter base with shorter leases.
- Market conditions: 113 active listings in the ZIP; 92 units permitted in Elmore County in 2024 (0 in 5+ unit buildings).
Forward outlook
- Local home prices are declining (-3.0%/yr); year-one equity from $96 of loan paydown is wiped out by about $417 of value loss. Plan a longer hold.
- Elmore County population projected at +6% by 2050 — modest demand growth; plan on rents tracking national, not racing it.
- At projected returns (-3.0% appreciation + 3.0% rent growth), your $4k cash investment doubles in ~1 year — after that, you're playing with house money.
Negotiation context
- It's been on market 39 days — a 3% lower offer ($13k) is reasonable based on typical stale-listing flexibility.
Risks & watch-outs
- Watch-outs: built in 1945 — expect roof / HVAC / electrical / plumbing capex.
- Climate carrying-cost: major wind risk, 68% chance of damaging wind over 30y; extreme-heat days projected 7→18/yr by 2055 (HVAC capex compounding) — expect insurance premiums to compound above CPI over the hold.
Questions for the listing agent
- It's been on market 39 days. Have you received any prior offers? Is the seller open to a 3% concession, seller financing, or rate buy-down credit?
- Built in 1945 — when were the roof, HVAC, electrical panel, plumbing, and water heater last replaced?
- Is there a deadline driving the sale (1031 exchange, divorce, estate, relocation)? That informs how much negotiation room exists.
- Schools are D-rated, which usually means shorter tenancies and higher turnover. Who's the typical renter profile here, and what's been the actual vacancy rate?
- Crime grade is F in this area — have there been break-ins, vandalism, or insurance claims at this property in the last 3 years? What carrier currently insures it and at what premium?
- The area grade is low — what's the realistic commute time and amenity access for the typical tenant pool here? Any planned neighborhood developments (good or bad) we should know about?
- What's the average days-on-market for RENTAL listings here right now (not sales)? A rising rental-DOM trend means longer vacancies and softer asking-rent achievability than the comps imply.
- What's the recent tenant-quality profile in this submarket — average credit score on applications, eviction rate, late-payment / NSF rate, and stable-employment percentage? A property-management company in the area should have these aggregated.
- How much new for-sale + rental construction is in the pipeline within 1–3 miles? Heavy new supply typically softens prices + rents 12–24 months out; constrained supply supports both.
Investment metrics
- 1% rule
- 10.68% ✓
- Cap rate
- 99.84%
- Cash-on-cash
- 334.09%
- DSCR
- 15.87
- GRM
- 0.8
CMA / ARV
- ARV (median comp)
- $195,756
- List price
- $13,900
- Delta
- -92.90%
- Verdict
- UNDERPRICED
- Comps
- 20 within 1.0 mi
Show comp detail 4 sales within ~0.75 mi
| Address | Dist | Beds/Ba | Sqft | Sold | Price | $/sf | Match |
|---|---|---|---|---|---|---|---|
| 408 Jordan Ave | 0.30mi | 3/2.0 (-1) | 1,569 (+6%) | 12mo | $80,000 | $51 | 56 |
| 102 N Dubois St | 0.41mi | 3/2.0 (-1) | 1,609 (+9%) | 1mo | $176,900 | $110 | 56 |
| 311 John St | 0.31mi | 3/2.0 (-1) | 1,618 (+10%) | 11mo | $130,000 | $80 | 51 |
| 719 Whatley Dr | 0.56mi | 3/2.0 (-1) | 1,613 (+9%) | 9mo | $205,000 | $127 | 42 |
Match score weights: distance 35% · size 25% · config 20% · recency 20%. Top-matched comps best support the ARV.
Projected returns pro-forma
-3.0% appreciation · 3.0% rent growth · sell at horizon
- IRR
- —
- Equity multiple
- 18.16×
- Total profit
- $66,780
- Equity at exit
- $2,073
- IRR
- —
- Equity multiple
- 38.79×
- Total profit
- $147,091
- Equity at exit
- $1,202
Cash invested: $3,892 (down + closing). Projections, not guarantees.
Landlord ↔ Tenant lean methodology
- Overall (STATE)
- 90 Strongly Landlord-Friendly
- State Alabama
- 90 Strongly Landlord-Friendly · R+15
- County
- — inherits STATE
- City
- — inherits STATE
ZIP-level market 36078
- Home prices YoY
- -21.3%
- Active inventory
- 113
- Price-to-rent
- 0.8×
Monthly cashflow live
- Estimated rent
- $1,484 medium interval (Pro) →
- Mortgage (P&I)
- −$73
- Tax from tax record
- −$10 /mo · $126/yr
- Insurance
- −$6
- HOA
- −$0
- Vacancy / Maint / Mgmt
- −$312
- Net cashflow
- $1,084
Break-even live
UW: 25.0% down · 7.5% · 30yr · 1.5% tax · 5.0% vac · 8.0% maint · 8.0% mgmt
Financing live
Cash to close
- Down payment
- $3,475
- Closing costs
- $417
- Reserves months
- —
- Total cash needed
- —
Loan-product check · same deal, 3 products live
Conventional
25% down · 7.5% · 30yr
- Down + closing
- —
- Monthly P&I
- —
- Monthly cashflow
- —
- DSCR
- —
- Eligible?
- —
Personal DTI + credit; lowest rate.
DSCR
20% down · 8.5% · 30yr
- Down + closing
- —
- Monthly P&I
- —
- Monthly cashflow
- —
- DSCR
- —
- Eligible?
- —
No personal income docs; deal must DSCR.
Hard money
10% down · 12.0% · 12mo
- Down + closing
- —
- Monthly P&I
- —
- Monthly cashflow
- —
- DSCR
- —
- Eligible?
- —
Short-term bridge; refi at stabilization.
Listing history 18 events
-
2026-06-19days on market $13,900 Active 39 DOM
-
2026-06-18days on market $13,900 Active 38 DOM
-
2026-06-17price $13,900 Active 37 DOM
-
2026-06-17days on market $15,900 Active 37 DOM
-
2026-06-16days on market $15,900 Active 36 DOM
-
2026-06-15days on market $15,900 Active 35 DOM
-
2026-06-14days on market $15,900 Active 33 DOM
-
2026-06-12days on market $15,900 Active 32 DOM
-
2026-06-09days on market $15,900 Active 29 DOM
-
2026-06-08days on market $15,900 Active 28 DOM
-
2026-06-07days on market $15,900 Active 27 DOM
-
2026-06-05days on market $15,900 Active 25 DOM
-
2026-06-04pricedays on market $15,900 Active 23 DOM
-
2026-06-02days on market $19,900 Active 22 DOM
-
2026-06-01days on market $19,900 Active 21 DOM
-
2026-05-31days on market $19,900 Active 20 DOM
-
2026-05-31days on market $19,900 Active 19 DOM
-
2026-05-11$19,900 Active 976-char remark
ⓘ Source: listings_history table (triggers on properties + properties_extension) + one-shot
backfill from property_details.listing_events for pre-trigger history.
Tax reassessment forecast AL · Resets to sale price
- Current annual tax
- $126 · $10/mo
- Projected year-2 tax
- $126 · $10/mo
- Expected delta
- $0/yr ($0/mo · -0.0%)
ⓘ Screening estimate from a state-policy table — verify with the county assessor before closing.
Climate risk First Street
- Flood 1/10 Low FEMA zone X (unshaded) · 0% chance over 30 yrs
- Wildfire 4/10 Moderate
- Heat 6/10 Major 7 d/yr ≥107°F today · 18 d/yr by 30 yrs out
- Wind 6/10 Major 68% chance of damaging wind over 30 yrs
- Air quality 2/10 Low 1 unhealthy d/yr today · 2 by 30 yrs out
Nearby sold comps map
Loading sold comps map…
Walkable amenities ~0.75 mi
Loading nearby amenities…
Taxation est. · year 1
- Rental income
- $17,814
- − Mortgage interest
- −$779
- − Property taxes
- −$126
- − Insurance
- −$70
- − Repairs & maintenance
- −$1,425
- − Management
- −$1,425
- − Depreciation
- −$404
- Taxable income
- $13,585
- Est. tax owed @ 24.0%
- −$3,260
- After-tax cash flow
- $9,742/yr
For passive investors: Depreciation is non-cash, so a rental often shows a tax loss while cash-flowing — sheltering income. Rental losses are passive: they offset passive income freely, and up to $25,000/yr can offset ordinary (W-2) income if you actively participate and your MAGI is under $100k (phasing out to $0 by $150k); unused losses carry forward. On sale, claimed depreciation is recaptured at up to 25%, and gains may owe capital-gains tax (a 1031 exchange can defer both). Figures are a year-1 estimate at your 24.0% rate — not tax advice; consult a CPA.
Schools (NCES district)
- District
- Tallassee City
- NCES district ID
- 0103240
- Math proficiency
- 23% ▼ -22.00%
- Reading proficiency
- 40% ▼ -1.00%
- Median HH income
- $46,393
- Composite
- 27.03/100
- National rank
- #7055
- State rank
- #60 of 129 in AL
Livability — Tallassee
- Score
- 56/100
- State rank
- #418
- US rank
- #22846
Category grades
Schools grade is shown separately in the Schools card above.
Census & demographics
- Census place
- Tallassee, AL
- Population (ZIP)
- 13,460
Population outlook (Elmore County) Hauer SSP2
- Today (2025)
- 85,154 people
- By 2030
- 86,667 · +1.8%
- By 2040
- 89,014 · +4.5%
- By 2050
- 90,331 · +6.1%
- By 2075
- 96,096 · +12.8%
- By 2100
- 95,290 · +11.9%
Race, ethnicity, and origin ACS 2023
- Neighborhood character
- Predominantly White (77%)
- Race & ethnicity
- White 77% Black 18% Two or more races 4% Hispanic / Latino 2%
- Common ancestry
- Slovak 2% Serbian 2% Lithuanian 1%
- Foreign-born
- 1% · Canada, China
- Languages at home
- 98% English-only · Spanish 1% Chinese 1%
Political lean MEDSL · Elmore
- 2024 margin
- Solid R (+52.1) · D 23.6% · R 75.6%
- 2008→2024 swing
- -1.1pp toward R · 2008: -50.9pp · 2024: -52.1pp
- All cycles
- 2024: R+52.1 2020: R+48.2 2016: R+52.0 2012: R+48.8 2008: R+50.9
Not yet ingested
- Civics
- —
Market trends
- HPI YoY
- ▼ -48.68%
- Current HPI
- 179.7258
- Rent YoY
- —
- Metro
- —
- State GDP YoY
- ▲ 2.94%
- F500 in state
- 4
Industry mix (Fortune 500 HQ in AL)
| Industry | F500 HQs | Revenue |
|---|---|---|
| Financial Services | 1 | $8B |
|
||
| Healthcare | 1 | $5B |
|
||
Price history
-30.2% since first listed3 events — show timeline
- 2026-06-17 Price Changed $13,900 MAAR
- 2026-06-04 Price Changed $15,900 MAAR
- 2026-05-11 Listed $19,900 MAAR
Property tax history
+4.2%/yrLatest (2025): $126 · +0.0% YoY. Source: county tax records.
Cash-flow waterfall
monthlySold comps — $/sqft
last 12 mo · ≤1 miLoading sold comps…