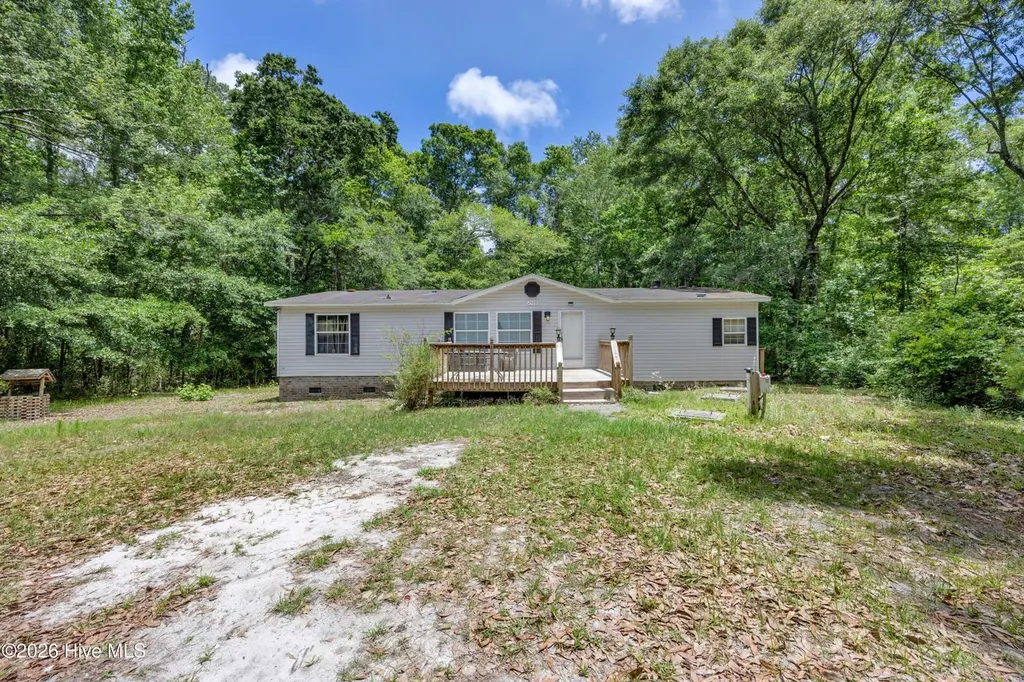
2509 Shell Point Rd SW · Shallotte, NC
Flood risk 5/10 · Moderate
- FEMA flood zone
- X (unshaded)
- Chance of flooding over 30 yrs
- 0.68%
- Est. flood insurance / yr
- $507 – $1,088
Fire risk 7/10 · Major
- Est. fire insurance / yr
- $906 – $1,684
Heat risk 9/10 · Severe
- Hot days now (above 104°F)
- 7 days/yr
- Hot days in 30 yrs
- 19 days/yr
Wind risk 8/10 · Major
- Chance of severe wind over 30 yrs
- 99.0%
Air-quality risk 1/10 · Minimal
- Unhealthy air days now
- 0 days/yr
- Unhealthy air days in 30 yrs
- 0 days/yr
Risk factors via First Street. Map © Google.
Why this score? — see what drove the D+ grade
The composite is a weighted blend of 9 inputs, each scored 0–100. Each bar is that input's sub-score; the figure is the points it added to the 100-point composite (weight × sub-score).
- Cash flow +16.8/30.0
- ARV discount +10.1/15.0
- DSCR +5.2/10.0
- Schools +3.9/10.0
- 1% rule +3.4/10.0
- Livability +3.2/5.0
- Rent growth +2.5/5.0
- Condition / age +2.5/5.0
- Appreciation +0.0/10.0
$180,000
🖨 Deal sheet (PDF) 📄 Offer letter ✓ Due diligence
Listing remarks MLS
Great unique floorplan to call home, a three bedroom (notice given that septic is for two bedroom,third room is designed as an office),two bath with kitchen/dining combo, two living rooms one with vaulted ceiling one with a very nice stone based fireplace. This peaceful treed location offers over a half of an acre for your privacy. Located less than 7 miles to Holden Beach makes this a perfect home close to the beaches and business district of Shallotte. Good condition with arched walkways, large garden tub in master bathroom, recent paint, new tile floors in kitchen, window treatments and a large front deck/porch. So if your looking for that primary home place, vacation get-a-way with loads of lot space for that RV or boat, this is one you will want to put on your list. Come take a look a nd you will be glad you did.
Key facts
- 0.59 acre lot
- Built 2000
- Listed 13 days
Property features AI
Exterior
- Parking: Off-street parking
- Utilities: Well water; Septic tank
- Home design: Manufactured home; Single-story (one level); Entry level: 1; Facing/view available
- Construction: Vinyl siding and frame construction; Shingle roof; Crawl space/no basement
- Exterior features: Deck; Storm doors; Has a view; Paved road access
Interior
- Kitchen: Refrigerator; Microwave
- Bedrooms: Total of 7 rooms (bedroom count not specified)
- Flooring: Carpet; Vinyl
- Bathrooms: 2 full bathrooms
- Heating & cooling: Electric heating; Heat pump; Central air conditioning
- Interior features: Ceiling fans; Storm windows and window coverings; Vented exhaust fan
- Laundry & utility: Electric water heater
Neighborhood map
What this means for you Summary
Snapshot
- This is a 2-bed/2.0-bath manufactured listed at $180k.
Deal economics
- At list price, monthly cash flow is $117 ($1k/yr) — positive.
- The deal already cash-flows at list — no discount required.
- To meet the 1% rule (rent ≥ 1% of price), the offer needs to be $150k (16.4% below list).
- Recommended offer: $150k (16.4% below list) — sets the bar for 1% rule.
- Cap rate 7.1% vs local median 4.0% in Shallotte — top-decile yield for the area; either an underpriced asset or a hidden risk that comps aren't pricing in. Stress-test before assuming the spread holds.
Location & tenants
- Location reads 63/100 on livability (#411 in NC) — a middle-class / working-renter tenant base. Strengths: cost of living A+, housing A+, employment B; Watch: health & safety D, crime F, amenities F.
- Brunswick County Schools (rural): math 45% / reading 47% proficiency, ranked #82 of 178 in NC (top 46%) — families likely to look elsewhere, expect single-tenant / working-renter base with shorter leases.
- Zoned schools: Union Elementary (math 83% / reading 76%, grade A, #24 of 1,410 statewide, top 2%, 571 students, 100% FRL); Cedar Grove Middle (math 30% / reading 36%, grade F, #305 of 475 statewide, top 65%, 434 students, 99% FRL); West Brunswick High (math 50% / reading 56%, grade C-, #281 of 535 statewide, top 53%, 1,526 students, 100% FRL) — zoned schools average 100% FRL vs 53% district-wide (46 pts higher); higher-poverty schools than district average — tighter screening recommended.
- Market conditions: 384 active listings in the ZIP; 6,112 units permitted in Brunswick County in 2024 (990 in 5+ unit buildings).
Forward outlook
- Local home prices are declining (-3.0%/yr); year-one equity from $1k of loan paydown is wiped out by about $5k of value loss. Plan a longer hold.
- Brunswick County population projected at +36% by 2050 — long-run rental-demand tailwind backs the buy-and-hold thesis.
Negotiation context
- Only 13 days on market — expect competitive offers; lowballing is unlikely to land.
- 4 sale attempts since 22y ago with the ask held roughly flat each time — persistent listings suggest the price (not the market) is what's stuck; bring a comps-based counter.
- Current owner paid $64k; list at $180k implies a 183% gain — meaningful room to come down on a strong offer.
Risks & watch-outs
- Climate carrying-cost: moderate flood risk; severe wind risk, 99% chance of damaging wind over 30y; major wildfire risk; extreme-heat days projected 7→19/yr by 2055 (HVAC capex compounding) — expect insurance premiums to compound above CPI over the hold.
Questions for the listing agent
- Is there a deadline driving the sale (1031 exchange, divorce, estate, relocation)? That informs how much negotiation room exists.
- Crime grade is F in this area — have there been break-ins, vandalism, or insurance claims at this property in the last 3 years? What carrier currently insures it and at what premium?
- The area grade is low — what's the realistic commute time and amenity access for the typical tenant pool here? Any planned neighborhood developments (good or bad) we should know about?
- What's the average days-on-market for RENTAL listings here right now (not sales)? A rising rental-DOM trend means longer vacancies and softer asking-rent achievability than the comps imply.
- What's the recent tenant-quality profile in this submarket — average credit score on applications, eviction rate, late-payment / NSF rate, and stable-employment percentage? A property-management company in the area should have these aggregated.
- How much new for-sale + rental construction is in the pipeline within 1–3 miles? Heavy new supply typically softens prices + rents 12–24 months out; constrained supply supports both.
Investment metrics
- 1% rule
- 0.84% ✗
- Cap rate
- 7.07%
- Cash-on-cash
- 2.78%
- DSCR
- 1.12
- GRM
- 10.0
CMA / ARV
- ARV (on-the-fly)
- $190,944
- Comps found
- 1
Show comp detail 1 sale within ~0.75 mi
| Address | Dist | Beds/Ba | Sqft | Sold | Price | $/sf | Match |
|---|---|---|---|---|---|---|---|
| 2185 Chelsea Branch Way SW | 0.55mi | 3/2.0 (+1) | 1,506 (+7%) | 20mo | $205,000 | $136 | 41 |
Match score weights: distance 35% · size 25% · config 20% · recency 20%. Top-matched comps best support the ARV.
Projected returns pro-forma
-3.0% appreciation · 3.0% rent growth · sell at horizon
- IRR
- -12.0%
- Equity multiple
- 0.57×
- Total profit
- $-21,817
- Equity at exit
- $26,839
- IRR
- -2.9%
- Equity multiple
- 0.81×
- Total profit
- $-9,762
- Equity at exit
- $15,563
Cash invested: $50,400 (down + closing). Projections, not guarantees.
Landlord ↔ Tenant lean methodology
- Overall (STATE)
- 85 Strongly Landlord-Friendly
- State North Carolina
- 85 Strongly Landlord-Friendly · R+3
- County
- — inherits STATE
- City
- — inherits STATE
ZIP-level market 28470
- Home prices YoY
- -34.8%
- Active inventory
- 384
- Price-to-rent
- 10.0×
Monthly cashflow live
- Estimated rent
- $1,505 medium interval (Pro) →
- Mortgage (P&I)
- −$944
- Tax from tax record
- −$53 /mo · $637/yr
- Insurance
- −$75
- HOA
- −$0
- Vacancy / Maint / Mgmt
- −$316
- Net cashflow
- $117
Break-even live
Sensitivity live
| Price | -10% $219 | -5% $168 | +0% $117 | +5% $66 | +10% $15 |
|---|---|---|---|---|---|
| Rent | -10% $-2 | -5% $57 | +0% $117 | +5% $176 | +10% $236 |
| Rate | -1.0pp $207 | -0.5pp $163 | base $117 | +0.5pp $70 | +1.0pp $23 |
UW: 25.0% down · 7.5% · 30yr · 1.5% tax · 5.0% vac · 8.0% maint · 8.0% mgmt
Financing live
Cash to close
- Down payment
- $45,000
- Closing costs
- $5,400
- Reserves months
- —
- Total cash needed
- —
Loan-product check · same deal, 3 products live
Conventional
25% down · 7.5% · 30yr
- Down + closing
- —
- Monthly P&I
- —
- Monthly cashflow
- —
- DSCR
- —
- Eligible?
- —
Personal DTI + credit; lowest rate.
DSCR
20% down · 8.5% · 30yr
- Down + closing
- —
- Monthly P&I
- —
- Monthly cashflow
- —
- DSCR
- —
- Eligible?
- —
No personal income docs; deal must DSCR.
Hard money
10% down · 12.0% · 12mo
- Down + closing
- —
- Monthly P&I
- —
- Monthly cashflow
- —
- DSCR
- —
- Eligible?
- —
Short-term bridge; refi at stabilization.
Listing history 12 events
-
2026-06-22days on market $180,000 Active 13 DOM
-
2026-06-18days on market $180,000 Active 10 DOM
-
2026-06-17days on market $180,000 Active 9 DOM
-
2026-06-16days on market $180,000 Active 8 DOM
-
2026-06-15days on market $180,000 Active 7 DOM
-
2026-06-14days on market $180,000 Active 5 DOM
-
2026-06-13status $180,000 Active 4 DOM
-
2026-06-07statusdays on market $180,000 Pending 4 DOM
-
2026-06-05days on market $180,000 Active 3 DOM
-
2026-06-03days on market $180,000 Active 2 DOM
-
2026-06-02remarks 513-char remark
-
2026-06-02$180,000 Active 1 DOM
ⓘ Source: listings_history table (triggers on properties + properties_extension) + one-shot
backfill from property_details.listing_events for pre-trigger history.
Tax reassessment forecast NC · Resets to sale price
- Current annual tax
- $637 · $53/mo
- Projected year-2 tax
- $1,476 · $123/mo
- Expected delta
- +$839/yr (+$70/mo · 131.6%)
ⓘ Screening estimate from a state-policy table — verify with the county assessor before closing.
Climate risk First Street
- Flood 5/10 Major FEMA zone X (unshaded) · 68% chance over 30 yrs
- Wildfire 7/10 Severe
- Heat 9/10 Extreme 7 d/yr ≥104°F today · 19 d/yr by 30 yrs out
- Wind 8/10 Severe 99% chance of damaging wind over 30 yrs
- Air quality 1/10 Low 0 unhealthy d/yr today · 0 by 30 yrs out
Nearby sold comps map
Loading sold comps map…
Walkable amenities ~0.75 mi
Loading nearby amenities…
Taxation est. · year 1
- Rental income
- $18,057
- − Mortgage interest
- −$10,083
- − Property taxes
- −$637
- − Insurance
- −$900
- − Repairs & maintenance
- −$1,445
- − Management
- −$1,445
- − Depreciation
- −$5,236
- Taxable loss
- −$1,688
- Est. tax savings @ 24.0%
- +$405
- After-tax cash flow
- $1,806/yr
For passive investors: Depreciation is non-cash, so a rental often shows a tax loss while cash-flowing — sheltering income. Rental losses are passive: they offset passive income freely, and up to $25,000/yr can offset ordinary (W-2) income if you actively participate and your MAGI is under $100k (phasing out to $0 by $150k); unused losses carry forward. On sale, claimed depreciation is recaptured at up to 25%, and gains may owe capital-gains tax (a 1031 exchange can defer both). Figures are a year-1 estimate at your 24.0% rate — not tax advice; consult a CPA.
Schools (NCES district)
- District
- Brunswick County Schools
- NCES district ID
- 3700420
- Math proficiency
- 45% ▲ 4.00%
- Reading proficiency
- 47% ▲ 4.00%
- Median HH income
- $47,494
- Composite
- 39.23/100
- National rank
- #4011
- State rank
- #82 of 178 in NC
Livability — Shallotte
- Score
- 63/100
- State rank
- #411
- US rank
- #15490
Category grades
Schools grade is shown separately in the Schools card above.
Census & demographics
- County
- Brunswick County · 131,536 people
- City population
- 11,219
- Metro
- Myrtle Beach-Conway-North Myrtle Beach, SC-NC
- Population (ZIP)
- 11,219
- Household income
- $65,030
- Rent vs Own
- Severe rent burden
- 455.0
Population outlook (Brunswick County) Hauer SSP2
- Today (2025)
- 152,111 people
- By 2030
- 165,705 · +8.9%
- By 2040
- 188,494 · +23.9%
- By 2050
- 206,228 · +35.6%
- By 2075
- 237,876 · +56.4%
- By 2100
- 251,451 · +65.3%
Race, ethnicity, and origin ACS 2023
- Neighborhood character
- Predominantly White (73%)
- Race & ethnicity
- White 73% Black 13% Two or more races 9% Hispanic / Latino 8%
- Hispanic origin (detail)
- Mexican 3%
- Common ancestry
- Serbian 3% Slovak 2% Italian 2%
- Foreign-born
- 3% · Canada, Jamaica
- Languages at home
- 98% English-only · Spanish 2%
Political lean MEDSL · Brunswick
- 2024 margin
- Strong R (+24.9) · D 37.2% · R 62.0%
- 2008→2024 swing
- -6.9pp toward R · 2008: -17.9pp · 2024: -24.9pp
- All cycles
- 2024: R+24.9 2020: R+25.0 2016: R+28.7 2012: R+22.2 2008: R+17.9
Not yet ingested
- Civics
- —
Market trends
- HPI YoY
- ▼ -77.91%
- Current HPI
- 146.2303
- Rent YoY
- —
- Metro
- Myrtle Beach-Conway-North Myrtle Beach, SC-NC
- State GDP YoY
- ▲ 3.28%
- F500 in state
- 26
Industry mix (Fortune 500 HQ in NC)
| Industry | F500 HQs | Revenue |
|---|---|---|
| Financial Services | 2 | $213B |
|
||
| Retail | 2 | $95B |
|
||
| Industrial Conglomerate | 1 | $38B |
|
||
| Metals / Steel | 1 | $35B |
|
||
| Utilities | 1 | $30B |
|
||
| Industrial Machinery | 1 | $19B |
|
||
Price history
+140.3% since first listed9 events — show timeline
- 2026-06-01 Listed $180,000 Hive MLS
- 2012-02-13 Sold (Public Records) $63,600 Public Records
- 2012-02-13 Sold (MLS) $63,600 Hive MLS
- 2010-12-02 Listed $73,500 Hive MLS
- 2008-07-01 Sold (MLS) $92,725 Hive MLS
- 2008-06-27 Sold (Public Records) $93,000 Public Records
- 2008-05-08 Listed $95,000 Hive MLS
- 2004-12-07 Sold (MLS) $72,000 Hive MLS
- 2004-06-01 Listed $74,900 Hive MLS
Property tax history
+2.8%/yrLatest (2025): $637 · +2.3% YoY. Source: county tax records.
Cash-flow waterfall
monthlySold comps — $/sqft
last 12 mo · ≤1 miLoading sold comps…