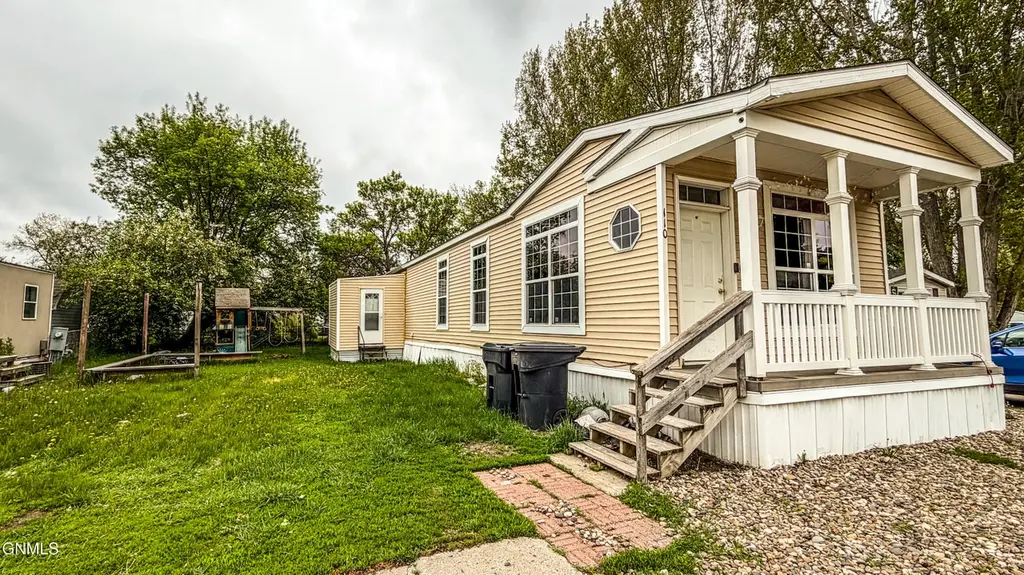
110 Oaks Ave SE · Mandan, ND
Flood risk 1/10 · Minimal
- FEMA flood zone
- X (shaded)
- Chance of flooding over 30 yrs
- 0.0%
- Est. flood insurance / yr
- $507 – $1,088
Fire risk 4/10 · Minor
- Est. fire insurance / yr
- $1,289 – $2,393
Heat risk 2/10 · Minimal
- Hot days now (above 96°F)
- 7 days/yr
- Hot days in 30 yrs
- 12 days/yr
Wind risk 2/10 · Minimal
- Chance of severe wind over 30 yrs
- —
Air-quality risk 4/10 · Minor
- Unhealthy air days now
- 5 days/yr
- Unhealthy air days in 30 yrs
- 5 days/yr
Risk factors via First Street. Map © Google.
Why this score? — see what drove the D+ grade
The composite is a weighted blend of 9 inputs, each scored 0–100. Each bar is that input's sub-score; the figure is the points it added to the 100-point composite (weight × sub-score).
- Cash flow +15.0/30.0
- ARV discount +7.6/15.0
- 1% rule +5.0/10.0
- DSCR +5.0/10.0
- Rent growth +5.0/5.0
- Livability +3.5/5.0
- Schools +3.3/10.0
- Condition / age +2.2/5.0
- Appreciation +0.0/10.0
$40,000
🖨 Deal sheet (PDF) 📄 Offer letter ✓ Due diligence
Listing remarks MLS
Check out this 3 bedroom 2 bath manufactured home built in 2008 and freshly painted. The master bedroom has a bathroom and walk-in closet. There are two additional bedrooms and full bath. The kitchen and dining have many cabinets, newer appliances which include a gas stove. The front porch is covered, maintenance free decking and railings (not stairs) and there is an attached entry on the side that is insulated and ready to be finished to your needs. CAUTION ALLERGY: CATS
Key facts
- Walk-in closet
- Full bathroom
- Open layout
Tags
Property features AI
Finance
- Other: Property located in Twin City Estates
- HOA & community: Homeowners association with monthly fee; Monthly association fee of $537; Association fee includes snow removal and trash
Exterior
- Parking: Driveway with concrete surface
- Utilities: Public water; Public sewer
- Home design: Residential mobile home (single wide); Shingle roof; Rectangular lot; Lot space is rented
- Construction: Vinyl siding
- Exterior features: Playground; Fire pit; Deck; Enclosed porch; Porch
Interior
- Kitchen: Dishwasher; Microwave; Refrigerator
- Bathrooms: Two full bathrooms
- Heating & cooling: Central air; Ceiling fan(s); Forced air heating; Natural gas heating
- Interior features: Ceiling fans throughout; Walk-in closet(s); Skylight(s)
- Laundry & utility: Washer; Dryer
Neighborhood map
What this means for you Summary
Snapshot
- This is a 3-bed/2.0-bath manufactured listed at $40k. Condition is rated fair.
Deal economics
- At list price, monthly cash flow is $744 ($9k/yr) — positive.
- The deal already cash-flows at list — no discount required.
- Meets the 1% rule at list price ($2k rent vs $40k).
- Recommended offer: $39k (1.5% below list) — sets the bar for market timing.
- Cap rate 28.6% vs local median 2.7% in Mandan — top-decile yield for the area; either an underpriced asset or a hidden risk that comps aren't pricing in. Stress-test before assuming the spread holds.
Location & tenants
- Location reads 70/100 on livability (#76 in ND) — a middle-class / working-renter tenant base. Strengths: cost of living A+, housing A+, employment A; Watch: crime C-, amenities F, commute F.
- Mandan 1 (suburban): math 35% / reading 38% proficiency, ranked #32 of 53 in ND (top 60%) — families likely to look elsewhere, expect single-tenant / working-renter base with shorter leases.
- Zoned schools: Mandan Middle School (math 36% / reading 40%, grade F, #21 of 35 statewide, top 59%, 928 students, 30% FRL); Mandan High School (math 18% / reading 42%, grade F, #90 of 144 statewide, top 66%, 1,138 students, 25% FRL) — zoned schools at 28% FRL track the district average.
- Market conditions: Rents rising fast (+14.0%/yr); 304 active listings in the ZIP; 13 comparable units currently listed for rent nearby; rentals at typical pace (median 22d on market — plan ~3-4 weeks tenant-placement turnaround); solid renter incomes; 94 units permitted in Morton County in 2024 (5 in 5+ unit buildings).
Forward outlook
- Local home prices are declining (-3.0%/yr); year-one equity from $277 of loan paydown is wiped out by about $1k of value loss. Plan a longer hold.
- Morton County population projected at +48% by 2050 — long-run rental-demand tailwind backs the buy-and-hold thesis.
- At projected returns (-3.0% appreciation + 8.0% rent growth), your $11k cash investment doubles in ~2 years — after that, you're playing with house money.
Negotiation context
- It's been on market 21 days — a 2% lower offer ($39k) is reasonable based on typical stale-listing flexibility.
- 2 sale attempts since 6y ago; this cycle's ask has dropped $8k (17%) from the opening price — seller is motivated, your offer sets the floor, not the list.
Risks & watch-outs
- Watch-outs: HOA is 27% of rent.
Questions for the listing agent
- Have any recent inspections been done? Can we get a copy of the seller's disclosures and any deferred-maintenance estimates?
- What does the HOA fee cover, when was the last increase, and are there any pending special assessments or reserve-fund shortfalls?
- Is there a deadline driving the sale (1031 exchange, divorce, estate, relocation)? That informs how much negotiation room exists.
- The area grade is low — what's the realistic commute time and amenity access for the typical tenant pool here? Any planned neighborhood developments (good or bad) we should know about?
- What's the average days-on-market for RENTAL listings here right now (not sales)? A rising rental-DOM trend means longer vacancies and softer asking-rent achievability than the comps imply.
- What's the recent tenant-quality profile in this submarket — average credit score on applications, eviction rate, late-payment / NSF rate, and stable-employment percentage? A property-management company in the area should have these aggregated.
- How much new for-sale + rental construction is in the pipeline within 1–3 miles? Heavy new supply typically softens prices + rents 12–24 months out; constrained supply supports both.
Investment metrics
- 1% rule
- 4.93% ✓
- Cap rate
- 28.60%
- Cash-on-cash
- 79.66%
- DSCR
- 4.54
- GRM
- 1.7
CMA / ARV
- ARV (on-the-fly)
- $40,128
- Comps found
- 3
Show comp detail 3 sales within ~0.75 mi
| Address | Dist | Beds/Ba | Sqft | Sold | Price | $/sf | Match |
|---|---|---|---|---|---|---|---|
| 3103 Twin City Dr | 0.10mi | 3/2.0 | 1,120 (-8%) | 1mo | $30,000 | $27 | 82 |
| 111 Tuttle Ave | 0.26mi | 3/2.0 | 1,216 (0%) | 16mo | $39,900 | $33 | 74 |
| 3217 Twin City Dr SE | 0.17mi | 3/2.0 | 1,280 (+5%) | 13mo | $74,900 | $59 | 73 |
Match score weights: distance 35% · size 25% · config 20% · recency 20%. Top-matched comps best support the ARV.
Projected returns pro-forma
-3.0% appreciation · 8.0% rent growth · sell at horizon
- IRR
- 88.4%
- Equity multiple
- 5.61×
- Total profit
- $51,648
- Equity at exit
- $5,964
- IRR
- 93.2%
- Equity multiple
- 14.82×
- Total profit
- $154,817
- Equity at exit
- $3,458
Cash invested: $11,200 (down + closing). Projections, not guarantees.
Landlord ↔ Tenant lean methodology
- Overall (STATE)
- 82 Strongly Landlord-Friendly
- State North Dakota
- 82 Strongly Landlord-Friendly · R+20
- County
- — inherits STATE
- City
- — inherits STATE
ZIP-level market 58554
- Rents YoY
- 14.0%
- Active inventory
- 304
- Price-to-rent
- 1.7×
Monthly cashflow live
- Estimated rent
- $1,971 high interval (Pro) →
- Mortgage (P&I)
- −$210
- Tax est. 1.5%
- −$50 /mo · $600/yr
- Insurance
- −$17
- HOA
- −$537
- Vacancy / Maint / Mgmt
- −$414
- Net cashflow
- $744
Break-even live
Sensitivity live
| Price | -10% $771 | -5% $757 | +0% $744 | +5% $730 | +10% $716 |
|---|---|---|---|---|---|
| Rent | -10% $588 | -5% $666 | +0% $744 | +5% $821 | +10% $899 |
| Rate | -1.0pp $764 | -0.5pp $754 | base $744 | +0.5pp $733 | +1.0pp $723 |
UW: 25.0% down · 7.5% · 30yr · 1.5% tax · 5.0% vac · 8.0% maint · 8.0% mgmt
Financing live
Cash to close
- Down payment
- $10,000
- Closing costs
- $1,200
- Reserves months
- —
- Total cash needed
- —
Loan-product check · same deal, 3 products live
Conventional
25% down · 7.5% · 30yr
- Down + closing
- —
- Monthly P&I
- —
- Monthly cashflow
- —
- DSCR
- —
- Eligible?
- —
Personal DTI + credit; lowest rate.
DSCR
20% down · 8.5% · 30yr
- Down + closing
- —
- Monthly P&I
- —
- Monthly cashflow
- —
- DSCR
- —
- Eligible?
- —
No personal income docs; deal must DSCR.
Hard money
10% down · 12.0% · 12mo
- Down + closing
- —
- Monthly P&I
- —
- Monthly cashflow
- —
- DSCR
- —
- Eligible?
- —
Short-term bridge; refi at stabilization.
Rent comps 13 comps
| Address | Beds | Baths | Sqft | Rent | $/sqft | DOM | Units | Dist |
|---|---|---|---|---|---|---|---|---|
| 4430 21st St SE Mandan, ND | 2.0 | 1.5 | 1173 | $1,525 | $1.30 | 22d | 2 | 0.95mi |
| 4302 Shoal Loop SE Mandan, ND | 2.0 | 1.0–2.0 | 1063 | $1,355 | $1.27 | 22d | 2 | 1.07mi |
| 2303 Shoal Loop SE Mandan, ND | 1.0–3.0 | 1.0–2.0 | 1088 | $1,790 | $1.65 | 22d | 10 | 1.09mi |
| 2508 Aquarius Ave Mandan, ND | 3.0 | 2.0 | 1391 | $2,795 | $2.01 | 22d | 1 | 1.12mi |
| 2512 Aquarius Ave SE Mandan, ND | 2.0 | 2.0 | 1289 | $2,695 | $2.09 | 22d | 1 | 1.12mi |
| 2516 Aquarius Ave SE Mandan, ND | 2.0 | 2.0 | 1289 | $2,695 | $2.09 | 22d | 1 | 1.13mi |
| 2520 Aquarius Ave SE Mandan, ND | 2.0 | 2.0 | 1289 | $2,695 | $2.09 | 22d | 1 | 1.14mi |
| 3923 Libra Bnd SE Mandan, ND | 2.0 | 2.0 | 1289 | $2,695 | $2.09 | 22d | 1 | 1.14mi |
| 3816 Libra Bnd SE Mandan, ND | 4.0 | 2.0 | 1391 | $2,445 | $1.76 | 22d | 1 | 1.15mi |
| 2300 46th Ave SE Mandan, ND | 1.0–3.0 | 1.0–2.0 | 1050 | $1,395 | $1.33 | 22d | 1 | 1.22mi |
| 1825 Burnt Boat Dr Bismarck, ND | 2.0 | 1.0 | 825 | $1,045 | $1.27 | 22d | 2 | 1.27mi |
| 4540 McKenzie Dr SE Unit 4 Mandan, ND | 2.0 | 2.0 | 1159 | $1,500 | $1.29 | 22d | 1 | 1.30mi |
| 2304 Marina Rd SE Unit 1 Mandan, ND | 2.0 | 2.0 | 1109 | $2,300 | $2.07 | 22d | 1 | 1.30mi |
HOA detail
- Monthly dues
- $537 · $6,444/yr
- Likely covers
- gas
Listing history 20 events
-
2026-06-19days on market $40,000 Active 21 DOM
-
2026-06-18days on market $40,000 Active 20 DOM
-
2026-06-17days on market $40,000 Active 19 DOM
-
2026-06-16days on market $40,000 Active 18 DOM
-
2026-06-15price $40,000 Active 17 DOM
-
2026-06-15days on market $48,000 Active 17 DOM
-
2026-06-14days on market $48,000 Active 15 DOM
-
2026-06-13days on market $48,000 Active 14 DOM
-
2026-06-10days on market $48,000 Active 12 DOM
-
2026-06-09days on market $48,000 Active 11 DOM
-
2026-06-08days on market $48,000 Active 10 DOM
-
2026-06-07days on market $48,000 Active 9 DOM
-
2026-06-05days on market $48,000 Active 6 DOM
-
2026-06-03days on market $48,000 Active 5 DOM
-
2026-06-02days on market $48,000 Active 4 DOM
-
2026-06-01days on market $48,000 Active 3 DOM
-
2026-05-31days on market $48,000 Active 2 DOM
-
2026-05-23$48,000 Active
-
2021-06-16soldstatus 476-char remark
Show marketing remark (476 chars)
Check out this 3 bedroom 2 bath manufactured home built in 2008 and freshly painted. The master bedroom has a bathroom and walk-in closet. There are two additional bedrooms and full bath. The kitchen and dining have many cabinets, newer appliances which include a gas stove. The front porch is covered, maintenance free decking and railings (not stairs) and there is an attached entry on the side that is insulated and ready to be finished to your needs. CAUTION ALLERGY: CATS
-
2020-08-26$39,900 476-char remark
Show marketing remark (476 chars)
Check out this 3 bedroom 2 bath manufactured home built in 2008 and freshly painted. The master bedroom has a bathroom and walk-in closet. There are two additional bedrooms and full bath. The kitchen and dining have many cabinets, newer appliances which include a gas stove. The front porch is covered, maintenance free decking and railings (not stairs) and there is an attached entry on the side that is insulated and ready to be finished to your needs. CAUTION ALLERGY: CATS
ⓘ Source: listings_history table (triggers on properties + properties_extension) + one-shot
backfill from property_details.listing_events for pre-trigger history.
Climate risk First Street
- Flood 1/10 Low FEMA zone X (shaded) · 0% chance over 30 yrs
- Wildfire 4/10 Moderate
- Heat 2/10 Low 7 d/yr ≥96°F today · 12 d/yr by 30 yrs out
- Wind 2/10 Low
- Air quality 4/10 Moderate 5 unhealthy d/yr today · 5 by 30 yrs out
Nearby sold comps map
Loading sold comps map…
Walkable amenities ~0.75 mi
Loading nearby amenities…
Taxation est. · year 1
- Rental income
- $23,650
- − Mortgage interest
- −$2,241
- − Property taxes
- −$600
- − Insurance
- −$200
- − Repairs & maintenance
- −$1,892
- − Management
- −$1,892
- − HOA
- −$6,444
- − Depreciation
- −$1,164
- Taxable income
- $9,218
- Est. tax owed @ 24.0%
- −$2,212
- After-tax cash flow
- $6,710/yr
For passive investors: Depreciation is non-cash, so a rental often shows a tax loss while cash-flowing — sheltering income. Rental losses are passive: they offset passive income freely, and up to $25,000/yr can offset ordinary (W-2) income if you actively participate and your MAGI is under $100k (phasing out to $0 by $150k); unused losses carry forward. On sale, claimed depreciation is recaptured at up to 25%, and gains may owe capital-gains tax (a 1031 exchange can defer both). Figures are a year-1 estimate at your 24.0% rate — not tax advice; consult a CPA.
Condition & rehab AI · 12 photos
This manufactured home requires moderate repairs and updates to improve its condition and value. Key areas for improvement include painting, updating fixtures, and landscaping.
Repairs flagged
- Minor kitchen cabinets — existing condition
- Minor bathroom fixtures — existing condition
- Minor exterior siding — existing condition
- Minor interior walls/paint — existing condition
- Minor landscaping — existing lawn
Value-add opportunities
- Resale paint interior walls — enhances curb appeal
- Resale replace carpet — improves comfort and appearance
- Resale update kitchen cabinets — modernizes space
- Resale update bathroom fixtures — modernizes space
- Resale update exterior siding — enhances curb appeal
- Resale landscaping — enhances curb appeal
Renovation cost estimate screening
| Repair item | Severity | Est. cost |
|---|---|---|
| kitchen cabinets · existing condition | Minor | $500–3,000 |
| bathroom fixtures · existing condition | Minor | $500–3,000 |
| exterior siding · existing condition | Minor | $500–3,000 |
| interior walls/paint · existing condition | Minor | $500–3,000 |
| landscaping · existing lawn | Minor | $500–3,000 |
| Total estimated repair cost · 5 items | $2,500–15,000 |
Value-add ROI direction
- Resale paint interior walls — enhances curb appeal ↑
- Resale replace carpet — improves comfort and appearance ↑
- Resale update kitchen cabinets — modernizes space ↑
- Resale update bathroom fixtures — modernizes space ↑
- Resale update exterior siding — enhances curb appeal ↑
- Resale landscaping — enhances curb appeal ↑
ⓘ Cost ranges are severity-bucket heuristics (US national rule-of-thumb). Get contractor quotes + a written scope before underwriting a rehab budget.
Schools (NCES district)
- District
- Mandan 1
- NCES district ID
- 3811820
- Math proficiency
- 35% ▼ -11.00%
- Reading proficiency
- 38% ▼ -5.00%
- Median HH income
- $60,131
- Composite
- 32.55/100
- National rank
- #5692
- State rank
- #32 of 53 in ND
Livability — Mandan
- Score
- 70/100
- State rank
- #76
- US rank
- #7567
Category grades
Schools grade is shown separately in the Schools card above.
Census & demographics
- Census place
- Mandan, ND
- County
- Morton County · 29,479 people
- City population
- 29,479
- Metro
- Bismarck, ND
- Population (ZIP)
- 29,479
- Household income
- $80,120
- Rent vs Own
- Severe rent burden
- 915.0
Population outlook (Morton County) Hauer SSP2
- Today (2025)
- 36,682 people
- By 2030
- 39,967 · +9.0%
- By 2040
- 46,921 · +27.9%
- By 2050
- 54,157 · +47.6%
- By 2075
- 73,661 · +100.8%
- By 2100
- 89,885 · +145.0%
Race, ethnicity, and origin ACS 2023
- Neighborhood character
- Predominantly White (87%)
- Race & ethnicity
- White 87% Hispanic / Latino 5% Native American 4% Two or more races 4% Black 2%
- Common ancestry
- Portuguese 14% Scotch-Irish 4% Iranian 2%
- Foreign-born
- 1% · Canada
- Languages at home
- 95% English-only · Spanish 3% German/W. Germanic 1%
Political lean MEDSL · Morton
- 2024 margin
- Solid R (+53.8) · D 22.2% · R 75.9% · Other 1.9%
- 2008→2024 swing
- -32.7pp toward R · 2008: -21.0pp · 2024: -53.8pp
- All cycles
- 2024: R+53.8 2020: R+50.4 2016: R+53.0 2012: R+31.1 2008: R+21.0
Not yet ingested
- Civics
- —
Market trends
- HPI YoY
- ▼ -161.81%
- Current HPI
- 137.8984
- Rent YoY
- ▲ 14.00%
- Metro
- Bismarck, ND
- State GDP YoY
- ▲ 2.09%
- F500 in state
- 2
Industry mix (Fortune 500 HQ in ND)
| Industry | F500 HQs | Revenue |
|---|---|---|
| Utilities / Construction | 1 | $6B |
|
||
Price history
+20.3% since first listed3 events — show timeline
- 2026-05-23 Listed $48,000 GNMLS
- 2021-06-16 Sold (MLS) — GNMLS
- 2020-08-26 Listed $39,900 GNMLS
Cash-flow waterfall
monthlySold comps — $/sqft
last 12 mo · ≤1 miLoading sold comps…