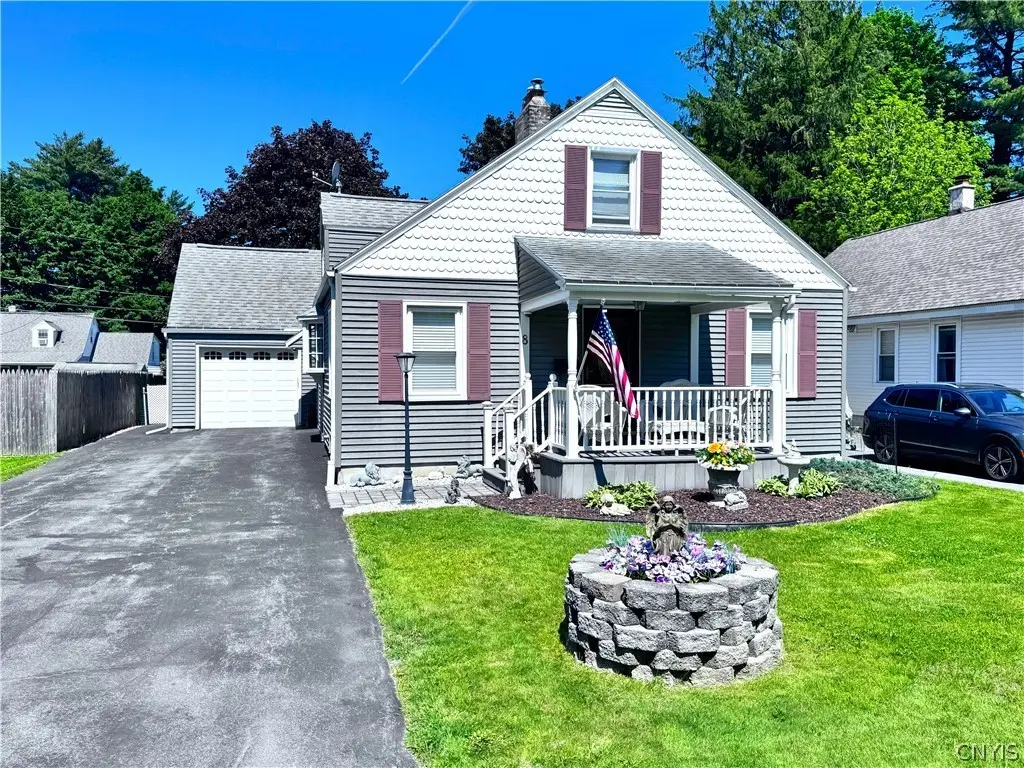
8 Hara Cres · New York Mills, NY
Flood risk 1/10 · Minimal
- FEMA flood zone
- X (unshaded)
- Chance of flooding over 30 yrs
- 0.0%
- Est. flood insurance / yr
- $473 – $860
Fire risk 1/10 · Minimal
- Est. fire insurance / yr
- $691 – $1,283
Heat risk 3/10 · Minor
- Hot days now (above 95°F)
- 7 days/yr
- Hot days in 30 yrs
- 16 days/yr
Wind risk 1/10 · Minimal
- Chance of severe wind over 30 yrs
- 1.0%
Air-quality risk 2/10 · Minimal
- Unhealthy air days now
- 0 days/yr
- Unhealthy air days in 30 yrs
- 2 days/yr
Risk factors via First Street. Map © Google.
Why this score? — see what drove the D- grade
The composite is a weighted blend of 9 inputs, each scored 0–100. Each bar is that input's sub-score; the figure is the points it added to the 100-point composite (weight × sub-score).
- Cash flow +11.9/30.0
- Schools +6.1/10.0
- Livability +3.9/5.0
- DSCR +3.5/10.0
- 1% rule +2.9/10.0
- Rent growth +2.5/5.0
- Condition / age +2.5/5.0
- ARV discount +1.8/15.0
- Appreciation +0.0/10.0
$249,900
🖨 Deal sheet (PDF) 📄 Offer letter ✓ Due diligence
Listing remarks
Just when you thought it wasn't out there. .. look again, brand new to the market is this desirable Cape in New Hartford. It doesn't get any better than this, in this pristine-clean 2 bedroom 1.5 bath home. Meticulously kept. .. Definately, Expandable. .. You betcha, the entire 2nd floor has yet to be developed into whatever visionary living space you can imagine, increasing your 1200sf of living space to 1800sf per public records. That's what can be, let's focus on what it has, it's a home with great curb appeal, from the trex constructed maintenance-free covered front porch to the oversized trex rear deck with an awning & everything special in-between, like the rich wood-tones of th
Key facts
- Gas fireplace
- Cape in new hartford
- Spacious living room
Tags
Property features AI
Exterior
- Parking: Attached garage with one space; Driveway parking; Garage door opener; Garage with electricity and storage
- Utilities: Public water (connected); Sewer connected; Cable available; Circuit breaker electric
- Home design: Single-story; Vinyl siding; Asphalt shingle roof; Entry level: main; Resale property; City street frontage; Irregular residential lot (50 x 130)
- Construction: Built (existing); Vinyl siding construction; Block foundation
- Exterior features: Awning(s); Blacktop driveway; Deck; Covered porch; Open porch; Fully fenced, private yard; Shed(s)/storage; See remarks
Interior
- Kitchen: Dishwasher; Electric oven; Electric range; Range hood; Refrigerator; Exhaust fan; Solid surface counters; Eat-in kitchen
- Bedrooms: Two main-level bedrooms
- Flooring: Hardwood; Vinyl; Varied flooring
- Bathrooms: One full bathroom; One half bathroom; One main-level bathroom
- Heating & cooling: Gas heating; Baseboard heating; Hot water heating
- Interior features: Ceiling fan(s); Eat-in kitchen; Separate/formal living room; Solid surface counters; Convertible bedroom; Main level primary; Workshop; Thermal windows
- Laundry & utility: Laundry in basement; Gas water heater
Neighborhood map
What this means for you Summary
Snapshot
- This is a 2-bed/1.0-bath single-family listed at $250k.
Deal economics
- At list price, monthly cash flow is $-63 ($-760/yr) — negative.
- To cash-flow at today's rent, offer at most $239k (4.5% below list).
- To meet the 1% rule (rent ≥ 1% of price), the offer needs to be $198k (20.7% below list).
- Recommended offer: $198k (20.7% below list) — sets the bar for 1% rule.
Location & tenants
- Location reads 78/100 on livability (#175 in NY, #2,712 nationally) — a middle-class / working-renter tenant base. Strengths: health & safety A+, cost of living A, housing A; Watch: amenities F, commute F.
- New Hartford Central School District (suburban): math 65% / reading 76% proficiency, ranked #128 of 590 in NY (top 22%) — strong family-tenant draw, lease renewals of 3-5y typical; only 9% free/reduced lunch — higher-income household profile.
- Zoned schools: Myles Elementary School (math 47% / reading 67%, grade C+, #842 of 2,108 statewide, top 43%, 355 students, 34% FRL); Perry Junior High School (math 52% / reading 72%, grade B+, #136 of 729 statewide, top 20%, 584 students, 21% FRL); New Hartford Senior High School (math 98% / reading 87%, grade A+, #158 of 1,100 statewide, top 15%, 645 students, 19% FRL) — zoned schools average 25% FRL vs 9% district-wide (15 pts higher); higher-poverty schools than district average — tighter screening recommended.
- Market conditions: 101 active listings in the ZIP; 5 comparable units currently listed for rent nearby; rentals lingering (median 46d on market — plan ~5-8 weeks vacancy on turnover, expect pricing pressure); 100% of comp listings sitting > 30 days — soft ceiling on asking rent; solid renter incomes; 204 units permitted in Oneida County in 2024 (68 in 5+ unit buildings).
Forward outlook
- Local home prices are declining (-3.0%/yr); year-one equity from $2k of loan paydown is wiped out by about $7k of value loss. Plan a longer hold.
- Oneida County population projected at -12% by 2050 — secular population decline; favor cash flow + early exit over multi-decade hold.
Negotiation context
- Only 3 days on market — expect competitive offers; lowballing is unlikely to land.
- Current owner paid $48k; list at $250k implies a 421% gain — meaningful room to come down on a strong offer.
Risks & watch-outs
- Watch-outs: built in 1949 — expect roof / HVAC / electrical / plumbing capex.
Questions for the listing agent
- What do current leases actually rent for vs. the listed asking? Can we see a recent rent roll and the last 12 months of T-12 income?
- Built in 1949 — when were the roof, HVAC, electrical panel, plumbing, and water heater last replaced?
- Is there a deadline driving the sale (1031 exchange, divorce, estate, relocation)? That informs how much negotiation room exists.
- Schools are B-rated — typically a magnet for longer-tenancy family renters. What's the average tenant stay here, and is there a school-zone premium baked into asking?
- The area grade is low — what's the realistic commute time and amenity access for the typical tenant pool here? Any planned neighborhood developments (good or bad) we should know about?
- What's the average days-on-market for RENTAL listings here right now (not sales)? A rising rental-DOM trend means longer vacancies and softer asking-rent achievability than the comps imply.
- What's the recent tenant-quality profile in this submarket — average credit score on applications, eviction rate, late-payment / NSF rate, and stable-employment percentage? A property-management company in the area should have these aggregated.
- How much new for-sale + rental construction is in the pipeline within 1–3 miles? Heavy new supply typically softens prices + rents 12–24 months out; constrained supply supports both.
Investment metrics
- 1% rule
- 0.79% ✗
- Cap rate
- 5.99%
- Cash-on-cash
- -1.09%
- DSCR
- 0.95
- GRM
- 10.5
CMA / ARV
- ARV (on-the-fly)
- $222,000
- Comps found
- 12
Show comp detail 12 sales within ~0.75 mi
| Address | Dist | Beds/Ba | Sqft | Sold | Price | $/sf | Match |
|---|---|---|---|---|---|---|---|
| 21 Hara Cres | 0.09mi | 3/1.5 (+1) | 1,160 (-3%) | 4mo | $250,000 | $216 | 80 |
| 7 Greatview Pl | 0.31mi | 2/1.0 | 1,216 (+1%) | 13mo | $255,000 | $210 | 72 |
| 20 Balsam Cres | 0.42mi | 2/1.0 | 1,071 (-11%) | 1mo | $195,000 | $182 | 62 |
| 64 Merritt Pl | 0.30mi | 3/2.0 (+1) | 1,246 (+4%) | 11mo | $260,000 | $209 | 62 |
| 1 Osborn Rd | 0.07mi | 3/1.0 (+1) | 1,071 (-11%) | 16mo | $189,000 | $176 | 61 |
| 27 Allman Pl | 0.24mi | 3/1.0 (+1) | 1,080 (-10%) | 11mo | $210,500 | $195 | 58 |
| 103 Merritt Pl | 0.38mi | 3/1.0 (+1) | 1,031 (-14%) | 1mo | $222,500 | $216 | 52 |
| 6 Helen Ave | 0.25mi | 3/2.0 (+1) | 1,348 (+12%) | 10mo | $250,000 | $185 | 51 |
| 44 Golf Ave | 0.74mi | 3/1.0 (+1) | 1,181 (-2%) | 10mo | $200,000 | $169 | 50 |
| 81 Oakdale Ave S | 0.56mi | 3/2.0 (+1) | 1,139 (-5%) | 9mo | $210,000 | $184 | 49 |
| 11 Pinecrest Rd | 0.63mi | 3/1.0 (+1) | 1,145 (-5%) | 17mo | $185,000 | $162 | 44 |
| 27 Arbor Dr | 0.63mi | 3/1.0 (+1) | 1,025 (-15%) | 12mo | $185,000 | $180 | 32 |
Match score weights: distance 35% · size 25% · config 20% · recency 20%. Top-matched comps best support the ARV.
Projected returns pro-forma
-3.0% appreciation · 3.0% rent growth · sell at horizon
- IRR
- -18.1%
- Equity multiple
- 0.36×
- Total profit
- $-44,560
- Equity at exit
- $37,261
- IRR
- -10.4%
- Equity multiple
- 0.37×
- Total profit
- $-44,121
- Equity at exit
- $21,607
Cash invested: $69,972 (down + closing). Projections, not guarantees.
Landlord ↔ Tenant lean methodology
- Overall (STATE)
- 15 Strongly Tenant-Friendly
- State New York
- 15 Strongly Tenant-Friendly · D+10
- County
- — inherits STATE
- City
- — inherits STATE
ZIP-level market 13413
- Active inventory
- 101
- Price-to-rent
- 10.5×
Monthly cashflow live
- Estimated rent
- $1,981 high interval (Pro) →
- Mortgage (P&I)
- −$1,311
- Tax from tax record
- −$214 /mo · $2,569/yr
- Insurance
- −$104
- HOA
- −$0
- Vacancy / Maint / Mgmt
- −$416
- Net cashflow
- $-63
Break-even live
Sensitivity live
| Price | -10% $78 | -5% $7 | +0% $-63 | +5% $-134 | +10% $-205 |
|---|---|---|---|---|---|
| Rent | -10% $-220 | -5% $-142 | +0% $-63 | +5% $15 | +10% $93 |
| Rate | -1.0pp $62 | -0.5pp $0 | base $-63 | +0.5pp $-128 | +1.0pp $-194 |
UW: 25.0% down · 7.5% · 30yr · 1.5% tax · 5.0% vac · 8.0% maint · 8.0% mgmt
Financing live
Cash to close
- Down payment
- $62,475
- Closing costs
- $7,497
- Reserves months
- —
- Total cash needed
- —
Loan-product check · same deal, 3 products live
Conventional
25% down · 7.5% · 30yr
- Down + closing
- —
- Monthly P&I
- —
- Monthly cashflow
- —
- DSCR
- —
- Eligible?
- —
Personal DTI + credit; lowest rate.
DSCR
20% down · 8.5% · 30yr
- Down + closing
- —
- Monthly P&I
- —
- Monthly cashflow
- —
- DSCR
- —
- Eligible?
- —
No personal income docs; deal must DSCR.
Hard money
10% down · 12.0% · 12mo
- Down + closing
- —
- Monthly P&I
- —
- Monthly cashflow
- —
- DSCR
- —
- Eligible?
- —
Short-term bridge; refi at stabilization.
Rent comps 5 comps
| Address | Beds | Baths | Sqft | Rent | $/sqft | DOM | Units | Dist |
|---|---|---|---|---|---|---|---|---|
| 77 Clinton St New York Mills, NY | 2.0 | 1.0 | 777 | $1,450 | $1.86 | 45d | 7 | 1.03mi |
| 167 Clinton Rd New Hartford, NY | 3.0 | 1.0–2.5 | 1063 | $2,433 | $2.29 | 45d | 15 | 1.09mi |
| 4770 Middle Settlement Rd Whitesboro, NY | 1.0–2.0 | 1.0 | 725 | $2,085 | $2.88 | 45d | 1 | 1.12mi |
| 112 Copeland Ct Unit 520 New Hartford, NY | 1.0 | 1.0 | 800 | $1,700 | $2.12 | 45d | 1 | 1.13mi |
| 118 Copeland Ct Apt 205 New Hartford, NY | 2.0 | 2.0 | 1200 | $2,100 | $1.75 | 45d | 1 | 1.15mi |
Listing history 4 events
-
2026-06-01statusdays on market $249,900 Pending 3 DOM
-
2026-05-31days on market $249,900 Active 2 DOM
-
2026-05-29$249,900 Active
-
1995-03-24soldstatus $48,000
ⓘ Source: listings_history table (triggers on properties + properties_extension) + one-shot
backfill from property_details.listing_events for pre-trigger history.
Tax reassessment forecast NY · Partial reset (capped growth)
- Current annual tax
- $2,569 · $214/mo
- Projected year-2 tax
- $3,396 · $283/mo
- Expected delta
- +$827/yr (+$69/mo · 32.2%)
ⓘ Screening estimate from a state-policy table — verify with the county assessor before closing.
Climate risk First Street
- Flood 1/10 Low FEMA zone X (unshaded) · 0% chance over 30 yrs
- Wildfire 1/10 Low
- Heat 3/10 Moderate 7 d/yr ≥95°F today · 16 d/yr by 30 yrs out
- Wind 1/10 Low 100% chance of damaging wind over 30 yrs
- Air quality 2/10 Low 0 unhealthy d/yr today · 2 by 30 yrs out
Nearby sold comps map
Loading sold comps map…
Walkable amenities ~0.75 mi
Loading nearby amenities…
Taxation est. · year 1
- Rental income
- $23,777
- − Mortgage interest
- −$13,998
- − Property taxes
- −$2,569
- − Insurance
- −$1,250
- − Repairs & maintenance
- −$1,902
- − Management
- −$1,902
- − Depreciation
- −$7,270
- Taxable loss
- −$5,113
- Est. tax savings @ 24.0%
- +$1,227
- After-tax cash flow
- $467/yr
For passive investors: Depreciation is non-cash, so a rental often shows a tax loss while cash-flowing — sheltering income. Rental losses are passive: they offset passive income freely, and up to $25,000/yr can offset ordinary (W-2) income if you actively participate and your MAGI is under $100k (phasing out to $0 by $150k); unused losses carry forward. On sale, claimed depreciation is recaptured at up to 25%, and gains may owe capital-gains tax (a 1031 exchange can defer both). Figures are a year-1 estimate at your 24.0% rate — not tax advice; consult a CPA.
Schools (NCES district)
- District
- New Hartford Central School District
- NCES district ID
- 3620370
- Math proficiency
- 65% ▼ -7.00%
- Reading proficiency
- 76% ▲ 5.00%
- Median HH income
- $67,028
- Composite
- 61.37/100
- National rank
- #769
- State rank
- #128 of 590 in NY
Livability — New York Mills
- Score
- 78/100
- State rank
- #175
- US rank
- #2712
Category grades
Schools grade is shown separately in the Schools card above.
Census & demographics
- County
- Oneida County · 89,710 people
- City population
- 3,012
- Metro
- Utica-Rome, NY
- Population (ZIP)
- 16,742
- Household income
- $95,261
- Rent vs Own
- Severe rent burden
- 395.0
Population outlook (Oneida County) Hauer SSP2
- Today (2025)
- 225,223 people
- By 2030
- 220,384 · -2.1%
- By 2040
- 209,071 · -7.2%
- By 2050
- 197,920 · -12.1%
- By 2075
- 175,541 · -22.1%
- By 2100
- 148,491 · -34.1%
Race, ethnicity, and origin ACS 2023
- Neighborhood character
- Predominantly White (88%)
- Race & ethnicity
- White 88% Asian 4% Hispanic / Latino 3% Two or more races 3%
- Common ancestry
- Romanian 8% Lithuanian 4% Subsaharan African 3%
- Foreign-born
- 11% · Vietnam, China, Canada
- Languages at home
- 86% English-only · Other Indo-European 4% Other Asian/Pacific 3% Russian/Polish/Slavic 2%
Political lean MEDSL · Oneida
- 2024 margin
- Strong R (+21.3) · D 39.4% · R 60.6%
- 2008→2024 swing
- -15.2pp toward R · 2008: -6.1pp · 2024: -21.3pp
- All cycles
- 2024: R+21.3 2020: R+15.5 2016: R+21.1 2012: R+5.3 2008: R+6.1
Not yet ingested
- Civics
- —
Market trends
- HPI YoY
- ▼ -210.17%
- Current HPI
- 295.4235
- Rent YoY
- —
- Metro
- Utica-Rome, NY
- State GDP YoY
- ▲ 2.60%
- F500 in state
- 92
Industry mix (Fortune 500 HQ in NY)
| Industry | F500 HQs | Revenue |
|---|---|---|
| Financial Services | 10 | $950B |
|
||
| Consumer Goods | 9 | $162B |
|
||
| Insurance | 4 | $225B |
|
||
| Telecommunications | 2 | $144B |
|
||
| Pharmaceuticals | 2 | $112B |
|
||
| Media / Entertainment | 2 | $69B |
|
||
Price history
+420.6% since first listed2 events — show timeline
- 2026-05-29 Listed $249,900 CNYIS
- 1995-03-24 Sold (Public Records) $48,000 Public Records
Property tax history
+12.2%/yrLatest (2025): $2,569 · +3.4% YoY. Source: county tax records.
Cash-flow waterfall
monthlySold comps — $/sqft
last 12 mo · ≤1 miLoading sold comps…