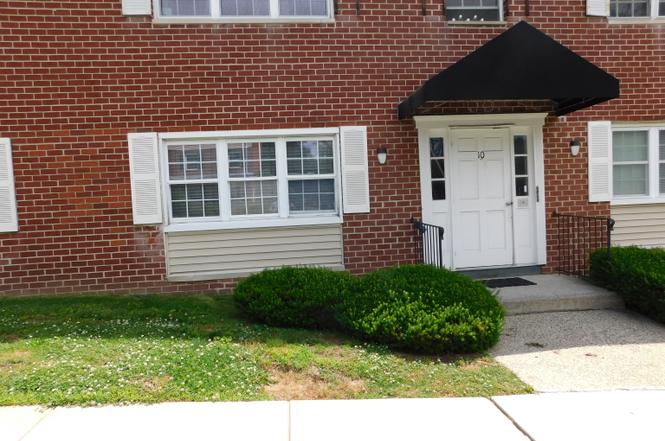
50 Greenhouse Rd Unit 10A · Bridgeport, CT
Flood risk 1/10 · Minimal
- FEMA flood zone
- X (unshaded)
- Chance of flooding over 30 yrs
- 0.0%
- Est. flood insurance / yr
- $507 – $1,088
Fire risk 1/10 · Minimal
- Est. fire insurance / yr
- $829 – $1,539
Heat risk 6/10 · Moderate
- Hot days now (above 97°F)
- 7 days/yr
- Hot days in 30 yrs
- 15 days/yr
Wind risk 6/10 · Moderate
- Chance of severe wind over 30 yrs
- 41.0%
Air-quality risk 4/10 · Minor
- Unhealthy air days now
- 5 days/yr
- Unhealthy air days in 30 yrs
- 7 days/yr
Risk factors via First Street. Map © Google.
Why this score? — see what drove the C grade
The composite is a weighted blend of 9 inputs, each scored 0–100. Each bar is that input's sub-score; the figure is the points it added to the 100-point composite (weight × sub-score).
- Cash flow +24.3/30.0
- 1% rule +8.9/10.0
- DSCR +7.8/10.0
- ARV discount +7.5/15.0
- Livability +4.0/5.0
- Rent growth +3.3/5.0
- Condition / age +2.5/5.0
- Schools +1.2/10.0
- Appreciation +0.0/10.0
$209,900
🖨 Deal sheet (PDF) 📄 Offer letter ✓ Due diligence
Listing remarks MLS
Excellent Location. Adorable And Spacious First Floor Unit, Master Bedroom With Full Bath, And Great Closet Space. Subject To Lender Approval.
Key facts
- Private deck
- In-ground pool
- Ample closet space
Tags
Property features AI
Finance
- Other: Part of a 76-unit community; Nearby amenities: medical facilities, playground/tot lot, public transportation, shopping/mall, tennis courts
- Financial info: Professionally managed off-site; Pets allowed (up to 2 dogs of gentle disposition)
- HOA & community: HOA with monthly fee; Monthly HOA fee includes grounds maintenance, trash pickup, snow removal, hot water, water, property management, and pool service
Exterior
- Parking: Paved off-street parking; 1 parking space
- Utilities: Public water connected; Public sewer connected; Hot water: other
- Home design: Condominium (unit in Dellwood Gardens); Single-level unit
- Construction: Frame construction
- Exterior features: Brick siding; In-ground swimming pool with safety fence; Pool on-site (association amenity)
Interior
- Kitchen: Gas range; Refrigerator; Dishwasher
- Bedrooms: 2 bedrooms
- Bathrooms: 2 full bathrooms
- Heating & cooling: Hot air heat fueled by natural gas; Central air conditioning; Ceiling fans
- Interior features: 5 total rooms; Main-level laundry; Ceiling fans; Central air
- Laundry & utility: Laundry on main level
Neighborhood map
What this means for you Summary
Snapshot
- This is a 2-bed/2.0-bath condo listed at $210k.
Deal economics
- At list price, monthly cash flow is $424 ($5k/yr) — positive.
- The deal already cash-flows at list — no discount required.
- Meets the 1% rule at list price ($3k rent vs $210k).
- Cap rate 8.7% vs local median 5.0% in Bridgeport — top-decile yield for the area; either an underpriced asset or a hidden risk that comps aren't pricing in. Stress-test before assuming the spread holds.
Location & tenants
- Location reads 81/100 on livability (#15 in CT, #1,374 nationally) — a professional / high-income tenant draw. Strengths: amenities A+, commute A+, health & safety A+; Watch: crime C-, employment D+, schools D-.
- Bridgeport School District (urban): math 9% / reading 19% proficiency, ranked #151 of 153 in CT (top 99%) — low school quality limits family demand, transient renter base, plan for 1-2y turnover; 97% free/reduced lunch — lower-income household profile, screen leases tightly.
- Market conditions: Rents rising (+3.1%/yr); 152 active listings in the ZIP; 40 comparable units currently listed for rent nearby; rentals lingering (median 45d on market — plan ~5-8 weeks vacancy on turnover, expect pricing pressure); 50% of comp listings sitting > 30 days — soft ceiling on asking rent; 852 units permitted in Greater Bridgeport Planning Region in 2024 (698 in 5+ unit buildings).
- At $2,919/mo this rent would consume 48% of the median local household income ($73k/yr) (locally 2163% of renters already pay >50% of income on rent) — very limited rent-growth headroom before tenants either downsize or default.
Forward outlook
- Local home prices are declining (-3.0%/yr); year-one equity from $1k of loan paydown is wiped out by about $6k of value loss. Plan a longer hold.
Negotiation context
- Only 3 days on market — expect competitive offers; lowballing is unlikely to land.
- 3 sale attempts since 20y ago with the ask held roughly flat each time — persistent listings suggest the price (not the market) is what's stuck; bring a comps-based counter.
- Current owner paid $78k; list at $210k implies a 171% gain — meaningful room to come down on a strong offer.
Risks & watch-outs
- Climate carrying-cost: major wind risk, 41% chance of damaging wind over 30y; extreme-heat days projected 7→15/yr by 2055 (HVAC capex compounding) — expect insurance premiums to compound above CPI over the hold.
Questions for the listing agent
- Built in 1972 — when were the roof, HVAC, electrical panel, plumbing, and water heater last replaced?
- What does the HOA fee cover, when was the last increase, and are there any pending special assessments or reserve-fund shortfalls?
- Any open or pending special assessments — roof, HVAC, plumbing, elevator, façade? What's the per-unit balance and payoff schedule, and is the seller paying it off at close or rolling it to the buyer?
- Is there a deadline driving the sale (1031 exchange, divorce, estate, relocation)? That informs how much negotiation room exists.
- Schools are D-rated, which usually means shorter tenancies and higher turnover. Who's the typical renter profile here, and what's been the actual vacancy rate?
- What's the average days-on-market for RENTAL listings here right now (not sales)? A rising rental-DOM trend means longer vacancies and softer asking-rent achievability than the comps imply.
- What's the recent tenant-quality profile in this submarket — average credit score on applications, eviction rate, late-payment / NSF rate, and stable-employment percentage? A property-management company in the area should have these aggregated.
- How much new apartment / multifamily construction is in the pipeline within 1–3 miles? Heavy new supply (>2% of stock underway) typically softens rents 12–24 months out; light construction supports rent growth.
Investment metrics
- 1% rule
- 1.39% ✓
- Cap rate
- 8.72%
- Cash-on-cash
- 8.65%
- DSCR
- 1.38
- GRM
- 6.0
CMA / ARV
No comps found within radius.
Projected returns pro-forma
-3.0% appreciation · 3.12% rent growth · sell at horizon
- IRR
- -2.9%
- Equity multiple
- 0.89×
- Total profit
- $-6,363
- Equity at exit
- $31,297
- IRR
- 7.1%
- Equity multiple
- 1.54×
- Total profit
- $31,919
- Equity at exit
- $18,148
Cash invested: $58,772 (down + closing). Projections, not guarantees.
Landlord ↔ Tenant lean methodology
- Overall (STATE)
- 27 Tenant-Leaning
- State Connecticut
- 27 Tenant-Leaning · D+7
- County
- — inherits STATE
- City
- — inherits STATE
ZIP-level market 06606
- Rents YoY
- 3.1%
- Active inventory
- 152
- Price-to-rent
- 6.0×
Monthly cashflow live
- Estimated rent
- $2,919 high interval (Pro) →
- Mortgage (P&I)
- −$1,101
- Tax from tax record
- −$298 /mo · $3,581/yr
- Insurance
- −$87
- HOA
- −$396
- Vacancy / Maint / Mgmt
- −$613
- Net cashflow
- $424
Break-even live
Sensitivity live
| Price | -10% $543 | -5% $483 | +0% $424 | +5% $364 | +10% $305 |
|---|---|---|---|---|---|
| Rent | -10% $193 | -5% $308 | +0% $424 | +5% $539 | +10% $654 |
| Rate | -1.0pp $529 | -0.5pp $477 | base $424 | +0.5pp $369 | +1.0pp $314 |
UW: 25.0% down · 7.5% · 30yr · 1.5% tax · 5.0% vac · 8.0% maint · 8.0% mgmt
Financing live
Cash to close
- Down payment
- $52,475
- Closing costs
- $6,297
- Reserves months
- —
- Total cash needed
- —
Loan-product check · same deal, 3 products live
Conventional
25% down · 7.5% · 30yr
- Down + closing
- —
- Monthly P&I
- —
- Monthly cashflow
- —
- DSCR
- —
- Eligible?
- —
Personal DTI + credit; lowest rate.
DSCR
20% down · 8.5% · 30yr
- Down + closing
- —
- Monthly P&I
- —
- Monthly cashflow
- —
- DSCR
- —
- Eligible?
- —
No personal income docs; deal must DSCR.
Hard money
10% down · 12.0% · 12mo
- Down + closing
- —
- Monthly P&I
- —
- Monthly cashflow
- —
- DSCR
- —
- Eligible?
- —
Short-term bridge; refi at stabilization.
Rent comps 40 comps
| Address | Beds | Baths | Sqft | Rent | $/sqft | DOM | Units | Dist |
|---|---|---|---|---|---|---|---|---|
| 127 Kennedy Dr #127 Bridgeport, CT | 2.0 | 1.0 | 1023 | $2,250 | $2.20 | 13d | 1 | 0.27mi |
| 104 Kennedy Dr Bridgeport, CT | 2.0 | 1.0 | 1023 | $2,600 | $2.54 | 45d | 1 | 0.32mi |
| 333 Vincellette St #59 Bridgeport, CT | 1.0 | 1.0 | 975 | $2,000 | $2.05 | 13d | 1 | 0.35mi |
| 200 Woodmont Ave #127 Bridgeport, CT | 2.0 | 1.5 | 1184 | $2,600 | $2.20 | 25d | 1 | 0.45mi |
| 110 Grenelle St Bridgeport, CT | 3.0 | 1.0 | 1351 | $4,000 | $2.96 | 4d | 1 | 0.51mi |
| 192 Frenchtown Rd Bridgeport, CT | 3.0 | 3.5 | 1744 | $4,200 | $2.41 | 45d | 1 | 0.52mi |
| 130 Deramo Pl Bridgeport, CT | 3.0 | 1.5 | 1252 | $3,700 | $2.96 | 4d | 1 | 0.53mi |
| 56 Janet Cir #7 Bridgeport, CT | 2.0 | 2.0 | 1156 | $2,600 | $2.25 | 4d | 1 | 0.59mi |
| 127 Englewood Ave Bridgeport, CT | 3.0 | 2.0 | 1530 | $3,800 | $2.48 | 45d | 1 | 0.60mi |
| 23 Ochsner Pl Unit 1 Bridgeport, CT | 3.0 | 1.0 | 1250 | $3,800 | $3.04 | 45d | 1 | 0.64mi |
| 715 Frenchtown Rd #4 Bridgeport, CT | 2.0 | 1.5 | 1200 | $2,300 | $1.92 | 25d | 1 | 0.66mi |
| 715 Frenchtown Rd #40 Bridgeport, CT | 2.0 | 1.5 | 1200 | $2,500 | $2.08 | 45d | 1 | 0.66mi |
| 123 Folino Dr Bridgeport, CT | 3.0 | 1.5 | 1386 | $3,800 | $2.74 | 45d | 1 | 0.74mi |
| 15 Overland Ave Bridgeport, CT | 3.0 | 2.5 | 1713 | $4,700 | $2.74 | 45d | 1 | 0.74mi |
| 39 Lance Cir #39 Bridgeport, CT | 2.0 | 1.0 | 915 | $2,500 | $2.73 | 45d | 1 | 0.76mi |
| 5085 Main St Trumbull, CT | 1.0–2.0 | 1.0–2.0 | 985 | $3,175 | $3.22 | 4d | 9 | 0.80mi |
| 466 Merritt St Bridgeport, CT | 2.0 | 1.0 | 1650 | $1,800 | $1.09 | 45d | 1 | 0.80mi |
| 180 Pleasantview Ave Bridgeport, CT | 3.0 | 2.0 | 1373 | $3,700 | $2.69 | 45d | 1 | 0.85mi |
| 524 Beechmont Ave Bridgeport, CT | 3.0 | 1.0 | 1104 | $3,500 | $3.17 | 25d | 1 | 0.85mi |
| 275 Burnsford Ave Bridgeport, CT | 3.0 | 1.0 | 1116 | $3,200 | $2.87 | 25d | 1 | 0.87mi |
| 765 Birmingham St Bridgeport, CT | 3.0 | 1.0 | 1094 | $3,600 | $3.29 | 4d | 1 | 0.96mi |
| 28 Higgins Ave Bridgeport, CT | 2.0 | 1.0 | 1828 | $2,200 | $1.20 | 4d | 1 | 1.04mi |
| 1956 Madison Ave Unit 2 Bridgeport, CT | 2.0 | 2.0 | 1166 | $1,800 | $1.54 | 45d | 1 | 1.07mi |
| 74 Village Ln Bridgeport, CT | 3.0 | 2.0 | 1428 | $3,500 | $2.45 | 4d | 1 | 1.09mi |
| 51 Waller Rd Bridgeport, CT | 3.0 | 1.0 | 1219 | $2,600 | $2.13 | 45d | 1 | 1.11mi |
| 30 Quarry St Bridgeport, CT | 1.0–2.0 | 1.0 | 805 | $1,825 | $2.27 | 25d | 3 | 1.11mi |
| 4 Soundview Ave Unit NA Trumbull, CT | 2.0 | 2.0 | 1506 | $3,750 | $2.49 | 45d | 1 | 1.11mi |
| 46 Waller Rd Bridgeport, CT | 3.0 | 2.0 | 1598 | $3,800 | $2.38 | 12d | 1 | 1.13mi |
| 25 Rena Pl Fairfield, CT | 2.0 | 1.0 | 930 | $3,200 | $3.44 | 45d | 1 | 1.13mi |
| 845 Hart St Unit 2 Bridgeport, CT | 3.0 | 1.0 | 1200 | $2,500 | $2.08 | 45d | 1 | 1.16mi |
| 97 Wentworth St Unit 3 Bridgeport, CT | 2.0 | 1.0 | 950 | $2,000 | $2.11 | 4d | 1 | 1.17mi |
| 415 Savoy St Bridgeport, CT | 3.0 | 3.0 | 1850 | $3,500 | $1.89 | 45d | 1 | 1.19mi |
| 68-70 Westfield Ave Bridgeport, CT | 2.0 | 1.0 | 888 | $2,200 | $2.48 | 4d | 1 | 1.32mi |
| 454 Summit St Bridgeport, CT | 2.0 | 1.0 | 1010 | $2,000 | $1.98 | 45d | 1 | 1.36mi |
| 2496 Easton Tpke Unit B Fairfield, CT | 2.0 | 1.0 | 900 | $2,395 | $2.66 | 45d | 1 | 1.36mi |
| 156 Garden Dr Bridgeport, CT | 2.0 | 1.0 | 1176 | $2,400 | $2.04 | 45d | 1 | 1.36mi |
| 5545 Park Ave Fairfield, CT | 1.0–2.0 | 1.0–2.0 | 1040 | $3,900 | $3.75 | 4d | 1 | 1.37mi |
| 457 Summit St Bridgeport, CT | 3.0 | 1.5 | 1511 | $4,000 | $2.65 | 45d | 1 | 1.37mi |
| 100 Oakview Dr Trumbull, CT | 1.0–2.0 | 1.0–2.0 | 1028 | $3,390 | $3.30 | 4d | 1 | 1.39mi |
| 151-153 Alexander Ave Unit 1 Bridgeport, CT | 3.0 | 1.0 | 1100 | $2,400 | $2.18 | 13d | 1 | 1.41mi |
HOA detail condo
- Monthly dues
- $396 · $4,752/yr
- Assessments
- None detected in remarks — confirm with the listing agent.
Listing history 4 events
-
2026-06-18days on market $209,900 Active 3 DOM
-
2026-06-17days on market $209,900 Active 2 DOM
-
2026-06-15remarks 512-char remark
-
2026-06-15$209,900 Active 1 DOM
ⓘ Source: listings_history table (triggers on properties + properties_extension) + one-shot
backfill from property_details.listing_events for pre-trigger history.
Tax reassessment forecast CT · Partial reset (capped growth)
- Current annual tax
- $3,581 · $298/mo
- Projected year-2 tax
- $4,036 · $336/mo
- Expected delta
- +$455/yr (+$38/mo · 12.7%)
ⓘ Screening estimate from a state-policy table — verify with the county assessor before closing.
Climate risk First Street
- Flood 1/10 Low FEMA zone X (unshaded) · 0% chance over 30 yrs
- Wildfire 1/10 Low
- Heat 6/10 Major 7 d/yr ≥97°F today · 15 d/yr by 30 yrs out
- Wind 6/10 Major 41% chance of damaging wind over 30 yrs
- Air quality 4/10 Moderate 5 unhealthy d/yr today · 7 by 30 yrs out
Nearby sold comps map
Loading sold comps map…
Walkable amenities ~0.75 mi
Loading nearby amenities…
Taxation est. · year 1
- Rental income
- $35,033
- − Mortgage interest
- −$11,758
- − Property taxes
- −$3,581
- − Insurance
- −$1,050
- − Repairs & maintenance
- −$2,803
- − Management
- −$2,803
- − HOA
- −$4,752
- − Depreciation
- −$6,106
- Taxable income
- $2,181
- Est. tax owed @ 24.0%
- −$524
- After-tax cash flow
- $4,561/yr
For passive investors: Depreciation is non-cash, so a rental often shows a tax loss while cash-flowing — sheltering income. Rental losses are passive: they offset passive income freely, and up to $25,000/yr can offset ordinary (W-2) income if you actively participate and your MAGI is under $100k (phasing out to $0 by $150k); unused losses carry forward. On sale, claimed depreciation is recaptured at up to 25%, and gains may owe capital-gains tax (a 1031 exchange can defer both). Figures are a year-1 estimate at your 24.0% rate — not tax advice; consult a CPA.
Schools (NCES district)
- District
- Bridgeport School District
- NCES district ID
- 0900450
- Math proficiency
- 9% ▼ -7.00%
- Reading proficiency
- 19% ▼ -10.00%
- Median HH income
- $41,507
- Composite
- 12.09/100
- National rank
- #9656
- State rank
- #151 of 153 in CT
Livability — Bridgeport
- Score
- 81/100
- State rank
- #15
- US rank
- #1374
Category grades
Schools grade is shown separately in the Schools card above.
Census & demographics
- Census place
- Bridgeport, CT
- County
- Fairfield County · 765,532 people
- City population
- 149,153
- Metro
- Bridgeport-Stamford-Norwalk, CT
- Population (ZIP)
- 49,308
- Household income
- $73,372
- Rent vs Own
- Severe rent burden
- 2163.0
Population outlook (Greater Bridgeport County) Hauer SSP2
- By 2040
- 365,581
Race, ethnicity, and origin ACS 2023
- Neighborhood character
- Highly diverse neighborhood (Simpson 0.73)
- Race & ethnicity
- Hispanic / Latino 37% White 31% Black 19% Two or more races 11% Asian 7%
- Hispanic origin (detail)
- Mexican 5% Puerto Rican 12% Dominican 4%
- Common ancestry
- Estonian 5% Russian 4% Romanian 3%
- Foreign-born
- 37% · Canada, Jamaica, Vietnam
- Languages at home
- 50% English-only · Spanish 27% Other Indo-European 15% French/Haitian/Cajun 2%
Political lean MEDSL · Greater Bridgeport
- 2024 margin
- Strong D (+23.3) · D 60.9% · R 37.6% · Other 1.5%
- All cycles
- 2024: D+23.3
Not yet ingested
- Civics
- —
Market trends
- HPI YoY
- ▼ -270.11%
- Current HPI
- 345.647
- Rent YoY
- ▲ 3.12%
- Metro
- Bridgeport-Stamford-Norwalk, CT
- State GDP YoY
- ▲ 1.06%
- F500 in state
- 38
Industry mix (Fortune 500 HQ in CT)
| Industry | F500 HQs | Revenue |
|---|---|---|
| Industrial Machinery | 4 | $38B |
|
||
| Insurance | 3 | $71B |
|
||
| Financial Services | 2 | $25B |
|
||
| Transportation / Logistics | 2 | $18B |
|
||
| Healthcare | 1 | $247B |
|
||
| Telecommunications | 1 | $55B |
|
||
Price history
+47.8% since first listed8 events — show timeline
- 2026-06-15 Listed $209,900 Smart MLS
- 2012-08-29 Sold (MLS) $77,500 Smart MLS
- 2012-08-27 Sold (Public Records) $77,500 Public Records
- 2011-07-23 Listed $73,798 Smart MLS
- 2006-03-16 Sold (Public Records) $195,000 Public Records
- 2006-03-15 Sold (MLS) $195,000 Smart MLS
- 2006-01-13 Listed $199,000 Smart MLS
- 2004-05-04 Sold (Public Records) $142,000 Public Records
Property tax history
-3.9%/yrLatest (2023): $3,581 · +0.0% YoY. Source: county tax records.
Cash-flow waterfall
monthlySold comps — $/sqft
last 12 mo · ≤1 miLoading sold comps…