131 Main St N · Shakopee, MN
Flood risk 1/10 · Minimal
- FEMA flood zone
- X (unshaded)
- Chance of flooding over 30 yrs
- 0.0%
- Est. flood insurance / yr
- $507 – $1,088
Fire risk 2/10 · Minimal
- Est. fire insurance / yr
- $888 – $1,650
Heat risk 2/10 · Minimal
- Hot days now (above 99°F)
- 7 days/yr
- Hot days in 30 yrs
- 14 days/yr
Wind risk 2/10 · Minimal
- Chance of severe wind over 30 yrs
- —
Air-quality risk 2/10 · Minimal
- Unhealthy air days now
- 2 days/yr
- Unhealthy air days in 30 yrs
- 2 days/yr
Risk factors via First Street. Map © Google.
Why this score? — see what drove the D- grade
The composite is a weighted blend of 9 inputs, each scored 0–100. Each bar is that input's sub-score; the figure is the points it added to the 100-point composite (weight × sub-score).
- ARV discount +14.3/15.0
- Cash flow +7.2/30.0
- Schools +4.5/10.0
- Livability +4.5/5.0
- Rent growth +3.5/5.0
- Condition / age +2.5/5.0
- 1% rule +1.6/10.0
- DSCR +1.4/10.0
- Appreciation +0.0/10.0
$285,000
🖨 Deal sheet 📄 Offer letter ✓ Due diligence
Listing remarks MLS
THIS CHARMING STORY AND A HALF NEEDS LOTS of TLC but could be great renovation project. LARGE CORNER LOT, ROOM FOR A GARAGE, BRICK EXTERIOR, STAINED GLASS WINDOW, WOOD FLOORS & BEAUTIFUL WOODWORK INSIDE. POTENTIAL! Needs updates and repairs throughout.
Key facts
- Bonus room above
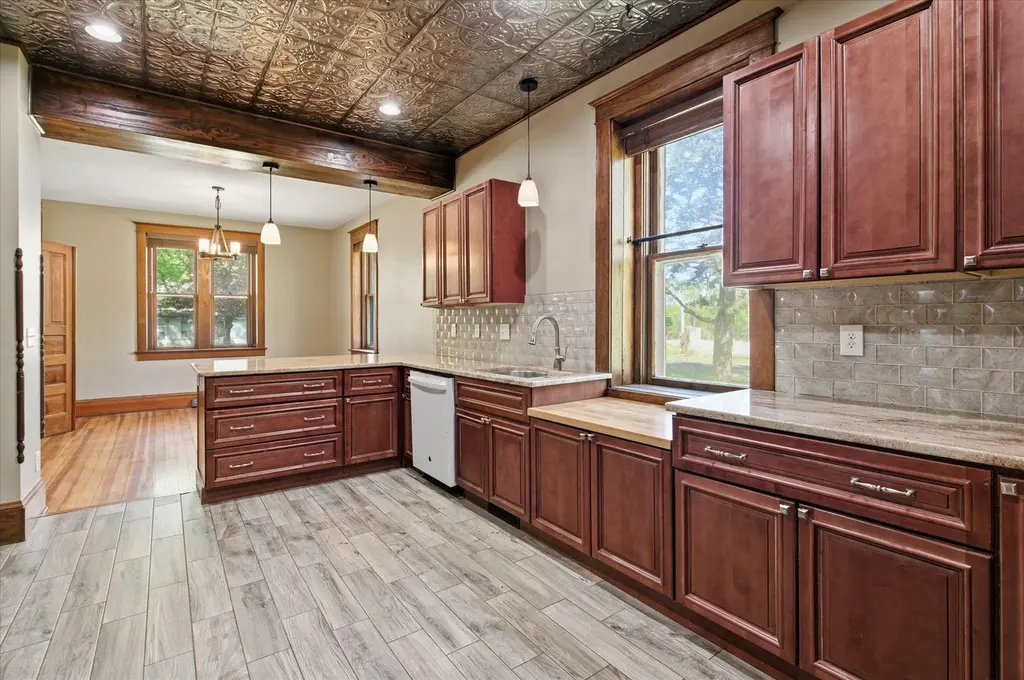
- Large kitchen
- Corner lot
Tags
Property features AI
Finance
- Other: Above-grade finished area approximately 1,782; Below-grade area approximately 933; Total building area approximately 2,715; Lot dimensions about 92 x 108 (0.23 acres)
Exterior
- Parking: Detached gravel parking area; 2-car garage (approximately 728 sq ft)
- Utilities: City water (connected); City sewer (connected); Natural gas
- Home design: Residential property; One-and-a-half story; Entry faces Main Street
- Construction: Brick and stone construction; Stone foundation; Foundation area approximately 933
- Exterior features: Patio; Front porch; Rear porch; Stone, vinyl, and wood exterior; Irregular lot; Road frontage on a city street
Interior
- Kitchen: Range; Microwave; Dishwasher; Refrigerator; Kitchen window
- Bedrooms: Four bedrooms (three on upper level, one on main level)
- Flooring: Hardwood floors
- Bathrooms: One full bathroom (upper level); One three-quarter bathroom (main level)
- Heating & cooling: Forced air heating; Central air conditioning
- Interior features: Eat-in kitchen; Hardwood floors; Storage space in basement; Unfinished basement
- Laundry & utility: Washer/dryer hookup; Gas water heater; Dryer included
Neighborhood map
What this means for you Summary
Snapshot
- This is a 3-bed/2.0-bath single-family listed at $285k.
Deal economics
- At list price, monthly cash flow is $-391 ($-5k/yr) — negative.
- To cash-flow at today's rent, offer at most $216k (24.2% below list).
- To meet the 1% rule (rent ≥ 1% of price), the offer needs to be $189k (33.8% below list).
- Recommended offer: $189k (33.8% below list) — sets the bar for 1% rule.
- Cap rate 4.6% vs local median 3.3% in Shakopee — top-decile yield for the area; either an underpriced asset or a hidden risk that comps aren't pricing in. Stress-test before assuming the spread holds.
Location & tenants
- Location reads 90/100 on livability (#3 in MN, #102 nationally) — a professional / high-income tenant draw. Strengths: commute A+, employment A+, housing A+.
- Shakopee Public School District (suburban): math 42% / reading 56% proficiency, ranked #95 of 301 in MN (top 32%) — families likely to look elsewhere, expect single-tenant / working-renter base with shorter leases.
- Market conditions: Rents rising fast (+4.0%/yr); 461 active listings in the ZIP; 9 comparable units currently listed for rent nearby; rentals leasing fast (median 5d on market — plan ~1-2 weeks tenant-placement turnaround); solid renter incomes; 699 units permitted in Scott County in 2024 (84 in 5+ unit buildings).
Forward outlook
- Local home prices are declining (-3.0%/yr); year-one equity from $2k of loan paydown is wiped out by about $9k of value loss. Plan a longer hold.
- Scott County population projected at +31% by 2050 — long-run rental-demand tailwind backs the buy-and-hold thesis.
Negotiation context
- Only 7 days on market — expect competitive offers; lowballing is unlikely to land.
- 4 sale attempts since 25y ago with the ask held roughly flat each time — persistent listings suggest the price (not the market) is what's stuck; bring a comps-based counter.
Risks & watch-outs
- Watch-outs: built in 1890 — expect roof / HVAC / electrical / plumbing capex.
Questions for the listing agent
- What do current leases actually rent for vs. the listed asking? Can we see a recent rent roll and the last 12 months of T-12 income?
- Built in 1890 — when were the roof, HVAC, electrical panel, plumbing, and water heater last replaced?
- Is there a deadline driving the sale (1031 exchange, divorce, estate, relocation)? That informs how much negotiation room exists.
- Schools are B-rated — typically a magnet for longer-tenancy family renters. What's the average tenant stay here, and is there a school-zone premium baked into asking?
- The area grade is low — what's the realistic commute time and amenity access for the typical tenant pool here? Any planned neighborhood developments (good or bad) we should know about?
- What's the average days-on-market for RENTAL listings here right now (not sales)? A rising rental-DOM trend means longer vacancies and softer asking-rent achievability than the comps imply.
- What's the recent tenant-quality profile in this submarket — average credit score on applications, eviction rate, late-payment / NSF rate, and stable-employment percentage? A property-management company in the area should have these aggregated.
- How much new for-sale + rental construction is in the pipeline within 1–3 miles? Heavy new supply typically softens prices + rents 12–24 months out; constrained supply supports both.
Investment metrics
- 1% rule
- 0.66% ✗
- Cap rate
- 4.65%
- Cash-on-cash
- -5.88%
- DSCR
- 0.74
- GRM
- 12.6
CMA / ARV
- ARV (median comp)
- $335,669
- List price
- $285,000
- Delta
- -15.09%
- Verdict
- UNDERPRICED
- Comps
- 4 within 2.0 mi
Projected returns pro-forma
-3.0% appreciation · 4.05% rent growth · sell at horizon
- IRR
- -25.3%
- Equity multiple
- 0.13×
- Total profit
- $-69,088
- Equity at exit
- $42,494
- IRR
- -18.8%
- Equity multiple
- -0.05×
- Total profit
- $-83,876
- Equity at exit
- $24,642
Cash invested: $79,800 (down + closing). Projections, not guarantees.
Landlord ↔ Tenant lean methodology
- Overall (STATE)
- 46 Balanced
- State Minnesota
- 46 Balanced · D+2
- County
- — inherits STATE
- City
- — inherits STATE
ZIP-level market 55379
- Rents YoY
- 4.0%
- Active inventory
- 461
- Price-to-rent
- 12.6×
Monthly cashflow live
- Estimated rent
- $1,887 high interval (Pro) →
- Mortgage (P&I)
- −$1,495
- Tax from tax record
- −$268 /mo · $3,220/yr
- Insurance
- −$119
- HOA
- −$0
- Vacancy / Maint / Mgmt
- −$396
- Net cashflow
- $-391
Break-even live
UW: 25.0% down · 7.5% · 30yr · 1.5% tax · 5.0% vac · 8.0% maint · 8.0% mgmt
Financing live
Cash to close
- Down payment
- $71,250
- Closing costs
- $8,550
- Reserves months
- —
- Total cash needed
- —
Loan-product check · same deal, 3 products live
Conventional
25% down · 7.5% · 30yr
- Down + closing
- —
- Monthly P&I
- —
- Monthly cashflow
- —
- DSCR
- —
- Eligible?
- —
Personal DTI + credit; lowest rate.
DSCR
20% down · 8.5% · 30yr
- Down + closing
- —
- Monthly P&I
- —
- Monthly cashflow
- —
- DSCR
- —
- Eligible?
- —
No personal income docs; deal must DSCR.
Hard money
10% down · 12.0% · 12mo
- Down + closing
- —
- Monthly P&I
- —
- Monthly cashflow
- —
- DSCR
- —
- Eligible?
- —
Short-term bridge; refi at stabilization.
Rent comps 9 comps
| Address | Beds | Baths | Sqft | Rent | $/sqft | DOM | Units | Dist |
|---|---|---|---|---|---|---|---|---|
| 129 Holmes St S Shakopee, MN | 2.0 | 1.0–2.0 | 765 | $2,117 | $2.77 | 2d | 11 | 0.38mi |
| 609 Market St S Unit 5 Shakopee, MN | 2.0 | 1.0 | 900 | $1,500 | $1.67 | 13d | 1 | 0.44mi |
| 609 Market St S Unit 5 Shakopee, MN | 2.0 | 1.0 | 900 | $1,500 | $1.67 | 5d | 1 | 0.44mi |
| 914 Sommerville St S Shakopee, MN | 2.0 | 1.5 | 1102 | $1,795 | $1.63 | 24d | 1 | 0.74mi |
| 700 Roundhouse St Shakopee, MN | 1.0–2.0 | 1.0 | 843 | $1,600 | $1.90 | 44d | 2 | 0.75mi |
| 1324 Eagle Creek Blvd Shakopee, MN | 1.0–3.0 | 1.0 | 1050 | $2,035 | $1.94 | 2d | 8 | 0.81mi |
| 1224 Shakopee Ave E Shakopee, MN | 1.0–2.0 | 1.0–2.0 | 884 | $1,885 | $2.13 | 5d | 4 | 0.90mi |
| 1427 Shakopee Ave E Apt 2 Shakopee, MN | 2.0 | 1.0 | 950 | $1,400 | $1.47 | 44d | 1 | 0.93mi |
| 935 Alysheba Rd Shakopee, MN | 1.0–3.0 | 1.0–2.0 | 980 | $2,473 | $2.52 | 2d | 17 | 1.49mi |
Listing history 11 events
-
2026-05-18historical Contingent - Inspection 662-char remark
-
2026-05-12$285,000 Active 662-char remark
-
2011-04-28soldstatus $50,000 256-char remark
Show marketing remark (256 chars)
THIS CHARMING STORY AND A HALF NEEDS LOTS of TLC but could be great renovation project. LARGE CORNER LOT, ROOM FOR A GARAGE, BRICK EXTERIOR, STAINED GLASS WINDOW, WOOD FLOORS & BEAUTIFUL WOODWORK INSIDE. POTENTIAL! Needs updates and repairs throughout.
-
2011-04-27historical 256-char remark
Show marketing remark (256 chars)
THIS CHARMING STORY AND A HALF NEEDS LOTS of TLC but could be great renovation project. LARGE CORNER LOT, ROOM FOR A GARAGE, BRICK EXTERIOR, STAINED GLASS WINDOW, WOOD FLOORS & BEAUTIFUL WOODWORK INSIDE. POTENTIAL! Needs updates and repairs throughout.
-
2011-02-28$55,500 256-char remark
Show marketing remark (256 chars)
THIS CHARMING STORY AND A HALF NEEDS LOTS of TLC but could be great renovation project. LARGE CORNER LOT, ROOM FOR A GARAGE, BRICK EXTERIOR, STAINED GLASS WINDOW, WOOD FLOORS & BEAUTIFUL WOODWORK INSIDE. POTENTIAL! Needs updates and repairs throughout.
-
2001-10-30soldstatus $124,000
-
2001-10-30soldstatus $124,000
-
2001-09-16historical
-
2001-09-14$119,900
-
2001-09-01historical
-
2001-06-01$144,900
ⓘ Source: listings_history table (triggers on properties + properties_extension) + one-shot
backfill from property_details.listing_events for pre-trigger history.
Tax reassessment forecast MN · Partial reset (capped growth)
- Current annual tax
- $3,220 · $268/mo
- Projected year-2 tax
- $3,220 · $268/mo
- Expected delta
- $0/yr ($0/mo · 0.0%)
ⓘ Screening estimate from a state-policy table — verify with the county assessor before closing.
Climate risk First Street
- Flood 1/10 Low FEMA zone X (unshaded) · 0% chance over 30 yrs
- Wildfire 2/10 Low
- Heat 2/10 Low 7 d/yr ≥99°F today · 14 d/yr by 30 yrs out
- Wind 2/10 Low
- Air quality 2/10 Low 2 unhealthy d/yr today · 2 by 30 yrs out
Nearby sold comps map
Loading sold comps map…
Walkable amenities ~0.75 mi
Loading nearby amenities…
Taxation est. · year 1
- Rental income
- $22,645
- − Mortgage interest
- −$15,964
- − Property taxes
- −$3,220
- − Insurance
- −$1,425
- − Repairs & maintenance
- −$1,812
- − Management
- −$1,812
- − Depreciation
- −$8,291
- Taxable loss
- −$9,879
- Est. tax savings @ 24.0%
- +$2,371
- After-tax cash flow
- $-2,320/yr
For passive investors: Depreciation is non-cash, so a rental often shows a tax loss while cash-flowing — sheltering income. Rental losses are passive: they offset passive income freely, and up to $25,000/yr can offset ordinary (W-2) income if you actively participate and your MAGI is under $100k (phasing out to $0 by $150k); unused losses carry forward. On sale, claimed depreciation is recaptured at up to 25%, and gains may owe capital-gains tax (a 1031 exchange can defer both). Figures are a year-1 estimate at your 24.0% rate — not tax advice; consult a CPA.
Schools (NCES district)
- District
- Shakopee Public School District
- NCES district ID
- 2733000
- Math proficiency
- 42% ▼ -17.00%
- Reading proficiency
- 56% ▼ -6.00%
- Median HH income
- $79,637
- Composite
- 44.73/100
- National rank
- #2751
- State rank
- #95 of 301 in MN
Livability — Shakopee
- Score
- 90/100
- State rank
- #3
- US rank
- #102
Category grades
Schools grade is shown separately in the Schools card above.
Census & demographics
- Census place
- Shakopee, MN
- County
- Scott County · 116,975 people
- City population
- 50,041
- Metro
- Minneapolis-St. Paul-Bloomington, MN-WI
- Population (ZIP)
- 50,041
- Household income
- $106,312
- Rent vs Own
- Severe rent burden
- 1009.0
Population outlook (Scott County) Hauer SSP2
- Today (2025)
- 165,899 people
- By 2030
- 177,290 · +6.9%
- By 2040
- 199,019 · +20.0%
- By 2050
- 216,883 · +30.7%
- By 2075
- 256,099 · +54.4%
- By 2100
- 276,434 · +66.6%
Race, ethnicity, and origin ACS 2023
- Neighborhood character
- Diverse neighborhood (Simpson 0.57)
- Race & ethnicity
- White 64% Hispanic / Latino 11% Asian 10% Two or more races 9% Black 7% Native American 1%
- Hispanic origin (detail)
- Mexican 7% Puerto Rican 1%
- Common ancestry
- Portuguese 9% Romanian 3% Lithuanian 2%
- Foreign-born
- 16% · Canada, Vietnam, China
- Languages at home
- 77% English-only · Spanish 8% Other Asian/Pacific 5% Russian/Polish/Slavic 3%
Political lean MEDSL · Scott
- 2024 margin
- Lean R (+8.5) · D 44.8% · R 53.3% · Other 1.9%
- 2008→2024 swing
- +2.7pp toward D · 2008: -11.2pp · 2024: -8.5pp
- All cycles
- 2024: R+8.5 2020: R+6.6 2016: R+15.4 2012: R+14.8 2008: R+11.2
Not yet ingested
- Civics
- —
Market trends
- HPI YoY
- ▼ -253.64%
- Current HPI
- 218.9993
- Rent YoY
- ▲ 4.05%
- Metro
- Minneapolis-St. Paul-Bloomington, MN-WI
- State GDP YoY
- ▲ 2.41%
- F500 in state
- 34
Industry mix (Fortune 500 HQ in MN)
| Industry | F500 HQs | Revenue |
|---|---|---|
| Healthcare | 2 | $407B |
|
||
| Retail | 2 | $150B |
|
||
| Consumer Goods | 2 | $32B |
|
||
| Industrial Machinery | 2 | $6B |
|
||
| Agriculture | 1 | $40B |
|
||
| Healthcare / Medical Devices | 1 | $32B |
|
||
Price history
+131.2% since first listed13 events — show timeline
- 2026-06-11 Sold (MLS) $335,000 NORTHSTARMLS as Distributed by MLS Grid
- 2026-05-19 Pending — NORTHSTARMLS as Distributed by MLS Grid
- 2026-05-18 Contingent — NORTHSTARMLS as Distributed by MLS Grid
- 2026-05-12 Listed $285,000 NORTHSTARMLS as Distributed by MLS Grid
- 2011-04-28 Sold (MLS) $50,000 NORTHSTARMLS as Distributed by MLS Grid
- 2011-04-27 Listing Removed — NORTHSTARMLS as Distributed by MLS Grid
- 2011-02-28 Listed $55,500 NORTHSTARMLS as Distributed by MLS Grid
- 2001-10-30 Sold (Public Records) $124,000 Public Records
- 2001-10-30 Sold (MLS) $124,000 NORTHSTARMLS as Distributed by MLS Grid
- 2001-09-16 Listing Removed — NORTHSTARMLS as Distributed by MLS Grid
- 2001-09-14 Listed $119,900 NORTHSTARMLS as Distributed by MLS Grid
- 2001-09-01 Listing Removed — NORTHSTARMLS as Distributed by MLS Grid
- 2001-06-01 Listed $144,900 NORTHSTARMLS as Distributed by MLS Grid
Property tax history
+4.5%/yrLatest (2026): $3,220 · +19.0% YoY. Source: county tax records.
Cash-flow waterfall
monthlySold comps — $/sqft
last 12 mo · ≤1 miLoading sold comps…