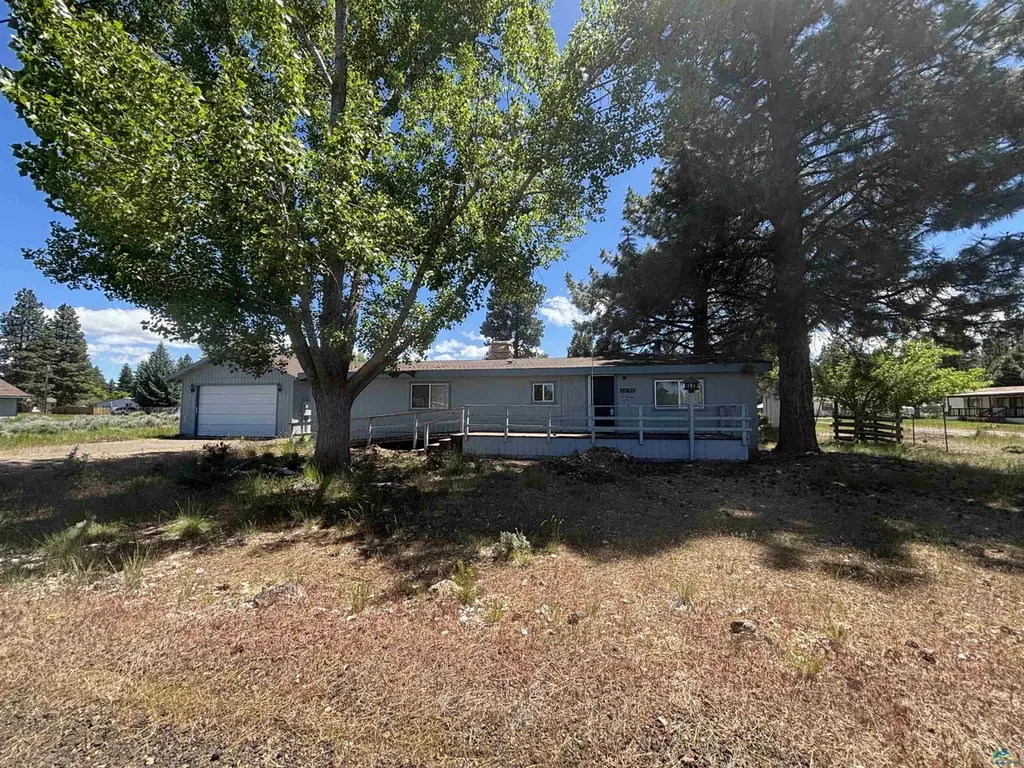
686-950 Fir Way · Spaulding, CA
Flood risk 1/10 · Minimal
- FEMA flood zone
- X (unshaded)
- Chance of flooding over 30 yrs
- 0.0%
- Est. flood insurance / yr
- $507 – $1,088
Fire risk 7/10 · Major
- Est. fire insurance / yr
- $659 – $1,223
Heat risk 3/10 · Minor
- Hot days now (above 89°F)
- 7 days/yr
- Hot days in 30 yrs
- 19 days/yr
Wind risk 1/10 · Minimal
- Chance of severe wind over 30 yrs
- —
Air-quality risk 10/10 · Severe
- Unhealthy air days now
- 21 days/yr
- Unhealthy air days in 30 yrs
- 22 days/yr
Risk factors via First Street. Map © Google.
Why this score? — see what drove the B- grade
The composite is a weighted blend of 9 inputs, each scored 0–100. Each bar is that input's sub-score; the figure is the points it added to the 100-point composite (weight × sub-score).
- Cash flow +25.7/30.0
- ARV discount +15.0/15.0
- DSCR +8.6/10.0
- 1% rule +6.8/10.0
- Schools +2.6/10.0
- Rent growth +2.5/5.0
- Livability +2.5/5.0
- Condition / age +2.5/5.0
- Appreciation +0.0/10.0
$130,000
🖨 Deal sheet 📄 Offer letter ✓ Due diligence
Listing remarks
Affordable Eagle Lake Retreat – Under $150,000! Don't miss this great opportunity to own a 1984 manufactured home in the desirable Spalding community at Eagle Lake. Priced at $130,000, this property offers comfortable lake living with plenty of space for recreation, storage, and guests. The home features 2 bedrooms and 2 bathrooms, providing a functional layout for full-time living or a vacation getaway. A large detached 2-car garage includes a full bathroom, creating endless possibilities for hobbies, workshop space, or storing all your outdoor gear. Enjoy the peaceful surroundings, fresh mountain air, and easy access to Eagle Lake's renowned fishing, boating, hiking, and year-round
Key facts
- Eagle lake
- Natural beauty
- Spalding community
Tags
Property features AI
Exterior
- Parking: 2-car garage
- Security: Smoke detector(s)
- Utilities: Shared well water; Public sewer; Septic tank
- Home design: Residential manufactured home
- Construction: Wood siding; Composition roof
- Exterior features: Deck; Corner lot; Level lot
Interior
- Kitchen: Gas oven; Gas range; Range; Microwave; Refrigerator
- Flooring: Carpet; Vinyl
- Heating & cooling: Wood stove; Central heating; Forced air; Propane heating; Wood heating
- Interior features: Insulated windows; Living room fireplace
- Laundry & utility: Laundry room; Washer; Dryer; Electric water heater
Neighborhood map
What this means for you Summary
Snapshot
- This is a 2-bed/1.0-bath manufactured listed at $130k.
Deal economics
- At list price, monthly cash flow is $313 ($4k/yr) — positive.
- The deal already cash-flows at list — no discount required.
- Meets the 1% rule at list price ($2k rent vs $130k).
Location & tenants
- Location reads 49/100 on livability (#1,173 in CA) — a working-class tenant base; expect higher turnover. Watch: schools D-, crime F, amenities F.
- Susanville Elementary (town): math 27% / reading 32% proficiency, ranked #350 of 517 in CA (top 68%) — low school quality limits family demand, transient renter base, plan for 1-2y turnover.
- Market conditions: 236 active listings in the ZIP; 6 units permitted in Lassen County in 2024 (0 in 5+ unit buildings).
Forward outlook
- Local home prices are declining (-3.0%/yr); year-one equity from $899 of loan paydown is wiped out by about $4k of value loss. Plan a longer hold.
- Lassen County population projected at -14% by 2050 — secular population decline; favor cash flow + early exit over multi-decade hold.
Negotiation context
- Only 9 days on market — expect competitive offers; lowballing is unlikely to land.
Risks & watch-outs
- Climate carrying-cost: major wildfire risk — expect insurance premiums to compound above CPI over the hold.
Questions for the listing agent
- Is there a deadline driving the sale (1031 exchange, divorce, estate, relocation)? That informs how much negotiation room exists.
- Schools are D-rated, which usually means shorter tenancies and higher turnover. Who's the typical renter profile here, and what's been the actual vacancy rate?
- Crime grade is F in this area — have there been break-ins, vandalism, or insurance claims at this property in the last 3 years? What carrier currently insures it and at what premium?
- What's the average days-on-market for RENTAL listings here right now (not sales)? A rising rental-DOM trend means longer vacancies and softer asking-rent achievability than the comps imply.
- What's the recent tenant-quality profile in this submarket — average credit score on applications, eviction rate, late-payment / NSF rate, and stable-employment percentage? A property-management company in the area should have these aggregated.
- How much new for-sale + rental construction is in the pipeline within 1–3 miles? Heavy new supply typically softens prices + rents 12–24 months out; constrained supply supports both.
Investment metrics
- 1% rule
- 1.18% ✓
- Cap rate
- 9.18%
- Cash-on-cash
- 10.33%
- DSCR
- 1.46
- GRM
- 7.1
CMA / ARV
- ARV (on-the-fly)
- $177,120
- Comps found
- 1
Show comp detail 1 sale within ~0.75 mi
| Address | Dist | Beds/Ba | Sqft | Sold | Price | $/sf | Match |
|---|---|---|---|---|---|---|---|
| 687-635 Hollywood Way | 0.53mi | 3/2.0 (+1) | 1,296 (-10%) | 1mo | $159,000 | $123 | 49 |
Match score weights: distance 35% · size 25% · config 20% · recency 20%. Top-matched comps best support the ARV.
Projected returns pro-forma
-3.0% appreciation · 3.0% rent growth · sell at horizon
- IRR
- -0.8%
- Equity multiple
- 0.97×
- Total profit
- $-1,089
- Equity at exit
- $19,383
- IRR
- 8.9%
- Equity multiple
- 1.68×
- Total profit
- $24,839
- Equity at exit
- $11,240
Cash invested: $36,400 (down + closing). Projections, not guarantees.
Landlord ↔ Tenant lean methodology
- Overall (STATE)
- 18 Strongly Tenant-Friendly
- State California
- 18 Strongly Tenant-Friendly · D+13
- County
- — inherits STATE
- City
- — inherits STATE
ZIP-level market 96130
- Active inventory
- 236
- Price-to-rent
- 7.1×
Monthly cashflow live
- Estimated rent
- $1,534 medium interval (Pro) →
- Mortgage (P&I)
- −$682
- Tax est. 1.5%
- −$162 /mo · $1,950/yr
- Insurance
- −$54
- HOA
- −$0
- Vacancy / Maint / Mgmt
- −$322
- Net cashflow
- $313
Break-even live
UW: 25.0% down · 7.5% · 30yr · 1.5% tax · 5.0% vac · 8.0% maint · 8.0% mgmt
Financing live
Cash to close
- Down payment
- $32,500
- Closing costs
- $3,900
- Reserves months
- —
- Total cash needed
- —
Loan-product check · same deal, 3 products live
Conventional
25% down · 7.5% · 30yr
- Down + closing
- —
- Monthly P&I
- —
- Monthly cashflow
- —
- DSCR
- —
- Eligible?
- —
Personal DTI + credit; lowest rate.
DSCR
20% down · 8.5% · 30yr
- Down + closing
- —
- Monthly P&I
- —
- Monthly cashflow
- —
- DSCR
- —
- Eligible?
- —
No personal income docs; deal must DSCR.
Hard money
10% down · 12.0% · 12mo
- Down + closing
- —
- Monthly P&I
- —
- Monthly cashflow
- —
- DSCR
- —
- Eligible?
- —
Short-term bridge; refi at stabilization.
Listing history 8 events
-
2026-06-19days on market $130,000 Active 9 DOM
-
2026-06-18days on market $130,000 Active 8 DOM
-
2026-06-17days on market $130,000 Active 7 DOM
-
2026-06-16days on market $130,000 Active 6 DOM
-
2026-06-15days on market $130,000 Active 5 DOM
-
2026-06-14days on market $130,000 Active 3 DOM
-
2026-06-12remarks 693-char remark
-
2026-06-12$130,000 Active 2 DOM
ⓘ Source: listings_history table (triggers on properties + properties_extension) + one-shot
backfill from property_details.listing_events for pre-trigger history.
Climate risk First Street
- Flood 1/10 Low FEMA zone X (unshaded) · 0% chance over 30 yrs
- Wildfire 7/10 Severe
- Heat 3/10 Moderate 7 d/yr ≥89°F today · 19 d/yr by 30 yrs out
- Wind 1/10 Low
- Air quality 10/10 Extreme 21 unhealthy d/yr today · 22 by 30 yrs out
Nearby sold comps map
Loading sold comps map…
Walkable amenities ~0.75 mi
Loading nearby amenities…
Taxation est. · year 1
- Rental income
- $18,405
- − Mortgage interest
- −$7,282
- − Property taxes
- −$1,950
- − Insurance
- −$650
- − Repairs & maintenance
- −$1,472
- − Management
- −$1,472
- − Depreciation
- −$3,782
- Taxable income
- $1,797
- Est. tax owed @ 24.0%
- −$431
- After-tax cash flow
- $3,328/yr
For passive investors: Depreciation is non-cash, so a rental often shows a tax loss while cash-flowing — sheltering income. Rental losses are passive: they offset passive income freely, and up to $25,000/yr can offset ordinary (W-2) income if you actively participate and your MAGI is under $100k (phasing out to $0 by $150k); unused losses carry forward. On sale, claimed depreciation is recaptured at up to 25%, and gains may owe capital-gains tax (a 1031 exchange can defer both). Figures are a year-1 estimate at your 24.0% rate — not tax advice; consult a CPA.
Schools (NCES district)
- District
- Susanville Elementary
- NCES district ID
- 0638550
- Math proficiency
- 27% ▼ -6.00%
- Reading proficiency
- 32% ▬ 0.00%
- Median HH income
- $49,068
- Composite
- 25.69/100
- National rank
- #7387
- State rank
- #350 of 517 in CA
Livability — Spaulding
- Score
- 49/100
- State rank
- #1173
- US rank
- #25924
Category grades
Schools grade is shown separately in the Schools card above.
Census & demographics
- Census place
- Spaulding, CA
- Population (ZIP)
- 20,892
Population outlook (Lassen County) Hauer SSP2
- Today (2025)
- 27,112 people
- By 2030
- 26,732 · -1.4%
- By 2040
- 25,536 · -5.8%
- By 2050
- 23,262 · -14.2%
- By 2075
- 18,620 · -31.3%
- By 2100
- 14,679 · -45.9%
Race, ethnicity, and origin ACS 2023
- Neighborhood character
- Diverse neighborhood (Simpson 0.60)
- Race & ethnicity
- White 57% Hispanic / Latino 26% Two or more races 17% Black 9% Native American 2% Pacific Islander 1% Asian 1%
- Hispanic origin (detail)
- Mexican 23%
- Common ancestry
- Iranian 2% Lithuanian 2% Slovak 2%
- Foreign-born
- 5% · Canada
- Languages at home
- 80% English-only · Spanish 16% Other Asian/Pacific 1% Other Indo-European 1%
Political lean MEDSL · Lassen
- 2024 margin
- Solid R (+54.0) · D 21.8% · R 75.8% · Other 2.4%
- 2008→2024 swing
- -19.8pp toward R · 2008: -34.2pp · 2024: -54.0pp
- All cycles
- 2024: R+54.0 2020: R+51.5 2016: R+51.3 2012: R+39.8 2008: R+34.2
Not yet ingested
- Civics
- —
Market trends
- HPI YoY
- ▼ -126.12%
- Current HPI
- 136.1585
- Rent YoY
- —
- Metro
- —
- State GDP YoY
- ▲ 3.21%
- F500 in state
- 116
Industry mix (Fortune 500 HQ in CA)
| Industry | F500 HQs | Revenue |
|---|---|---|
| Technology | 27 | $1,492B |
|
||
| Financial Services | 3 | $174B |
|
||
| Retail | 3 | $44B |
|
||
| Insurance | 3 | $26B |
|
||
| Media / Entertainment | 2 | $115B |
|
||
| Pharmaceuticals / Biotech | 2 | $62B |
|
||
Price history
1 event — show timeline
- 2026-06-10 Listed $130,000 LAORMLS
Property tax history
+0.2%/yrLatest (2020): $179 · +1.1% YoY. Source: county tax records.
Cash-flow waterfall
monthlySold comps — $/sqft
last 12 mo · ≤1 miLoading sold comps…