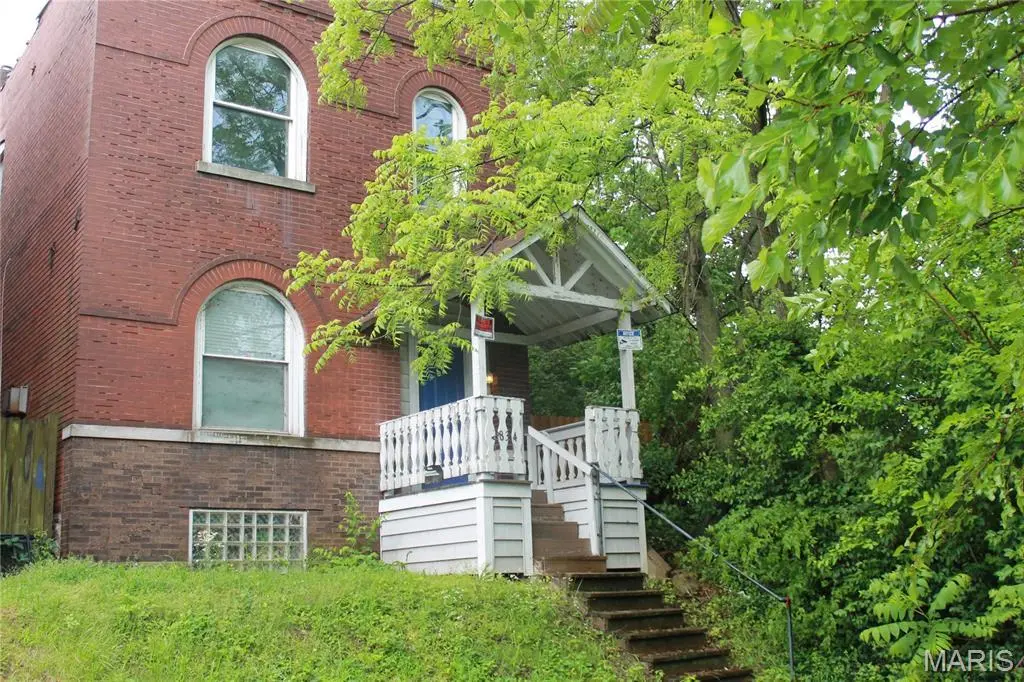
2834 Mount Pleasant St · St. Louis, MO
Flood risk 1/10 · Minimal
- FEMA flood zone
- X (unshaded)
- Chance of flooding over 30 yrs
- 0.0%
- Est. flood insurance / yr
- $473 – $860
Fire risk 1/10 · Minimal
- Est. fire insurance / yr
- $1,054 – $1,958
Heat risk 5/10 · Moderate
- Hot days now (above 108°F)
- 7 days/yr
- Hot days in 30 yrs
- 20 days/yr
Wind risk 2/10 · Minimal
- Chance of severe wind over 30 yrs
- 1.0%
Air-quality risk 3/10 · Minor
- Unhealthy air days now
- 3 days/yr
- Unhealthy air days in 30 yrs
- 4 days/yr
Risk factors via First Street. Map © Google.
Why this score? — see what drove the B- grade
The composite is a weighted blend of 9 inputs, each scored 0–100. Each bar is that input's sub-score; the figure is the points it added to the 100-point composite (weight × sub-score).
- Cash flow +25.7/30.0
- ARV discount +15.0/15.0
- DSCR +8.6/10.0
- 1% rule +6.5/10.0
- Rent growth +3.3/5.0
- Livability +2.5/5.0
- Condition / age +2.5/5.0
- Schools +1.2/10.0
- Appreciation +0.0/10.0
$120,000
🖨 Deal sheet 📄 Offer letter ✓ Due diligence
Listing remarks MLS
3 bedroom, 2 full bath home in The Mount Pleasant Neighborhood. This is a big house (1920 sq ft) with great potential. Very open Floor plan with a large living room, dining room, kitchen and bathroom on the main floor. The living room has a lovely fireplace with mantel. There are high ceilings and and a great "flow". Upstairs are 3 good sized bedrooms (one with a balcony) and another full bathroom. Needs some work but definitely worth the effort. Home being sold as-is
Key facts
- 3,123 sq ft lot
- Built 1906
- Listed 27 days
Property features AI
Finance
- Other: No pool
- Financial info: Lease not considered; No second mortgage indicated
Exterior
- Utilities: Public water; Public sewer; Electric service by Ameren; Electricity connected
- Home design: Single-family residence; Two levels; Residential property
- Construction: Brick construction; Built above grade finished area of 1,920 (assessor)
- Exterior features: Level lot
Interior
- Bedrooms: Three bedrooms (all on the upper level)
- Bathrooms: Two full bathrooms (one on main level, one on upper level)
- Heating & cooling: Forced air heating; Central air conditioning; Ceiling fans
- Interior features: Unfinished basement; Five total rooms
Neighborhood map
What this means for you Summary
Snapshot
- This is a 3-bed/2.0-bath single-family listed at $120k.
Deal economics
- At list price, monthly cash flow is $288 ($3k/yr) — positive.
- The deal already cash-flows at list — no discount required.
- Meets the 1% rule at list price ($1k rent vs $120k).
- Recommended offer: $118k (1.5% below list) — sets the bar for market timing.
- Cap rate 9.2% vs local median 5.0% in St. Louis — top-decile yield for the area; either an underpriced asset or a hidden risk that comps aren't pricing in. Stress-test before assuming the spread holds.
Location & tenants
- Location reads: area grade B — affects rentability + tenant quality, not the cash-flow math above.
- St. Louis City (urban): math 10% / reading 18% proficiency, ranked #312 of 324 in MO (top 96%) — low school quality limits family demand, transient renter base, plan for 1-2y turnover; 80% free/reduced lunch — lower-income household profile, screen leases tightly.
- Zoned schools: Monroe Elem. (math 2% / reading 2%, grade F, #1,099 of 1,115 statewide, top 100%, 158 students, 98% FRL); Roosevelt High (math 2% / reading 8%, grade F, #517 of 521 statewide, top 100%, 460 students, 99% FRL) — zoned schools average 99% FRL vs 80% district-wide (18 pts higher); higher-poverty schools than district average — tighter screening recommended.
- Market conditions: Rents rising (+3.3%/yr); 125 active listings in the ZIP; 19 comparable units currently listed for rent nearby; rentals at typical pace (median 17d on market — plan ~3-4 weeks tenant-placement turnaround); 294 units permitted in St. Louis city in 2024 (227 in 5+ unit buildings).
- This rent runs 35% of the median local income ($47k/yr) — at the standard rent-burdened threshold; future hikes will face affordability resistance.
Forward outlook
- Local home prices are declining (-3.0%/yr); year-one equity from $830 of loan paydown is wiped out by about $4k of value loss. Plan a longer hold.
- St. Louis County population projected to shrink 6% by 2050 — rents likely to lag national; underwrite the cash flow, not the appreciation.
Negotiation context
- It's been on market 27 days — a 2% lower offer ($118k) is reasonable based on typical stale-listing flexibility.
- 3 sale attempts since 13y ago with the ask held roughly flat each time — persistent listings suggest the price (not the market) is what's stuck; bring a comps-based counter.
- Current owner paid $45k; list at $120k implies a 167% gain — meaningful room to come down on a strong offer.
Risks & watch-outs
- Watch-outs: built in 1906 — expect roof / HVAC / electrical / plumbing capex.
- Climate carrying-cost: extreme-heat days projected 7→20/yr by 2055 (HVAC capex compounding) — expect insurance premiums to compound above CPI over the hold.
Questions for the listing agent
- Built in 1906 — when were the roof, HVAC, electrical panel, plumbing, and water heater last replaced?
- Is there a deadline driving the sale (1031 exchange, divorce, estate, relocation)? That informs how much negotiation room exists.
- What's the average days-on-market for RENTAL listings here right now (not sales)? A rising rental-DOM trend means longer vacancies and softer asking-rent achievability than the comps imply.
- What's the recent tenant-quality profile in this submarket — average credit score on applications, eviction rate, late-payment / NSF rate, and stable-employment percentage? A property-management company in the area should have these aggregated.
- How much new for-sale + rental construction is in the pipeline within 1–3 miles? Heavy new supply typically softens prices + rents 12–24 months out; constrained supply supports both.
Investment metrics
- 1% rule
- 1.15% ✓
- Cap rate
- 9.18%
- Cash-on-cash
- 10.30%
- DSCR
- 1.46
- GRM
- 7.2
CMA / ARV
- ARV (median comp)
- $173,209
- List price
- $120,000
- Delta
- -30.72%
- Verdict
- UNDERPRICED
- Comps
- 20 within 1.0 mi
Show comp detail 12 sales within ~0.75 mi
| Address | Dist | Beds/Ba | Sqft | Sold | Price | $/sf | Match |
|---|---|---|---|---|---|---|---|
| 4631 Oregon Ave | 0.05mi | 4/2.0 (+1) | 1,874 (-2%) | 8mo | $164,900 | $88 | 82 |
| 4540 Nebraska Ave | 0.06mi | 2/2.0 (-1) | 1,712 (-11%) | 2mo | $129,900 | $76 | 73 |
| 4639 Virginia Ave | 0.43mi | 3/2.5 | 1,980 (+3%) | 9mo | $215,000 | $109 | 65 |
| 3100 Osceola St | 0.31mi | 3/2.5 | 2,070 (+8%) | 8mo | $187,900 | $91 | 64 |
| 4312 Oregon Ave | 0.36mi | 4/2.0 (+1) | 2,032 (+6%) | 8mo | $122,000 | $60 | 62 |
| 4705 Virginia Ave | 0.44mi | 4/3.0 (+1) | 2,044 (+6%) | 5mo | $230,000 | $113 | 56 |
| 4111 California Ave | 0.61mi | 3/2.0 | 2,056 (+7%) | 7mo | $174,900 | $85 | 54 |
| 5405 Michigan Ave | 0.66mi | 2/1.5 (-1) | 2,031 (+6%) | 1mo | $149,000 | $73 | 52 |
| 4675 Tennessee Ave | 0.67mi | 4/2.5 (+1) | 2,048 (+7%) | 5mo | $299,000 | $146 | 46 |
| 4246 Nebraska Ave | 0.42mi | 2/1.5 (-1) | 1,642 (-14%) | 8mo | $49,900 | $30 | 42 |
| 4608 S Grand Blvd | 0.68mi | 3/2.5 | 2,201 (+15%) | 4mo | $279,000 | $127 | 39 |
| 5024 Louisiana St | 0.70mi | 2/1.0 (-1) | 1,653 (-14%) | 9mo | $139,900 | $85 | 28 |
Match score weights: distance 35% · size 25% · config 20% · recency 20%. Top-matched comps best support the ARV.
Projected returns pro-forma
-3.0% appreciation · 3.27% rent growth · sell at horizon
- IRR
- -0.5%
- Equity multiple
- 0.98×
- Total profit
- $-690
- Equity at exit
- $17,892
- IRR
- 9.4%
- Equity multiple
- 1.73×
- Total profit
- $24,634
- Equity at exit
- $10,375
Cash invested: $33,600 (down + closing). Projections, not guarantees.
Landlord ↔ Tenant lean methodology
- Overall (STATE)
- 81 Strongly Landlord-Friendly
- State Missouri
- 81 Strongly Landlord-Friendly · R+10
- County
- — inherits STATE
- City
- — inherits STATE
ZIP-level market 63111
- Rents YoY
- 3.3%
- Active inventory
- 125
- Price-to-rent
- 7.2×
Monthly cashflow live
- Estimated rent
- $1,383 high interval (Pro) →
- Mortgage (P&I)
- −$629
- Tax from tax record
- −$125 /mo · $1,501/yr
- Insurance
- −$50
- HOA
- −$0
- Vacancy / Maint / Mgmt
- −$291
- Net cashflow
- $288
Break-even live
UW: 25.0% down · 7.5% · 30yr · 1.5% tax · 5.0% vac · 8.0% maint · 8.0% mgmt
Financing live
Cash to close
- Down payment
- $30,000
- Closing costs
- $3,600
- Reserves months
- —
- Total cash needed
- —
Loan-product check · same deal, 3 products live
Conventional
25% down · 7.5% · 30yr
- Down + closing
- —
- Monthly P&I
- —
- Monthly cashflow
- —
- DSCR
- —
- Eligible?
- —
Personal DTI + credit; lowest rate.
DSCR
20% down · 8.5% · 30yr
- Down + closing
- —
- Monthly P&I
- —
- Monthly cashflow
- —
- DSCR
- —
- Eligible?
- —
No personal income docs; deal must DSCR.
Hard money
10% down · 12.0% · 12mo
- Down + closing
- —
- Monthly P&I
- —
- Monthly cashflow
- —
- DSCR
- —
- Eligible?
- —
Short-term bridge; refi at stabilization.
Rent comps 19 comps
| Address | Beds | Baths | Sqft | Rent | $/sqft | DOM | Units | Dist |
|---|---|---|---|---|---|---|---|---|
| 4450 Pennsylvania Ave Saint Louis, MO | 3.0 | 1.0 | 1500 | $1,100 | $0.73 | 4d | 1 | 0.21mi |
| 4312 Oregon Ave Saint Louis, MO | 4.0 | 2.0 | 2032 | $2,000 | $0.98 | 1d | 1 | 0.39mi |
| 4657 Idaho Ave Unit 4659 St. Louis, MO | 2.0 | 2.0 | 1668 | $1,295 | $0.78 | 23d | 1 | 0.48mi |
| 4250 Michigan Ave Saint Louis, MO | 2.0 | 1.0 | 2184 | $1,200 | $0.55 | 43d | 1 | 0.49mi |
| 4130 Minnesota Ave Saint Louis, MO | 2.0 | 1.0 | 1234 | $975 | $0.79 | 14d | 1 | 0.63mi |
| 4145 S Compton Ave Saint Louis, MO | 3.0 | 2.0 | 1656 | $1,520 | $0.92 | 43d | 1 | 0.65mi |
| 4135 S Compton Ave Saint Louis, MO | 3.0 | 2.0 | 2104 | $1,600 | $0.76 | 43d | 1 | 0.67mi |
| 4217 S Grand Blvd Unit 1 St. Louis, MO | 3.0 | 1.0 | 1250 | $1,400 | $1.12 | 4d | 1 | 0.75mi |
| 3635 Marceline Ter Unit 2ND St. Louis, MO | 3.0 | 1.0 | 1250 | $1,275 | $1.02 | 43d | 1 | 0.80mi |
| 3637 Meramec St Saint Louis, MO | 3.0 | 1.5 | 1632 | $1,925 | $1.18 | 17d | 1 | 0.84mi |
| 3914 Michigan Ave Saint Louis, MO | 2.0 | 1.0 | 1376 | $1,150 | $0.84 | 43d | 1 | 0.91mi |
| 3146 Keokuk St Saint Louis, MO | 3.0 | 1.0 | 1528 | $1,500 | $0.98 | 23d | 1 | 0.94mi |
| 3131 Keokuk St #3131 Saint Louis, MO | 3.0 | 2.0 | 1500 | $1,475 | $0.98 | 14d | 1 | 0.96mi |
| 4222 S 38th St Unit 4222 St. Louis, MO | 3.0 | 2.0 | 1836 | $1,400 | $0.76 | 20d | 1 | 0.96mi |
| 4005 S Grand Blvd Saint Louis, MO | 4.0 | 1.0 | 1323 | $1,150 | $0.87 | 16d | 1 | 1.00mi |
| 3540 Michigan Ave Saint Louis, MO | 4.0 | 2.0 | 1758 | $1,800 | $1.02 | 1d | 1 | 1.35mi |
| 3510 California Ave Saint Louis, MO | 3.0 | 2.0 | 1800 | $1,200 | $0.67 | 43d | 1 | 1.39mi |
| 4000 Schiller Pl Saint Louis, MO | 2.0 | 2.5 | 1448 | $1,618 | $1.12 | 7d | 1 | 1.43mi |
| 3429 Ohio Ave Saint Louis, MO | 3.0 | 3.0 | 1938 | $2,250 | $1.16 | 16d | 1 | 1.49mi |
Listing history 20 events
-
2026-06-02status $120,000 Pending 27 DOM
-
2026-06-01days on market $120,000 Active Under Contract 27 DOM
-
2026-05-31days on market $120,000 Active Under Contract 26 DOM
-
2026-05-11historical Active Under Contract 134-char remark
-
2026-05-05$120,000 Active 134-char remark
-
2023-03-08soldstatus $45,000
-
2023-03-01soldstatus Closed 488-char remark
Show marketing remark (488 chars)
3 bedroom, 2 full bath home in The Mount Pleasant Neighborhood. This is a big house (1920 sq ft) with great potential. Very open Floor plan with a large living room, dining room, kitchen and bathroom on the main floor. The living room has a lovely fireplace with mantel. There are high ceilings and and a great "flow". Upstairs are 3 good sized bedrooms (one with a balcony) and another full bathroom. Needs some work but definitely worth the effort. Home being sold as-is
-
2023-02-17status Pending 488-char remark
Show marketing remark (488 chars)
3 bedroom, 2 full bath home in The Mount Pleasant Neighborhood. This is a big house (1920 sq ft) with great potential. Very open Floor plan with a large living room, dining room, kitchen and bathroom on the main floor. The living room has a lovely fireplace with mantel. There are high ceilings and and a great "flow". Upstairs are 3 good sized bedrooms (one with a balcony) and another full bathroom. Needs some work but definitely worth the effort. Home being sold as-is
-
2023-02-16$35,000 Active 488-char remark
Show marketing remark (488 chars)
3 bedroom, 2 full bath home in The Mount Pleasant Neighborhood. This is a big house (1920 sq ft) with great potential. Very open Floor plan with a large living room, dining room, kitchen and bathroom on the main floor. The living room has a lovely fireplace with mantel. There are high ceilings and and a great "flow". Upstairs are 3 good sized bedrooms (one with a balcony) and another full bathroom. Needs some work but definitely worth the effort. Home being sold as-is
-
2021-07-09price $98,500
-
2021-06-08price $106,000
-
2014-09-30soldstatus
-
2014-08-05soldstatus $36,000
-
2014-06-23soldstatus
-
2013-10-04$39,900
-
2004-07-23soldstatus $117,500
-
2003-01-14soldstatus
-
1995-05-11soldstatus
-
1992-12-01soldstatus $22,000
-
1992-07-07soldstatus $45,500
ⓘ Source: listings_history table (triggers on properties + properties_extension) + one-shot
backfill from property_details.listing_events for pre-trigger history.
Tax reassessment forecast MO · Resets to sale price
- Current annual tax
- $1,501 · $125/mo
- Projected year-2 tax
- $1,501 · $125/mo
- Expected delta
- $0/yr ($0/mo · 0.0%)
ⓘ Screening estimate from a state-policy table — verify with the county assessor before closing.
Climate risk First Street
- Flood 1/10 Low FEMA zone X (unshaded) · 0% chance over 30 yrs
- Wildfire 1/10 Low
- Heat 5/10 Major 7 d/yr ≥108°F today · 20 d/yr by 30 yrs out
- Wind 2/10 Low 100% chance of damaging wind over 30 yrs
- Air quality 3/10 Moderate 3 unhealthy d/yr today · 4 by 30 yrs out
Nearby sold comps map
Loading sold comps map…
Walkable amenities ~0.75 mi
Loading nearby amenities…
Taxation est. · year 1
- Rental income
- $16,600
- − Mortgage interest
- −$6,722
- − Property taxes
- −$1,501
- − Insurance
- −$600
- − Repairs & maintenance
- −$1,328
- − Management
- −$1,328
- − Depreciation
- −$3,491
- Taxable income
- $1,630
- Est. tax owed @ 24.0%
- −$391
- After-tax cash flow
- $3,070/yr
For passive investors: Depreciation is non-cash, so a rental often shows a tax loss while cash-flowing — sheltering income. Rental losses are passive: they offset passive income freely, and up to $25,000/yr can offset ordinary (W-2) income if you actively participate and your MAGI is under $100k (phasing out to $0 by $150k); unused losses carry forward. On sale, claimed depreciation is recaptured at up to 25%, and gains may owe capital-gains tax (a 1031 exchange can defer both). Figures are a year-1 estimate at your 24.0% rate — not tax advice; consult a CPA.
Schools (NCES district)
- District
- St. Louis City
- NCES district ID
- 2929280
- Math proficiency
- 10% ▼ -6.00%
- Reading proficiency
- 18% ▼ -3.00%
- Median HH income
- $35,685
- Composite
- 11.54/100
- National rank
- #9699
- State rank
- #312 of 324 in MO
Livability — St. Louis
No livability data for this city. (Only ~50 U.S. cities are tracked.)
Census & demographics
- Census place
- St. Louis, MO
- County
- Saint Louis City · 254,015 people
- City population
- 283,259
- Metro
- St. Louis, MO-IL
- Population (ZIP)
- 18,851
- Household income
- $47,039
- Rent vs Own
- Severe rent burden
- 1364.0
Population outlook (St. Louis County) Hauer SSP2
- Today (2025)
- 315,737 people
- By 2030
- 313,865 · -0.6%
- By 2040
- 305,439 · -3.3%
- By 2050
- 296,529 · -6.1%
- By 2075
- 271,028 · -14.2%
- By 2100
- 255,359 · -19.1%
Race, ethnicity, and origin ACS 2023
- Neighborhood character
- Diverse neighborhood (Simpson 0.65)
- Race & ethnicity
- Black 42% White 41% Two or more races 11% Hispanic / Latino 9% Asian 1%
- Hispanic origin (detail)
- Mexican 6%
- Common ancestry
- Lithuanian 3% Slovak 1% Romanian 1%
- Foreign-born
- 7% · Canada, India
- Languages at home
- 90% English-only · Spanish 7% Other Indo-European 1%
Political lean MEDSL · St. Louis
- 2024 margin
- Solid D (+64.7) · D 81.4% · R 16.7% · Other 2.0%
- 2008→2024 swing
- -3.5pp toward R · 2008: 68.2pp · 2024: 64.7pp
- All cycles
- 2024: D+64.7 2020: D+66.2 2016: D+63.7 2012: D+66.6 2008: D+68.2
Not yet ingested
- Civics
- —
Market trends
- HPI YoY
- ▼ -92.80%
- Current HPI
- 169.4644
- Rent YoY
- ▲ 3.27%
- Metro
- St. Louis, MO-IL
- State GDP YoY
- ▲ 1.84%
- F500 in state
- 20
Industry mix (Fortune 500 HQ in MO)
| Industry | F500 HQs | Revenue |
|---|---|---|
| Healthcare | 1 | $163B |
|
||
| Insurance | 1 | $21B |
|
||
| Industrial Technology | 1 | $17B |
|
||
| Retail | 1 | $16B |
|
||
| Industrial Distribution | 1 | $10B |
|
||
| Utilities | 1 | $9B |
|
||
Price history
+163.7% since first listed19 events — show timeline
- 2026-06-05 Sold (MLS) — MARIS as Distributed by MLS Grid
- 2026-06-01 Pending — MARIS as Distributed by MLS Grid
- 2026-05-11 Contingent — MARIS as Distributed by MLS Grid
- 2026-05-05 Listed $120,000 MARIS as Distributed by MLS Grid
- 2023-03-08 Sold (Public Records) $45,000 Public Records
- 2023-03-01 Sold (MLS) — MARIS as Distributed by MLS Grid
- 2023-02-17 Pending — MARIS as Distributed by MLS Grid
- 2023-02-16 Listed $35,000 MARIS as Distributed by MLS Grid
- 2021-07-09 Price Changed $98,500 MARIS as Distributed by MLS Grid
- 2021-06-08 Price Changed $106,000 MARIS as Distributed by MLS Grid
- 2014-09-30 Sold (Public Records) — Public Records
- 2014-08-05 Sold (Public Records) $36,000 Public Records
- 2014-06-23 Sold (MLS) — MARIS as Distributed by MLS Grid
- 2013-10-04 Listed $39,900 MARIS as Distributed by MLS Grid
- 2004-07-23 Sold (Public Records) $117,500 Public Records
- 2003-01-14 Sold (Public Records) — Public Records
- 1995-05-11 Sold (Public Records) — Public Records
- 1992-12-01 Sold (Public Records) $22,000 Public Records
- 1992-07-07 Sold (Public Records) $45,500 Public Records
Property tax history
+14.5%/yrLatest (2024): $1,501 · +5.1% YoY. Source: county tax records.
Cash-flow waterfall
monthlySold comps — $/sqft
last 12 mo · ≤1 miLoading sold comps…