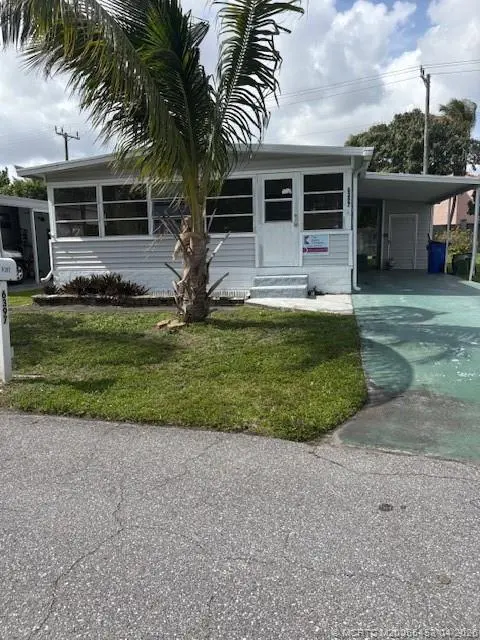
6397 Brandywine Dr · Margate, FL
Flood risk 1/10 · Minimal
- FEMA flood zone
- X (unshaded)
- Chance of flooding over 30 yrs
- 0.0%
- Est. flood insurance / yr
- $507 – $1,088
Fire risk 1/10 · Minimal
- Est. fire insurance / yr
- $947 – $1,759
Heat risk 9/10 · Severe
- Hot days now (above 106°F)
- 7 days/yr
- Hot days in 30 yrs
- 26 days/yr
Wind risk 10/10 · Severe
- Chance of severe wind over 30 yrs
- 99.0%
Air-quality risk 3/10 · Minor
- Unhealthy air days now
- 2 days/yr
- Unhealthy air days in 30 yrs
- 3 days/yr
Risk factors via First Street. Map © Google.
Why this score? — see what drove the D+ grade
The composite is a weighted blend of 9 inputs, each scored 0–100. Each bar is that input's sub-score; the figure is the points it added to the 100-point composite (weight × sub-score).
- Cash flow +15.0/30.0
- ARV discount +7.5/15.0
- 1% rule +5.0/10.0
- DSCR +5.0/10.0
- Schools +4.1/10.0
- Livability +4.0/5.0
- Rent growth +3.0/5.0
- Condition / age +2.5/5.0
- Appreciation +0.0/10.0
$24,900
🖨 Deal sheet 📄 Offer letter ✓ Due diligence
Listing remarks
Gated community, Nice updated 3 bedroom, 2 bath home with carport, Great buy!
Key facts
- Parking
- Community pool
- Built 1973
Property features AI
Finance
- Financial info: Monthly land lease: $1,233; Pets allowed (with limit)
- HOA & community: Homeowners association; Association covers management, common areas, grounds maintenance, pools, sewer and trash
Exterior
- Parking: 1 total parking space; 1 covered parking space
- Utilities: Electricity available
- Home design: Single-story home; Resale property; Aluminum siding
- Construction: Aluminum siding construction
- Exterior features: Community pool; Gated community; Clubhouse
Interior
- Bathrooms: 2 full bathrooms
- Heating & cooling: Central heating; Central air conditioning
- Interior features: Unfurnished
Neighborhood map
What this means for you Summary
Snapshot
- This is a 3-bed/2.0-bath manufactured listed at $25k.
Deal economics
- At list price, monthly cash flow is $2k ($24k/yr) — positive.
- The deal already cash-flows at list — no discount required.
- Meets the 1% rule at list price ($3k rent vs $25k).
- Recommended offer: $24k (3.0% below list) — sets the bar for market timing.
- Cap rate 102.8% vs local median 4.3% in Margate — top-decile yield for the area; either an underpriced asset or a hidden risk that comps aren't pricing in. Stress-test before assuming the spread holds.
Location & tenants
- Location reads 81/100 on livability (#85 in FL, #1,398 nationally) — a professional / high-income tenant draw. Strengths: commute A+, housing A+, health & safety A+; Watch: amenities F.
- Broward (suburban): math 42% / reading 53% proficiency, ranked #46 of 73 in FL (top 63%) — families likely to look elsewhere, expect single-tenant / working-renter base with shorter leases.
- Market conditions: Rents rising (+1.9%/yr); 548 active listings in the ZIP; 40 comparable units currently listed for rent nearby; rentals leasing fast (median 11d on market — plan ~1-2 weeks tenant-placement turnaround); 2,111 units permitted in Broward County in 2024 (1,265 in 5+ unit buildings).
- At $2,752/mo this rent would consume 52% of the median local household income ($63k/yr) (locally 2290% of renters already pay >50% of income on rent) — very limited rent-growth headroom before tenants either downsize or default.
Forward outlook
- Local home prices are declining (-3.0%/yr); year-one equity from $172 of loan paydown is wiped out by about $747 of value loss. Plan a longer hold.
- Broward County population projected at +34% by 2050 — long-run rental-demand tailwind backs the buy-and-hold thesis.
- At projected returns (-3.0% appreciation + 1.9% rent growth), your $7k cash investment doubles in ~1 year — after that, you're playing with house money.
Negotiation context
- It's been on market 41 days — a 3% lower offer ($24k) is reasonable based on typical stale-listing flexibility.
- 2 sale attempts; this cycle's ask has dropped $5k (17%) from the opening price — seller is motivated, your offer sets the floor, not the list.
Risks & watch-outs
- Climate carrying-cost: severe wind risk, 99% chance of damaging wind over 30y; extreme-heat days projected 7→26/yr by 2055 (HVAC capex compounding) — expect insurance premiums to compound above CPI over the hold.
Questions for the listing agent
- It's been on market 41 days. Have you received any prior offers? Is the seller open to a 3% concession, seller financing, or rate buy-down credit?
- Built in 1973 — when were the roof, HVAC, electrical panel, plumbing, and water heater last replaced?
- Is there a deadline driving the sale (1031 exchange, divorce, estate, relocation)? That informs how much negotiation room exists.
- The area grade is low — what's the realistic commute time and amenity access for the typical tenant pool here? Any planned neighborhood developments (good or bad) we should know about?
- What's the average days-on-market for RENTAL listings here right now (not sales)? A rising rental-DOM trend means longer vacancies and softer asking-rent achievability than the comps imply.
- What's the recent tenant-quality profile in this submarket — average credit score on applications, eviction rate, late-payment / NSF rate, and stable-employment percentage? A property-management company in the area should have these aggregated.
- How much new for-sale + rental construction is in the pipeline within 1–3 miles? Heavy new supply typically softens prices + rents 12–24 months out; constrained supply supports both.
Investment metrics
- 1% rule
- 11.05% ✓
- Cap rate
- 102.78%
- Cash-on-cash
- 344.60%
- DSCR
- 16.33
- GRM
- 0.8
CMA / ARV
No comps found within radius.
Projected returns pro-forma
-3.0% appreciation · 1.94% rent growth · sell at horizon
- IRR
- —
- Equity multiple
- 18.30×
- Total profit
- $120,618
- Equity at exit
- $3,713
- IRR
- —
- Equity multiple
- 37.97×
- Total profit
- $257,732
- Equity at exit
- $2,153
Cash invested: $6,972 (down + closing). Projections, not guarantees.
Landlord ↔ Tenant lean methodology
- Overall (STATE)
- 87 Strongly Landlord-Friendly
- State Florida
- 87 Strongly Landlord-Friendly · R+3
- County
- — inherits STATE
- City
- — inherits STATE
ZIP-level market 33063
- Home prices YoY
- -18.1%
- Rents YoY
- 1.9%
- Active inventory
- 548
- Price-to-rent
- 0.8×
Monthly cashflow live
- Estimated rent
- $2,752 high interval (Pro) →
- Mortgage (P&I)
- −$131
- Tax est. 1.5%
- −$31 /mo · $374/yr
- Insurance
- −$10
- HOA
- −$0
- Vacancy / Maint / Mgmt
- −$578
- Net cashflow
- $2,002
Break-even live
UW: 25.0% down · 7.5% · 30yr · 1.5% tax · 5.0% vac · 8.0% maint · 8.0% mgmt
Financing live
Cash to close
- Down payment
- $6,225
- Closing costs
- $747
- Reserves months
- —
- Total cash needed
- —
Loan-product check · same deal, 3 products live
Conventional
25% down · 7.5% · 30yr
- Down + closing
- —
- Monthly P&I
- —
- Monthly cashflow
- —
- DSCR
- —
- Eligible?
- —
Personal DTI + credit; lowest rate.
DSCR
20% down · 8.5% · 30yr
- Down + closing
- —
- Monthly P&I
- —
- Monthly cashflow
- —
- DSCR
- —
- Eligible?
- —
No personal income docs; deal must DSCR.
Hard money
10% down · 12.0% · 12mo
- Down + closing
- —
- Monthly P&I
- —
- Monthly cashflow
- —
- DSCR
- —
- Eligible?
- —
Short-term bridge; refi at stabilization.
Rent comps 40 comps
| Address | Beds | Baths | Sqft | Rent | $/sqft | DOM | Units | Dist |
|---|---|---|---|---|---|---|---|---|
| 3085 Lighthouse Pl Margate, FL | 3.0 | 2.0 | 1405 | $3,111 | $2.21 | 7d | 1 | 0.29mi |
| 6073 NW 27th St Unit 6073 Margate, FL | 3.0 | 2.0 | 914 | $2,700 | $2.95 | 14d | 1 | 0.30mi |
| 6503 Winfield Blvd Unit 111D Margate, FL | 2.0 | 2.0 | 1000 | $1,800 | $1.80 | 24d | 1 | 0.31mi |
| 2615 NW 62nd Ave Unit 2615 Margate, FL | 3.0 | 2.0 | 1349 | $3,500 | $2.59 | 24d | 1 | 0.32mi |
| 6503 Winfield Blvd Margate, FL | 2.0 | 2.0 | 1000 | $1,800 | $1.80 | 7d | 1 | 0.33mi |
| 2601 NW 64th Ter Margate, FL | 2.0 | 1.0 | 945 | $1,850 | $1.96 | 24d | 1 | 0.34mi |
| 6178 Buena Vista Dr Unit 6178 Margate, FL | 3.0 | 2.0 | 1248 | $3,200 | $2.56 | 3d | 1 | 0.36mi |
| 3050 Toscana Ln W Margate, FL | 1.0–3.0 | 1.0–2.0 | 1075 | $2,905 | $2.70 | 2d | 1 | 0.38mi |
| 3332 Orinoco Ln Unit 3332 Margate, FL | 3.0 | 2.5 | 1808 | $3,200 | $1.77 | 13d | 1 | 0.41mi |
| 3332 Orinoco Ln Unit 3332 Margate, FL | 3.0 | 2.5 | 1808 | $3,200 | $1.77 | 7d | 1 | 0.41mi |
| 6631 Winfield Blvd Unit 3-6 Margate, FL | 3.0 | 2.5 | 1190 | $2,500 | $2.10 | 10d | 1 | 0.42mi |
| 6621 Winfield Blvd #1 Margate, FL | 2.0 | 2.5 | 1190 | $2,250 | $1.89 | 24d | 1 | 0.48mi |
| 3436 Orinoco Ln Unit 3436 Margate, FL | 3.0 | 2.0 | 1450 | $3,200 | $2.21 | 24d | 1 | 0.49mi |
| 5755 Winfield Blvd Margate, FL | 2.0 | 1.0 | 1200 | $2,200 | $1.83 | 7d | 1 | 0.51mi |
| 5980 NW 24th Ct Margate, FL | 4.0 | 2.0 | 1448 | $3,440 | $2.38 | 2d | 1 | 0.51mi |
| 5980 NW 24th Ct Margate, FL | 4.0 | 2.0 | 1448 | $3,506 | $2.42 | 7d | 1 | 0.51mi |
| 2294 NW 63rd Ave Margate, FL | 4.0 | 2.0 | 1441 | $3,800 | $2.64 | 24d | 1 | 0.52mi |
| 5555 Celebration Point Ln Margate, FL | 1.0–3.0 | 1.0–2.0 | 970 | $2,890 | $2.98 | 1d | 9 | 0.61mi |
| 3266 W Buena Vista Dr Unit NA Margate, FL | 3.0 | 3.0 | 1500 | $3,300 | $2.20 | 24d | 1 | 0.63mi |
| 3417 Merrick Ct #1206 Margate, FL | 3.0 | 2.5 | 1371 | $2,650 | $1.93 | 24d | 1 | 0.65mi |
| 3126 Merrick Ter #1801 Margate, FL | 3.0 | 3.0 | 1527 | $2,850 | $1.87 | 7d | 1 | 0.66mi |
| 6942 W Sample Rd #6942 Coral Springs, FL | 2.0 | 2.5 | 1203 | $2,400 | $2.00 | 5d | 1 | 0.66mi |
| 6942 W Sample Rd Coral Springs, FL | 2.0 | 1.0 | 1203 | $2,400 | $2.00 | 7d | 1 | 0.66mi |
| 6729 Coral Lake Dr #6729 Margate, FL | 2.0 | 2.0 | 1090 | $1,995 | $1.83 | 10d | 1 | 0.67mi |
| 5533 Courtyard Dr #5533 Margate, FL | 2.0 | 2.0 | 970 | $1,995 | $2.06 | 24d | 1 | 0.70mi |
| 3395 Merrick Ct #1110 Margate, FL | 3.0 | 2.5 | 1518 | $2,650 | $1.75 | 4d | 1 | 0.70mi |
| 3395 Merrick Ct #1110 Margate, FL | 3.0 | 2.5 | 1518 | $2,650 | $1.75 | 3d | 1 | 0.70mi |
| 5820 W Sample Rd #105 Coral Springs, FL | 2.0 | 2.0 | 1134 | $2,250 | $1.98 | 24d | 1 | 0.71mi |
| 5880 W Sample Rd #105 Coral Springs, FL | 2.0 | 2.0 | 1064 | $2,450 | $2.30 | 7d | 1 | 0.71mi |
| 5880 W Sample Rd Coral Springs, FL | 2.0 | 2.0 | 1070 | $2,400 | $2.24 | 1d | 2 | 0.71mi |
| 5980 W Sample Rd #203 Coral Springs, FL | 2.0 | 2.0 | 1076 | $2,250 | $2.09 | 10d | 1 | 0.71mi |
| 5800 W Sample Rd #207 Coral Springs, FL | 2.0 | 2.0 | 1076 | $2,500 | $2.32 | 24d | 1 | 0.71mi |
| 5800 W Sample Rd Coral Springs, FL | 2.0–3.0 | 2.0 | 1216 | $2,500 | $2.06 | 20d | 2 | 0.71mi |
| 6020 W Sample Rd #303 Coral Springs, FL | 2.0 | 2.0 | 1123 | $2,250 | $2.00 | 24d | 1 | 0.71mi |
| 6920 W Sample Rd Unit 6920 Margate, FL | 3.0 | 2.5 | 1450 | $2,995 | $2.07 | 24d | 1 | 0.77mi |
| 6966 W Sample Rd #6966 Coral Springs, FL | 3.0 | 2.5 | 1450 | $2,650 | $1.83 | 7d | 1 | 0.78mi |
| 6952 NW 27th Ct Unit 6952 Margate, FL | 3.0 | 2.0 | 1824 | $4,100 | $2.25 | 16d | 1 | 0.80mi |
| 6106 NW 20th St Unit 1524073P Margate, FL | 3.0 | 2.0 | 1506 | $7,982 | $5.30 | 1d | 1 | 0.80mi |
| 3600 Terrapin Ln Coral Springs, FL | 2.0 | 1.0–2.0 | 870 | $2,576 | $2.96 | 1d | 18 | 0.81mi |
| 6473 NW 20th St Margate, FL | 3.0 | 2.0 | 1704 | $3,200 | $1.88 | 24d | 1 | 0.82mi |
Listing history 16 events
-
2026-06-18days on market $24,900 Active 41 DOM
-
2026-06-17days on market $24,900 Active 40 DOM
-
2026-06-16days on market $24,900 Active 39 DOM
-
2026-06-15days on market $24,900 Active 38 DOM
-
2026-06-13pricedays on market $24,900 Active 36 DOM
-
2026-06-09days on market $29,900 Active 32 DOM
-
2026-06-08days on market $29,900 Active 31 DOM
-
2026-06-07days on market $29,900 Active 30 DOM
-
2026-06-04days on market $29,900 Active 27 DOM
-
2026-06-03days on market $29,900 Active 26 DOM
-
2026-06-02days on market $29,900 Active 25 DOM
-
2026-06-01days on market $29,900 Active 24 DOM
-
2026-05-31days on market $29,900 Active 23 DOM
-
2026-05-13status Active
-
2026-05-03status Pending
-
2026-04-28$29,900 Active
ⓘ Source: listings_history table (triggers on properties + properties_extension) + one-shot
backfill from property_details.listing_events for pre-trigger history.
Climate risk First Street
- Flood 1/10 Low FEMA zone X (unshaded) · 0% chance over 30 yrs
- Wildfire 1/10 Low
- Heat 9/10 Extreme 7 d/yr ≥106°F today · 26 d/yr by 30 yrs out
- Wind 10/10 Extreme 99% chance of damaging wind over 30 yrs
- Air quality 3/10 Moderate 2 unhealthy d/yr today · 3 by 30 yrs out
Nearby sold comps map
Loading sold comps map…
Walkable amenities ~0.75 mi
Loading nearby amenities…
Taxation est. · year 1
- Rental income
- $33,026
- − Mortgage interest
- −$1,395
- − Property taxes
- −$374
- − Insurance
- −$124
- − Repairs & maintenance
- −$2,642
- − Management
- −$2,642
- − Depreciation
- −$724
- Taxable income
- $25,125
- Est. tax owed @ 24.0%
- −$6,030
- After-tax cash flow
- $17,996/yr
For passive investors: Depreciation is non-cash, so a rental often shows a tax loss while cash-flowing — sheltering income. Rental losses are passive: they offset passive income freely, and up to $25,000/yr can offset ordinary (W-2) income if you actively participate and your MAGI is under $100k (phasing out to $0 by $150k); unused losses carry forward. On sale, claimed depreciation is recaptured at up to 25%, and gains may owe capital-gains tax (a 1031 exchange can defer both). Figures are a year-1 estimate at your 24.0% rate — not tax advice; consult a CPA.
Schools (NCES district)
- District
- Broward
- NCES district ID
- 1200180
- Math proficiency
- 42% ▼ -18.00%
- Reading proficiency
- 53% ▼ -5.00%
- Median HH income
- $52,139
- Composite
- 40.88/100
- National rank
- #3621
- State rank
- #46 of 73 in FL
Livability — Margate
- Score
- 81/100
- State rank
- #85
- US rank
- #1398
Category grades
Schools grade is shown separately in the Schools card above.
Census & demographics
- Census place
- Margate, FL
- County
- Broward County · 1,963,430 people
- City population
- 55,466
- Metro
- Miami-Fort Lauderdale-Pompano Beach, FL
- Population (ZIP)
- 55,466
- Household income
- $62,918
- Rent vs Own
- Severe rent burden
- 2290.0
Population outlook (Broward County) Hauer SSP2
- Today (2025)
- 2,207,033 people
- By 2030
- 2,360,704 · +7.0%
- By 2040
- 2,661,208 · +20.6%
- By 2050
- 2,946,698 · +33.5%
- By 2075
- 3,602,273 · +63.2%
- By 2100
- 3,970,984 · +79.9%
Race, ethnicity, and origin ACS 2023
- Neighborhood character
- Highly diverse neighborhood (Simpson 0.72)
- Race & ethnicity
- White 34% Hispanic / Latino 29% Black 28% Two or more races 18% Asian 4%
- Hispanic origin (detail)
- Mexican 2% Puerto Rican 7% Cuban 3% Dominican 3%
- Common ancestry
- Hispanic 6% Romanian 2% Estonian 2%
- Foreign-born
- 36% · Canada, Jamaica, Vietnam
- Languages at home
- 61% English-only · Spanish 24% French/Haitian/Cajun 7% Other Indo-European 4%
Political lean MEDSL · Broward
- 2024 margin
- D (+17.0) · D 58.0% · R 41.0%
- 2008→2024 swing
- -17.8pp toward R · 2008: 34.7pp · 2024: 17.0pp
- All cycles
- 2024: D+17.0 2020: D+29.8 2016: D+35.0 2012: D+34.9 2008: D+34.7
Not yet ingested
- Civics
- —
Market trends
- HPI YoY
- ▼ -87.17%
- Current HPI
- 393.9225
- Rent YoY
- ▲ 1.94%
- Metro
- Miami-Fort Lauderdale-Pompano Beach, FL
- State GDP YoY
- ▲ 3.28%
- F500 in state
- 36
Industry mix (Fortune 500 HQ in FL)
| Industry | F500 HQs | Revenue |
|---|---|---|
| Industrial Technology | 2 | $29B |
|
||
| Insurance | 2 | $17B |
|
||
| Retail | 1 | $60B |
|
||
| Technology Distribution | 1 | $58B |
|
||
| Homebuilding | 1 | $35B |
|
||
| Technology Manufacturing | 1 | $35B |
|
||
Price history
3 events — show timeline
- 2026-05-13 Relisted — MCRTC
- 2026-05-03 Pending — MCRTC
- 2026-04-28 Listed $29,900 MCRTC
Cash-flow waterfall
monthlySold comps — $/sqft
last 12 mo · ≤1 miLoading sold comps…