127 S Meadows Ln · Paintsville, KY
Flood risk 9/10 · Severe
- FEMA flood zone
- AE
- Chance of flooding over 30 yrs
- 0.99%
- Est. flood insurance / yr
- $1,737 – $8,500
Fire risk 4/10 · Minor
- Est. fire insurance / yr
- $839 – $1,559
Heat risk 4/10 · Minor
- Hot days now (above 102°F)
- 7 days/yr
- Hot days in 30 yrs
- 20 days/yr
Wind risk 2/10 · Minimal
- Chance of severe wind over 30 yrs
- 2.0%
Air-quality risk 1/10 · Minimal
- Unhealthy air days now
- 0 days/yr
- Unhealthy air days in 30 yrs
- 0 days/yr
Risk factors via First Street. Map © Google.
Why this score? — see what drove the C+ grade
The composite is a weighted blend of 9 inputs, each scored 0–100. Each bar is that input's sub-score; the figure is the points it added to the 100-point composite (weight × sub-score).
- Cash flow +30.0/30.0
- 1% rule +10.0/10.0
- DSCR +10.0/10.0
- Livability +3.7/5.0
- Appreciation +3.1/10.0
- Rent growth +2.5/5.0
- Schools +2.5/10.0
- Condition / age +1.0/5.0
- ARV discount +0.0/15.0
$44,900
🖨 Deal sheet 📄 Offer letter ✓ Due diligence
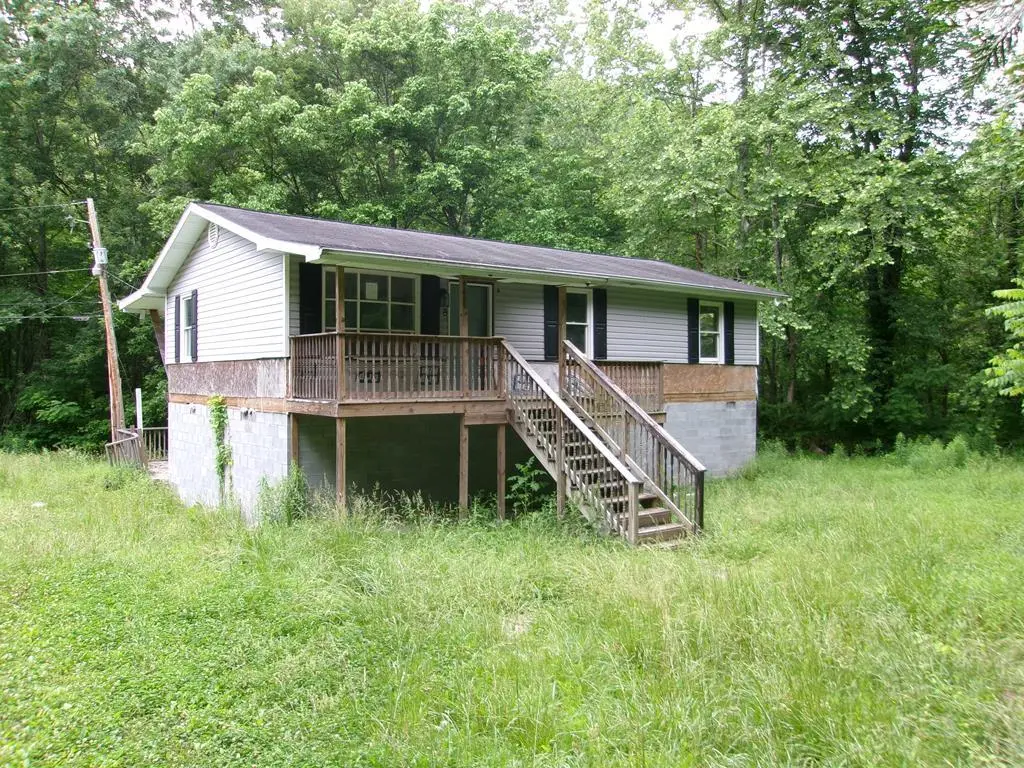
Listing remarks
nice fixer upper good for first time buyer. located in reasonable distance to schools shopping and medical facilities.
Key facts
- 1 acre lot
- Built 1985
- Listed 3 days
Property features AI
Finance
- Other: Lot approximately 1 acre; Directions: from US 23 and 460 take Rt 23 south to Rt 825, turn left then right on Meadow Lane; sign posted
Exterior
- Utilities: Public water
- Home design: Single family residence; Residential property
- Construction: Vinyl siding; Shingle roof
- Exterior features: Deck
Interior
- Flooring: Laminate
- Bathrooms: 1 full bathroom
- Interior features: Laminate flooring; 5 total rooms
Neighborhood map
What this means for you Summary
Snapshot
- This is a 3-bed/1.0-bath single-family listed at $45k. Condition is rated poor.
Deal economics
- At list price, monthly cash flow is $18 ($219/yr) — positive.
- The deal already cash-flows at list — no discount required.
- Meets the 1% rule at list price ($956 rent vs $45k).
- Cap rate 18.2% vs local median 3.2% in Paintsville — top-decile yield for the area; either an underpriced asset or a hidden risk that comps aren't pricing in. Stress-test before assuming the spread holds.
Location & tenants
- Location reads 73/100 on livability (#117 in KY) — a middle-class / working-renter tenant base. Strengths: crime A+, cost of living A+, health & safety A+; Watch: amenities F, commute F, employment F.
- Johnson County (rural): math 23% / reading 39% proficiency, ranked #103 of 165 in KY (top 62%) — families likely to look elsewhere, expect single-tenant / working-renter base with shorter leases.
- Zoned schools: Porter Elementary School (math 17% / reading 37%, grade F, #434 of 676 statewide, top 69%, 412 students, 55% FRL); Johnson County Middle School (math 25% / reading 49%, grade F, #80 of 217 statewide, top 41%, 475 students, 61% FRL); Johnson Central High School (math 20% / reading 25%, grade F, #200 of 254 statewide, top 79%, 955 students, 61% FRL) — zoned schools at 59% FRL track the district average.
- Market conditions: 14 active listings in the ZIP.
Forward outlook
- Local home prices are declining (-3.0%/yr); year-one equity from $310 of loan paydown is wiped out by about $1k of value loss. Plan a longer hold.
- Johnson County population projected at -18% by 2050 — secular population decline; favor cash flow + early exit over multi-decade hold.
Negotiation context
- Only 4 days on market — expect competitive offers; lowballing is unlikely to land.
Risks & watch-outs
- Watch-outs: flood insurance adds $427/mo.
- Climate carrying-cost: in FEMA flood zone AE (mandatory federal flood insurance) — expect insurance premiums to compound above CPI over the hold.
Questions for the listing agent
- Have any recent inspections been done? Can we get a copy of the seller's disclosures and any deferred-maintenance estimates?
- What's the actual annual flood-insurance premium (NFIP or private), and is the property in a SFHA with mandatory coverage?
- Is there a deadline driving the sale (1031 exchange, divorce, estate, relocation)? That informs how much negotiation room exists.
- Schools are B-rated — typically a magnet for longer-tenancy family renters. What's the average tenant stay here, and is there a school-zone premium baked into asking?
- What's the average days-on-market for RENTAL listings here right now (not sales)? A rising rental-DOM trend means longer vacancies and softer asking-rent achievability than the comps imply.
- What's the recent tenant-quality profile in this submarket — average credit score on applications, eviction rate, late-payment / NSF rate, and stable-employment percentage? A property-management company in the area should have these aggregated.
- How much new for-sale + rental construction is in the pipeline within 1–3 miles? Heavy new supply typically softens prices + rents 12–24 months out; constrained supply supports both.
Investment metrics
- 1% rule
- 2.13% ✓
- Cap rate
- 18.18%
- Cash-on-cash
- 42.45%
- DSCR
- 2.89
- GRM
- 3.9
CMA / ARV
- ARV (on-the-fly)
- $30,720
- Comps found
- 1
Show comp detail 1 sale within ~0.75 mi
| Address | Dist | Beds/Ba | Sqft | Sold | Price | $/sf | Match |
|---|---|---|---|---|---|---|---|
| 2547 KY Rt. 825 | 0.67mi | 3/1.0 | 1,029 (+7%) | 24mo | $32,900 | $32 | 37 |
Match score weights: distance 35% · size 25% · config 20% · recency 20%. Top-matched comps best support the ARV.
Projected returns pro-forma
-3.0% appreciation · 3.0% rent growth · sell at horizon
- IRR
- -12.8%
- Equity multiple
- 0.54×
- Total profit
- $-5,839
- Equity at exit
- $6,695
- IRR
- -2.8%
- Equity multiple
- 0.80×
- Total profit
- $-2,467
- Equity at exit
- $3,882
Cash invested: $12,572 (down + closing). Projections, not guarantees.
Landlord ↔ Tenant lean methodology
- Overall (STATE)
- 83 Strongly Landlord-Friendly
- State Kentucky
- 83 Strongly Landlord-Friendly · R+16
- County
- — inherits STATE
- City
- — inherits STATE
ZIP-level market 41222
- Home prices YoY
- -1.9%
- Active inventory
- 14
- Price-to-rent
- 3.9×
Monthly cashflow live
- Estimated rent
- $956 medium interval (Pro) →
- Mortgage (P&I)
- −$235
- Tax est. 1.5%
- −$56 /mo · $674/yr
- Insurance
- −$19
- Flood insurance flood zone
- −$427 /mo · $5,118/yr
- HOA
- −$0
- Vacancy / Maint / Mgmt
- −$201
- Net cashflow
- $18
Break-even live
UW: 25.0% down · 7.5% · 30yr · 1.5% tax · 5.0% vac · 8.0% maint · 8.0% mgmt
Financing live
Cash to close
- Down payment
- $11,225
- Closing costs
- $1,347
- Reserves months
- —
- Total cash needed
- —
Loan-product check · same deal, 3 products live
Conventional
25% down · 7.5% · 30yr
- Down + closing
- —
- Monthly P&I
- —
- Monthly cashflow
- —
- DSCR
- —
- Eligible?
- —
Personal DTI + credit; lowest rate.
DSCR
20% down · 8.5% · 30yr
- Down + closing
- —
- Monthly P&I
- —
- Monthly cashflow
- —
- DSCR
- —
- Eligible?
- —
No personal income docs; deal must DSCR.
Hard money
10% down · 12.0% · 12mo
- Down + closing
- —
- Monthly P&I
- —
- Monthly cashflow
- —
- DSCR
- —
- Eligible?
- —
Short-term bridge; refi at stabilization.
Listing history 5 events
-
2026-06-18days on market $44,900 Active 4 DOM
-
2026-06-17days on market $44,900 Active 3 DOM
-
2026-06-16days on market $44,900 Active 2 DOM
-
2026-06-15remarks 118-char remark
-
2026-06-15$44,900 Active 1 DOM
ⓘ Source: listings_history table (triggers on properties + properties_extension) + one-shot
backfill from property_details.listing_events for pre-trigger history.
Climate risk First Street
- Flood 9/10 Extreme FEMA zone AE · 99% chance over 30 yrs
- Wildfire 4/10 Moderate
- Heat 4/10 Moderate 7 d/yr ≥102°F today · 20 d/yr by 30 yrs out
- Wind 2/10 Low 2% chance of damaging wind over 30 yrs
- Air quality 1/10 Low 0 unhealthy d/yr today · 0 by 30 yrs out
Nearby sold comps map
Loading sold comps map…
Walkable amenities ~0.75 mi
Loading nearby amenities…
Taxation est. · year 1
- Rental income
- $11,469
- − Mortgage interest
- −$2,515
- − Property taxes
- −$674
- − Insurance
- −$5,343
- − Repairs & maintenance
- −$918
- − Management
- −$918
- − Depreciation
- −$1,306
- Taxable loss
- −$204
- Est. tax savings @ 24.0%
- +$49
- After-tax cash flow
- $267/yr
For passive investors: Depreciation is non-cash, so a rental often shows a tax loss while cash-flowing — sheltering income. Rental losses are passive: they offset passive income freely, and up to $25,000/yr can offset ordinary (W-2) income if you actively participate and your MAGI is under $100k (phasing out to $0 by $150k); unused losses carry forward. On sale, claimed depreciation is recaptured at up to 25%, and gains may owe capital-gains tax (a 1031 exchange can defer both). Figures are a year-1 estimate at your 24.0% rate — not tax advice; consult a CPA.
Condition & rehab AI · 8 photos
This fixer-upper requires extensive repairs and renovations to become move-in ready. Immediate focus should be on exterior and interior repairs to improve curb appeal and property value.
Repairs flagged
- Major Exterior siding — Peeling paint and general disrepair
- Major Kitchen cabinets — Exposed and unfinished
- Major Bathroom plumbing — Exposed and unfinished
- Major Flooring — Worn and uneven
- Major Paint — Peeling and unfinished spaces
Value-add opportunities
- Both Landscaping and exterior repairs — Improves curb appeal and property value
- Both Kitchen and bathroom renovations — Updates essential living spaces
- Both Painting and interior repairs — Enhances interior appearance and value
Renovation cost estimate screening
| Repair item | Severity | Est. cost |
|---|---|---|
| Exterior siding · Peeling paint and general disrepair | Major | $15,000–50,000 |
| Kitchen cabinets · Exposed and unfinished | Major | $15,000–50,000 |
| Bathroom plumbing · Exposed and unfinished | Major | $15,000–50,000 |
| Flooring · Worn and uneven | Major | $15,000–50,000 |
| Paint · Peeling and unfinished spaces | Major | $15,000–50,000 |
| Total estimated repair cost · 5 items | $75,000–250,000 |
Value-add ROI direction
- Both Landscaping and exterior repairs — Improves curb appeal and property value ↑
- Both Kitchen and bathroom renovations — Updates essential living spaces ↑
- Both Painting and interior repairs — Enhances interior appearance and value ↑
ⓘ Cost ranges are severity-bucket heuristics (US national rule-of-thumb). Get contractor quotes + a written scope before underwriting a rehab budget.
Schools (NCES district)
- District
- Johnson County
- NCES district ID
- 2103060
- Math proficiency
- 23% ▼ -26.00%
- Reading proficiency
- 39% ▼ -23.00%
- Median HH income
- $34,508
- Composite
- 25.49/100
- National rank
- #7441
- State rank
- #103 of 165 in KY
Livability — Paintsville
- Score
- 73/100
- State rank
- #117
- US rank
- #5546
Category grades
Schools grade is shown separately in the Schools card above.
Census & demographics
- City population
- 6,495
- Population (ZIP)
- 2,655
Population outlook (Johnson County) Hauer SSP2
- Today (2025)
- 22,330 people
- By 2030
- 21,570 · -3.4%
- By 2040
- 19,849 · -11.1%
- By 2050
- 18,204 · -18.5%
- By 2075
- 14,588 · -34.7%
- By 2100
- 11,127 · -50.2%
Race, ethnicity, and origin ACS 2023
- Neighborhood character
- Predominantly White (99%)
- Race & ethnicity
- White 99% Two or more races 1%
- Common ancestry
- Serbian 1% Lithuanian 1% Slovak 1%
Political lean MEDSL · Johnson
- 2024 margin
- Solid R (+70.7) · D 14.0% · R 84.7% · Other 1.3%
- 2008→2024 swing
- -29.1pp toward R · 2008: -41.6pp · 2024: -70.7pp
- All cycles
- 2024: R+70.7 2020: R+67.1 2016: R+71.0 2012: R+59.5 2008: R+41.6
Not yet ingested
- Civics
- —
Market trends
- HPI YoY
- ▼ -3.78%
- Current HPI
- 190.8111
- Rent YoY
- —
- Metro
- —
- State GDP YoY
- ▲ 1.81%
- F500 in state
- 4
Industry mix (Fortune 500 HQ in KY)
| Industry | F500 HQs | Revenue |
|---|---|---|
| Healthcare | 1 | $118B |
|
||
| Food / Beverage | 1 | $7B |
|
||
Price history
1 event — show timeline
- 2026-06-14 Listed $44,900 EKAR
Cash-flow waterfall
monthlySold comps — $/sqft
last 12 mo · ≤1 miLoading sold comps…