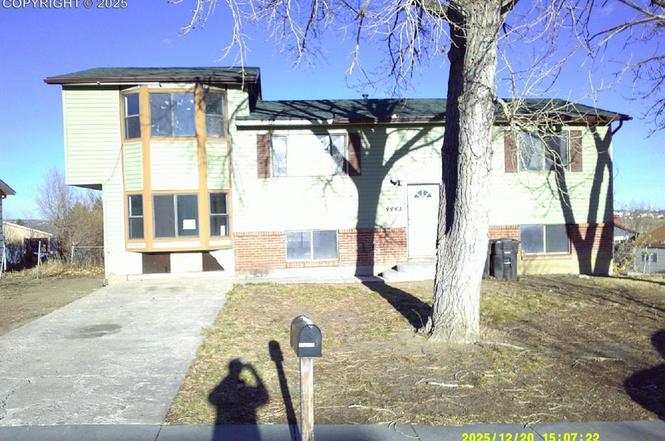
4445 Millburn Dr · Stratmoor, CO
Flood risk 1/10 · Minimal
- FEMA flood zone
- X (unshaded)
- Chance of flooding over 30 yrs
- 0.0%
- Est. flood insurance / yr
- $473 – $860
Fire risk 6/10 · Moderate
- Est. fire insurance / yr
- $939 – $1,743
Heat risk 3/10 · Minor
- Hot days now (above 91°F)
- 7 days/yr
- Hot days in 30 yrs
- 19 days/yr
Wind risk 2/10 · Minimal
- Chance of severe wind over 30 yrs
- —
Air-quality risk 1/10 · Minimal
- Unhealthy air days now
- 0 days/yr
- Unhealthy air days in 30 yrs
- 0 days/yr
Risk factors via First Street. Map © Google.
Why this score? — see what drove the C+ grade
The composite is a weighted blend of 9 inputs, each scored 0–100. Each bar is that input's sub-score; the figure is the points it added to the 100-point composite (weight × sub-score).
- Cash flow +24.8/30.0
- ARV discount +15.0/15.0
- DSCR +8.0/10.0
- 1% rule +5.4/10.0
- Livability +3.2/5.0
- Condition / age +2.5/5.0
- Rent growth +2.1/5.0
- Schools +2.1/10.0
- Appreciation +0.0/10.0
$230,000
🖨 Deal sheet 📄 Offer letter ✓ Due diligence
Listing remarks
Investment property located in an established neighborhood. Years of deferred maintenance present. Uncommon floor plan as you navigate through the home. Electricity is not active. Sunroom located at the rear of home with slider access to dining nook and rear door that leads to raised deck. . Three sheds in the backyard for plenty of storage. One bathroom located on each level. Fixtures, hardware and and majority of other interior features are dated. Drywall ceiling and walls, along with bathroom tile require replacement throughout the home. Confirmed structural damage evidenced by interior cracks in wall and uneven flooring.
Key facts
- Plenty of storage
- Uncommon floor plan
- Sunroom
Tags
Property features AI
Finance
- Financial info: Cash terms
- HOA & community: No HOA; No association fees
Exterior
- Parking: No garage remotes reported
- Utilities: Municipal water; Utilities: see property description
- Home design: Single family home; Existing home
- Construction: Wood frame construction; Aluminum/vinyl/steel siding; Composite shingle roof; Partial basement (about 82% finished)
- Exterior features: Composite and wood deck patio; Rear fence; Storage shed; Concrete driveway; Near fire station; Near public transit
Interior
- Flooring: Carpet; Vinyl/linoleum
- Bathrooms: One full bathroom; Two three-quarter bathrooms
- Heating & cooling: Natural gas heating; Central air conditioning; Ceiling fans
- Interior features: See property description remarks; Ceiling fan(s); Central air
- Laundry & utility: Laundry in basement
Neighborhood map
What this means for you Summary
Snapshot
- This is a 5-bed/3.0-bath single-family listed at $230k.
Deal economics
- At list price, monthly cash flow is $488 ($6k/yr) — positive.
- The deal already cash-flows at list — no discount required.
- Meets the 1% rule at list price ($2k rent vs $230k).
- Recommended offer: $202k (12.0% below list) — sets the bar for market timing.
- Cap rate 8.8% vs local median 4.2% in Stratmoor — top-decile yield for the area; either an underpriced asset or a hidden risk that comps aren't pricing in. Stress-test before assuming the spread holds.
Location & tenants
- Location reads 65/100 on livability (#156 in CO) — a middle-class / working-renter tenant base. Strengths: housing A+, health & safety A+, cost of living B+; Watch: schools F, crime F, amenities F.
- Harrison School District No. 2 In The County Of El Paso An (urban): math 16% / reading 35% proficiency, ranked #67 of 86 in CO (top 78%) — low school quality limits family demand, transient renter base, plan for 1-2y turnover; 62% free/reduced lunch — lower-income household profile, screen leases tightly.
- Market conditions: Rents soft (-1.5%/yr); 183 active listings in the ZIP; 5 comparable units currently listed for rent nearby; rentals leasing fast (median 3d on market — plan ~1-2 weeks tenant-placement turnaround); 3,906 units permitted in El Paso County in 2024 (872 in 5+ unit buildings).
- At $2,397/mo this rent would consume 46% of the median local household income ($62k/yr) (locally 1449% of renters already pay >50% of income on rent) — very limited rent-growth headroom before tenants either downsize or default.
Forward outlook
- Local home prices are declining (-3.0%/yr); year-one equity from $2k of loan paydown is wiped out by about $7k of value loss. Plan a longer hold.
- El Paso County population projected at +28% by 2050 — long-run rental-demand tailwind backs the buy-and-hold thesis.
Negotiation context
- It's been on market 178 days — a 12% lower offer ($202k) is reasonable based on typical stale-listing flexibility.
- 2 sale attempts; this cycle's ask has dropped $59k (20%) from the opening price — seller is motivated, your offer sets the floor, not the list.
- Current owner paid $49k; list at $230k implies a 371% gain — meaningful room to come down on a strong offer.
Risks & watch-outs
- Climate carrying-cost: major wildfire risk — expect insurance premiums to compound above CPI over the hold.
Questions for the listing agent
- It's been on market 178 days. Have you received any prior offers? Is the seller open to a 12% concession, seller financing, or rate buy-down credit?
- Why hasn't it sold? Are there any deal-killer items the seller is aware of (foundation, flood, title, zoning, code violations)?
- Is there a deadline driving the sale (1031 exchange, divorce, estate, relocation)? That informs how much negotiation room exists.
- Schools are F-rated, which usually means shorter tenancies and higher turnover. Who's the typical renter profile here, and what's been the actual vacancy rate?
- Crime grade is F in this area — have there been break-ins, vandalism, or insurance claims at this property in the last 3 years? What carrier currently insures it and at what premium?
- What's the average days-on-market for RENTAL listings here right now (not sales)? A rising rental-DOM trend means longer vacancies and softer asking-rent achievability than the comps imply.
- What's the recent tenant-quality profile in this submarket — average credit score on applications, eviction rate, late-payment / NSF rate, and stable-employment percentage? A property-management company in the area should have these aggregated.
- How much new for-sale + rental construction is in the pipeline within 1–3 miles? Heavy new supply typically softens prices + rents 12–24 months out; constrained supply supports both.
Investment metrics
- 1% rule
- 1.04% ✓
- Cap rate
- 8.84%
- Cash-on-cash
- 9.09%
- DSCR
- 1.40
- GRM
- 8.0
CMA / ARV
- ARV (on-the-fly)
- $411,051
- Comps found
- 12
Show comp detail 12 sales within ~0.75 mi
| Address | Dist | Beds/Ba | Sqft | Sold | Price | $/sf | Match |
|---|---|---|---|---|---|---|---|
| 449 Loomis Ave | 0.45mi | 5/3.0 | 2,276 (+0%) | 7mo | $335,000 | $147 | 73 |
| 547 Loomis Ave | 0.60mi | 4/2.0 (-1) | 2,272 (0%) | 7mo | $385,000 | $169 | 57 |
| 570 Catalina Dr | 0.55mi | 5/3.0 | 2,494 (+10%) | 1mo | $402,000 | $161 | 57 |
| 520 Crestridge Ave | 0.72mi | 4/3.0 (-1) | 2,371 (+4%) | 1mo | $470,000 | $198 | 53 |
| 2782 Park Crest Ct | 0.65mi | 4/3.5 (-1) | 2,117 (-7%) | 1mo | $425,000 | $201 | 51 |
| 1518 S Canoe Creek Dr | 0.63mi | 4/3.0 (-1) | 2,520 (+11%) | 5mo | $500,000 | $198 | 43 |
| 1501 Coolcrest Dr | 0.58mi | 4/3.0 (-1) | 2,036 (-10%) | 11mo | $460,000 | $226 | 41 |
| 526 Catalina Dr | 0.58mi | 4/2.0 (-1) | 2,052 (-10%) | 17mo | $350,000 | $171 | 34 |
| 1144 Cambridge Ave | 0.61mi | 4/2.0 (-1) | 1,960 (-14%) | 9mo | $355,000 | $181 | 32 |
| 19 E Clover Cir | 0.71mi | 4/3.0 (-1) | 2,598 (+14%) | 8mo | $460,000 | $177 | 32 |
| 539 Crestridge Ave | 0.67mi | 4/3.0 (-1) | 2,546 (+12%) | 18mo | $517,000 | $203 | 29 |
| 1211 Livingston Ave | 0.70mi | 4/3.5 (-1) | 2,578 (+14%) | 16mo | $430,000 | $167 | 25 |
Match score weights: distance 35% · size 25% · config 20% · recency 20%. Top-matched comps best support the ARV.
Projected returns pro-forma
-3.0% appreciation · 0.0% rent growth · sell at horizon
- IRR
- -5.7%
- Equity multiple
- 0.79×
- Total profit
- $-13,316
- Equity at exit
- $34,294
- IRR
- 0.2%
- Equity multiple
- 1.01×
- Total profit
- $936
- Equity at exit
- $19,886
Cash invested: $64,400 (down + closing). Projections, not guarantees.
Landlord ↔ Tenant lean methodology
- Overall (STATE)
- 38 Tenant-Leaning
- State Colorado
- 38 Tenant-Leaning · D+4
- County
- — inherits STATE
- City
- — inherits STATE
ZIP-level market 80910
- Home prices YoY
- -27.5%
- Rents YoY
- -1.5%
- Active inventory
- 183
- Price-to-rent
- 8.0×
Monthly cashflow live
- Estimated rent
- $2,397 high interval (Pro) →
- Mortgage (P&I)
- −$1,206
- Tax from tax record
- −$104 /mo · $1,247/yr
- Insurance
- −$96
- HOA
- −$0
- Vacancy / Maint / Mgmt
- −$503
- Net cashflow
- $488
Break-even live
Sensitivity live
| Price | -10% $618 | -5% $553 | +0% $488 | +5% $422 | +10% $357 |
|---|---|---|---|---|---|
| Rent | -10% $298 | -5% $393 | +0% $488 | +5% $582 | +10% $677 |
| Rate | -1.0pp $603 | -0.5pp $546 | base $488 | +0.5pp $428 | +1.0pp $367 |
UW: 25.0% down · 7.5% · 30yr · 1.5% tax · 5.0% vac · 8.0% maint · 8.0% mgmt
Financing live
Cash to close
- Down payment
- $57,500
- Closing costs
- $6,900
- Reserves months
- —
- Total cash needed
- —
Loan-product check · same deal, 3 products live
Conventional
25% down · 7.5% · 30yr
- Down + closing
- —
- Monthly P&I
- —
- Monthly cashflow
- —
- DSCR
- —
- Eligible?
- —
Personal DTI + credit; lowest rate.
DSCR
20% down · 8.5% · 30yr
- Down + closing
- —
- Monthly P&I
- —
- Monthly cashflow
- —
- DSCR
- —
- Eligible?
- —
No personal income docs; deal must DSCR.
Hard money
10% down · 12.0% · 12mo
- Down + closing
- —
- Monthly P&I
- —
- Monthly cashflow
- —
- DSCR
- —
- Eligible?
- —
Short-term bridge; refi at stabilization.
Rent comps 5 comps
| Address | Beds | Baths | Sqft | Rent | $/sqft | DOM | Units | Dist |
|---|---|---|---|---|---|---|---|---|
| 2766 Park Crest Ct Colorado Springs, CO | 4.0 | 3.0 | 2508 | $2,605 | $1.04 | 3d | 1 | 0.62mi |
| 1345 Coolcrest Dr Colorado Springs, CO | 4.0 | 2.5 | 1783 | $2,321 | $1.30 | 3d | 1 | 0.77mi |
| 1329 Nutwood Dr Colorado Springs, CO | 5.0 | 3.0 | 3127 | $2,500 | $0.80 | 3d | 1 | 0.79mi |
| 1308 Hartford St Colorado Springs, CO | 4.0 | 2.0 | 1666 | $1,950 | $1.17 | 24d | 1 | 0.84mi |
| 850 Quail Lake Cir Colorado Springs, CO | 4.0 | 3.0 | 2117 | $2,250 | $1.06 | 11d | 1 | 1.48mi |
Listing history 23 events
-
2026-06-18days on market $230,000 Active 178 DOM
-
2026-06-18status $230,000 Active 177 DOM
-
2026-06-17days on market $230,000 Under Contract - Showing 177 DOM
-
2026-06-16days on market $230,000 Under Contract - Showing 176 DOM
-
2026-06-15days on market $230,000 Under Contract - Showing 175 DOM
-
2026-06-14days on market $230,000 Under Contract - Showing 173 DOM
-
2026-06-13days on market $230,000 Under Contract - Showing 172 DOM
-
2026-06-10days on market $230,000 Under Contract - Showing 170 DOM
-
2026-06-09days on market $230,000 Under Contract - Showing 169 DOM
-
2026-06-08days on market $230,000 Under Contract - Showing 168 DOM
-
2026-06-07days on market $230,000 Under Contract - Showing 167 DOM
-
2026-06-05days on market $230,000 Under Contract - Showing 164 DOM
-
2026-06-03days on market $230,000 Under Contract - Showing 163 DOM
-
2026-06-03days on market $230,000 Under Contract - Showing 162 DOM
-
2026-06-01days on market $230,000 Under Contract - Showing 161 DOM
-
2026-05-31days on market $230,000 Under Contract - Showing 160 DOM
-
2026-05-19historical Under Contract - Showing
-
2026-04-30price $230,000
-
2026-03-28price $275,000
-
2026-03-18status Active
-
2026-02-05historical Under Contract - Showing
-
2025-12-21$289,000 Active
-
1980-07-01soldstatus $48,800
ⓘ Source: listings_history table (triggers on properties + properties_extension) + one-shot
backfill from property_details.listing_events for pre-trigger history.
Tax reassessment forecast CO · Resets to sale price
- Current annual tax
- $1,247 · $104/mo
- Projected year-2 tax
- $1,265 · $105/mo
- Expected delta
- +$18/yr (+$2/mo · 1.5%)
ⓘ Screening estimate from a state-policy table — verify with the county assessor before closing.
Climate risk First Street
- Flood 1/10 Low FEMA zone X (unshaded) · 0% chance over 30 yrs
- Wildfire 6/10 Major
- Heat 3/10 Moderate 7 d/yr ≥91°F today · 19 d/yr by 30 yrs out
- Wind 2/10 Low
- Air quality 1/10 Low 0 unhealthy d/yr today · 0 by 30 yrs out
Nearby sold comps map
Loading sold comps map…
Walkable amenities ~0.75 mi
Loading nearby amenities…
Taxation est. · year 1
- Rental income
- $28,761
- − Mortgage interest
- −$12,884
- − Property taxes
- −$1,247
- − Insurance
- −$1,150
- − Repairs & maintenance
- −$2,301
- − Management
- −$2,301
- − Depreciation
- −$6,691
- Taxable income
- $2,188
- Est. tax owed @ 24.0%
- −$525
- After-tax cash flow
- $5,326/yr
For passive investors: Depreciation is non-cash, so a rental often shows a tax loss while cash-flowing — sheltering income. Rental losses are passive: they offset passive income freely, and up to $25,000/yr can offset ordinary (W-2) income if you actively participate and your MAGI is under $100k (phasing out to $0 by $150k); unused losses carry forward. On sale, claimed depreciation is recaptured at up to 25%, and gains may owe capital-gains tax (a 1031 exchange can defer both). Figures are a year-1 estimate at your 24.0% rate — not tax advice; consult a CPA.
Schools (NCES district)
- District
- Harrison School District No. 2 In The County Of El Paso An
- NCES district ID
- 0804530
- Math proficiency
- 16% ▼ -13.00%
- Reading proficiency
- 35% ▼ -7.00%
- Median HH income
- $40,242
- Composite
- 21.47/100
- National rank
- #8333
- State rank
- #67 of 86 in CO
Livability — Stratmoor
- Score
- 65/100
- State rank
- #156
- US rank
- #12505
Category grades
Schools grade is shown separately in the Schools card above.
Census & demographics
- Census place
- Stratmoor, CO
- County
- El Paso County · 689,348 people
- Metro
- Colorado Springs, CO
- Population (ZIP)
- 31,368
- Household income
- $61,969
- Rent vs Own
- Severe rent burden
- 1449.0
Population outlook (El Paso County) Hauer SSP2
- Today (2025)
- 768,926 people
- By 2030
- 815,739 · +6.1%
- By 2040
- 903,489 · +17.5%
- By 2050
- 981,204 · +27.6%
- By 2075
- 1,155,542 · +50.3%
- By 2100
- 1,202,070 · +56.3%
Race, ethnicity, and origin ACS 2023
- Neighborhood character
- Diverse neighborhood (Simpson 0.68)
- Race & ethnicity
- White 44% Hispanic / Latino 33% Two or more races 17% Black 11% Native American 3% Asian 3%
- Hispanic origin (detail)
- Mexican 24% Puerto Rican 3%
- Common ancestry
- Italian 2% Slovak 2% Lithuanian 2%
- Foreign-born
- 11% · Canada, South Korea
- Languages at home
- 78% English-only · Spanish 17% German/W. Germanic 1% Other Indo-European 1%
Political lean MEDSL · El Paso
- 2024 margin
- Lean R (+9.8) · D 43.8% · R 53.5% · Other 2.7%
- 2008→2024 swing
- +9.0pp toward D · 2008: -18.8pp · 2024: -9.8pp
- All cycles
- 2024: R+9.8 2020: R+10.8 2016: R+22.6 2012: R+21.4 2008: R+18.8
Not yet ingested
- Civics
- —
Market trends
- HPI YoY
- ▼ -121.36%
- Current HPI
- 320.6817
- Rent YoY
- ▼ -1.51%
- Metro
- Colorado Springs, CO
- State GDP YoY
- ▲ 1.95%
- F500 in state
- 14
Industry mix (Fortune 500 HQ in CO)
| Industry | F500 HQs | Revenue |
|---|---|---|
| Technology Distribution | 1 | $31B |
|
||
| Food / Agriculture | 1 | $18B |
|
||
| Packaging | 1 | $14B |
|
||
| Healthcare | 1 | $13B |
|
||
| Energy | 1 | $10B |
|
||
| Technology | 1 | $4B |
|
||
Price history
+371.3% since first listed7 events — show timeline
- 2026-05-19 Contingent — elevateMLS
- 2026-04-30 Price Changed $230,000 elevateMLS
- 2026-03-28 Price Changed $275,000 elevateMLS
- 2026-03-18 Relisted — elevateMLS
- 2026-02-05 Contingent — elevateMLS
- 2025-12-21 Listed $289,000 elevateMLS
- 1980-07-01 Sold (Public Records) $48,800 Public Records
Property tax history
+3.2%/yrLatest (2024): $1,247 · +46.8% YoY. Source: county tax records.
Cash-flow waterfall
monthlySold comps — $/sqft
last 12 mo · ≤1 miLoading sold comps…